
Resistance is Futile: Gradually Declining Immunity Retains the Exponential Duration of Immunity-Free Diffusion
Proceedings of the Thirty-Fourth International Joint Conference on Artificial Intelligence. Main Track. Pages 108-116.
https://doi.org/10.24963/ijcai.2025/13
Keywords
- Agent-based and Multi-agent Systems: MAS: Agent theories and models
Abstract
Diffusion processes pervade numerous areas of AI, abstractly modeling the dynamics of exchanging, oftentimes volatile, information in networks. A central question is how long the information remains in the network, known as survival time. For the commonly studied SIS process, the expected survival time is at least super-polynomial in the network size already on star graphs, for a wide range of parameters. In contrast, the expected survival time of the SIRS process, which introduces temporary immunity, is always at most polynomial on stars and only known to be super-polynomial for far denser networks, such as expanders. However, this result relies on featuring full temporary immunity, which is not always present in actual processes. We introduce the cSIRS process, which incorporates gradually declining immunity such that the expected immunity at each point in time is identical to that of the SIRS process. We study the survival time of the cSIRS process rigorously on star graphs and expanders and show that its expected survival time is very similar to that of the SIS process, which features no immunity. This suggests that featuring gradually declining immunity is almost as having none at all.
- [Águas et al., 2006] Ricardo Águas, Guilherme Gonc ¸alves, and M Gabriela M Gomes. Pertussis: increasing disease as a consequence of reducing transmission. The Lancet infectious diseases, 6(2):112-117, 2006.
- [Bancal and Pastor-Satorras, 2010] Jean-Daniel Bancal and Romualdo Pastor-Satorras. Steady-state dynamics of the forest fire model on complex networks. The European Physical Journal B (EPJB), 76(1):109-121, 2010.
- [Berger et al., 2005] Noam Berger, Christian Borgs, Jen- nifer T. Chayes, and Amin Saberi. On the spread of viruses on the internet. Symposium on Discrete Algorithms (SODA), page 301-310, 2005.
- [Borgs et al., 2010] Christian Borgs, Jennifer Chayes, Ayal- vadi Ganesh, and Amin Saberi. How to distribute antidote to control epidemics. Random Structures & Algorithms, 37(2):204-222, 2010.
- [Feller, 1968] William Feller. An Introduction to Probability Theory and its Applications, volume 1. John Wiley & Sons, 3 edition, 1968.
- [Ferreira et al., 2012] Silvio C. Ferreira, Claudio Castellano, and Romualdo Pastor-Satorras. Epidemic thresholds of the susceptible-infected-susceptible model on networks: A comparison of numerical and theoretical results. Physical Review E, 86:041125, Oct 2012.
- [Ferreira et al., 2016] Silvio C. Ferreira, Renan S. Sander, and Romualdo Pastor-Satorras. Collective versus hub acti- vation of epidemic phases on networks. Physical Review E, 93(3):032314, 2016.
- [Fouchet et al., 2008] David Fouchet, John O'Brien, and Do- minique Pontier. Visiting sick people: is it really detrimen- tal to our health? Plos one, 3(6):e2299, 2008.
- [Friedrich et al., 2024a] Tobias Friedrich, Andreas Göbel, Nicolas Klodt, Martin S. Krejca, and Marcus Pappik. Anal- ysis of the survival time of the sirs process via expansion. Electronic Journal of Probability, 29:1-29, 2024.
- [Friedrich et al., 2024b] Tobias Friedrich, Andreas Göbel, Nicolas Klodt, Martin S Krejca, and Marcus Pappik. The irrelevance of influencers: Information diffusion with re- activation and immunity lasts exponentially long on social network models. In 38th Annual AAAI Conference on Arti- ficial Intelligence, pages 17389-17397, 2024.
- [Gaebler et al., 2021] Christian Gaebler, Zijun Wang, Julio CC Lorenzi, Frauke Muecksch, Shlomo Finkin, Minami Tokuyama, Alice Cho, Mila Jankovic, Dennis Schaefer-Babajew, Thiago Y Oliveira, et al. Evo- lution of antibody immunity to sars-cov-2. Nature, 591(7851):639-644, 2021.
- [Ganesh et al., 2005] Ayalvadi Ganesh, Laurent Massoulié, and Don Towsley. The effect of network topology on the spread of epidemics. In International Conference on Com- puter Communications (INFOCOM), pages 1455-1466, 2005.
- [Israel et al., 2022] Ariel Israel, Yotam Shenhar, Ilan Green, Eugene Merzon, Avivit Golan-Cohen, Alejandro A. Schäffer, Eytan Ruppin, Shlomo Vinker, and Eli Ma- gen. Large-scale study of antibody titer decay following bnt162b2 mrna vaccine or sars-cov-2 infection. Vaccines, 10(1):64, 2022.
- [Jiang et al., 2023] Julie Jiang, Xiang Ren, and Emilio Fer- rara. Retweet-bert: Political leaning detection using lan- guage features and information diffusion on social net- works. In Proceedings of the International AAAI Confer- ence on Web and Social Media, pages 459-469, 2023.
- [Kempe et al., 2003] David Kempe, Jon Kleinberg, and Éva Tardos. Maximizing the spread of influence through a social network. In Proceedings of the ninth ACM SIGKDD international conference on Knowledge discovery and data mining, pages 137-146, 2003.
- [Kuperman and Abramson, 2001] Marcelo Kuperman and Guillermo Abramson. Small world effect in an epidemi- ological model. Physical Review Letters, 86:2909-2912, 2001.
- [Lam et al., 2024] Phuc Lam, Oanh Nguyen, and Iris Yang. Optimal bound for survival time of the sirs process on star graphs. arXiv preprint arXiv:2412.21138, 2024.
- [Leskovec et al., 2007] Jure Leskovec, Andreas Krause, Car- los Guestrin, Christos Faloutsos, Jeanne VanBriesen, and Natalie Glance. Cost-effective outbreak detection in net- works. In Proceedings of the 13th ACM SIGKDD interna- tional conference on Knowledge discovery and data mining, pages 420-429, 2007.
- [Liu et al., 2023] Yang Liu, Yu Rong, Zhuoning Guo, Nuo Chen, Tingyang Xu, Fugee Tsung, and Jia Li. Human mo- bility modeling during the covid-19 pandemic via deep graph diffusion infomax. In Proceedings of the AAAI Conference on Artificial Intelligence, pages 14347-14355, 2023.
- [Nam et al., 2022] Danny Nam, Oanh Nguyen, and Allan Sly. Critical value asymptotics for the contact process on ran- dom graphs. Transactions of the American Mathematical Society, 375(6):3899-3967, 2022.
- [Pastor-Satorras et al., 2015] Romualdo Pastor-Satorras, Claudio Castellano, Piet Van Mieghem, and Alessandro Vespignani. Epidemic processes in complex networks. Reviews of Modern Physics, 87(3):925-979, 2015.
- [Prakash et al., 2012] B. Aditya Prakash, Deepayan Chakrabarti, Nicholas C Valler, Michalis Faloutsos, and Christos Faloutsos. Threshold conditions for arbitrary cascade models on arbitrary networks. Knowledge and information systems, 33:549-575, 2012.
- [Razaque et al., 2022] Abdul Razaque, Syed Rizvi, Meer Jaro Khan, Muder Almiani, and Amer Al Ra- hayfeh. State-of-art review of information diffusion models and their impact on social network vulnerabilities. Journal of King Saud University -Computer and Information Sciences, 34(1):1275-1294, 2022.
- [Sanderson, 2021] Katharine Sanderson. Covid vaccines pro- tect against delta, but their effectiveness wanes. Nature, 2021.
- [Sharma et al., 2021] Karishma Sharma, Xinran He, Sungy- ong Seo, and Yan Liu. Network inference from a mixture of diffusion models for fake news mitigation. In Proceedings of the International AAAI Conference on Web and Social Media, pages 668-679, 2021.
- [Sun et al., 2022] Ling Sun, Yuan Rao, Xiangbo Zhang, Yuqian Lan, and Shuanghe Yu. Ms-hgat: Memory- enhanced sequential hypergraph attention network for in- formation diffusion prediction. In Proceedings of the AAAI Conference on Artificial Intelligence, pages 4156-4164, 2022.
- [Sun et al., 2023] Yangke Sun, Bogdan Cautis, and Silviu Ma- niu. Social influence-maximizing group recommendation. In Proceedings of the International AAAI Conference on Web and Social Media, pages 820-831, 2023.
- [Tricomi and Erdélyi, 1951] Francesco Giacomo Tricomi and Arthur Erdélyi. The asymptotic expansion of a ra- tio of gamma functions. Pacific Journal of Mathematics, 1(1):133-142, 1951.
- [Wang et al., 2017] Yi Wang, Jinde Cao, Ahmed Alsaedi, and Tasawar Hayat. The spreading dynamics of sexually trans- mitted diseases with birth and death on heterogeneous net- works. Journal of Statistical Mechanics: Theory and Ex- periment, 2017(2):1-26, 2017.
- [Watve et al., 2024] Milind Watve, Himanshu Bhisikar, Ro- hini Kharate, and Srashti Bajpai. Epidemiology: Gray immunity model gives qualitatively different predictions. Journal of Biosciences, 49(1):10, 2024.
- [Wheatley et al., 2021] Adam K Wheatley, Jennifer A Juno, Jing J Wang, Kevin J Selva, Arnold Reynaldi, Hyon-Xhi Tan, Wen Shi Lee, Kathleen M Wragg, Hannah G Kelly, Robyn Esterbauer, et al. Evolution of immune responses to sars-cov-2 in mild-moderate covid-19. Nature communica- tions, 12(1):1162, 2021.
- [Zhang et al., 2016] Zi-Ke Zhang, Chuang Liu, Xiu-Xiu Zhan, Xin Lu, Chu-Xu Zhang, and Yi-Cheng Zhang. Dy- namics of information diffusion and its applications on complex networks. Physics Reports, 651:1-34, 2016.
References were extracted automatically from the PDF and may contain errors.
Full text extracted automatically from the PDF; figures, tables and equations may differ. The PDF is the version of record.
1 Introduction
Diffusion processes on graphs are prevalent in various domains of AI research, modeling a broad range of applications, such as information diffusion [Sun et al., 2023; Jiang et al., 2023; Liu et al., 2023; Sun et al., 2022; Razaque et al., 2022; Sharma et al., 2021], rumor spreading [Kempe et al., 2003], infections [Pastor-Satorras et al., 2015; Leskovec et al., 2007], and computer viruses [Berger et al., 2005; Borgs et al., 2010]. These processes usually share the same core mechanics, which are naturally expressed as extensions or variations of the wellknown SI process from epidemiology (see [Pastor-Satorras et al., 2015] for an extensive survey). The SI process is defined as a Markov chain on an underlying graph with vertices that are either infected or susceptible to an infection, and the infection spreads randomly over edges with an infection rate λ.
A very important variant of the SI process studied extensively both empirically and theoretically, e.g., [Ferreira et al.,
2012; Ferreira et al., 2016; Nam et al., 2022; Borgs et al., 2010; Ganesh et al., 2005] is the SIS process (also commonly called contact process), which allows infected vertices to become susceptible again. In turn, susceptible vertices can become infected again, and one fundamental question is how long an infection survives on a graph. This (random) time period is called the survival time of the process, and it is closely tied to the expansion properties of the graph [Ganesh et al., 2005]. Most importantly, the SIS process exhibits a super-polynomial expected survival time (also called endemic) already on star graphs with n leaves once the infection rate λ is at least in the order of only n-1/2+ε , with ε > 0 being an arbitrary constant. If the infection manages to infect at least a logarithmic number of leaves, it is likely to quickly infect order of λn leaves. This number of infected leaves remains for a superpolynomial time with overwhelming probability, leading to the super-polynomial survival time. This result translates to any graph that contains a star as a subgraph, implying that the SIS process goes endemic on many natural networks, such as scale-free networks, as they contain large stars as subgraphs [Berger et al., 2005].
One potential way to counteract endemic behavior is to introduce immunity against the infection into the system. This is classically modeled with the SIRS process, which introduces a recovered state, in which vertices are immune to the infection. Different from the SIS process, infected vertices transition now randomly into the recovered state, from which they transition into the susceptible state, based on a random rate ϱ called the deimmunization rate. While there is a plethora of empirical results on the SIRS process, e.g., [Wang et al., 2017; Kuperman and Abramson, 2001; Ferreira et al., 2016], most of the theoretical results use some simplifying assumptions such as mean-field approaches [Prakash et al., 2012; Bancal and Pastor-Satorras, 2010]. To the best of our knowledge, the recent paper by [Friedrich et al., 2024b] is the first fully rigorous paper on this process. In their work, the authors prove that the SIRS process has an at most polynomial expected survival time on stars for any infection rate λ if the deimmunization rate ϱ is constant. This result has recently been complemented by [Lam et al., 2024] with a matching lower bound. This strongly contrasts the SIS process and shows that immunity can be beneficial in fighting back the infection. [Friedrich et al., 2024b] furthermore show that the SIRS process becomes endemic on expander graphs, that is, dense graphs. This suggests that the benefit of immunity degrades with the density of the graph.
The polynomial expected survival time of the SIRS process on stars by [Friedrich et al., 2024b] is a consequence from the fact that vertices that recover from the infection are fully immune to re-infection until they spontaneously become susceptible. A main reason for this assumption in the SIRS process is that the resulting process is a time-homogeneous Markov chain, which simplifies the analysis. However, for a lot of real-life processes, this is a strong simplification. In infectious diseases, like SARS-CoV-2 for example, the number of antibodies drops continuously, which suggests that the resistance drops over time instead of just vanishing at some point [Sanderson, 2021; Wheatley et al., 2021; Gaebler et al., 2021; Israel et al., 2022]. Similar phenomena occur in several social phenomena [Zhang et al., 2016], for example, innovation adoption, where people adopt an innovative product, such as a phone, and do not require a new one until a certain time passes, after which the people get more receptive to buying a new product. In this example, the declining immunity models that a person can buy a new phone before the old one breaks if the new features are sufficiently better, which becomes more and more likely the more time passes.
In a newly proposed model, [Watve et al., 2024] aim to capture the complexity of continuously declining immunity. The authors show via simulations that this model explains real-world phenomena well, such as multiple small outbreaks of an infection. However, this model features a multitude of parameters and is too complex to rigorously analyze its effects.
A more promising approach for a rigorous analysis is a line of research that models the declining immunity while keeping the process time-homogeneous [ ´Aguas et al., 2006; Fouchet et al., 2008]. To this end, a new semi-recovered state is added, in which the immunity has partially worn off. In this state, vertices get infected at a smaller rate and go upon infection into a state of mild infection. Thus, this setting only provides a coarse, discretized version of declining immunity. The analysis is done via simulations and mean-field theory.
While there have been studies of variants of declining immunity incorporated into infection models, to our knowledge, none of them include rigorous mathematical analyses.
1.1 Main Contribution
We study the impact of gradually degrading immunity when compared to the temporarily full immunity of the SIRS process. To this end, we introduce and mathematically rigorously analyze the cSIRS process, which incorporates the gradual decline of immunity into the SIRS process such that the expected degree of immunity is the same as in the original SIRS process. We study the expected survival time of the cSIRS process on star and expander graphs, allowing us to compare our results to the SIS and the SIRS process. Moreover, our lower bounds on the expected survival time hold for any graph that contains a star or expander as subgraph (Observation 9 and Corollary 19, respectively). Table 1 summarizes our results on stars.
We observe that while the definition of the SIRS and the cSIRS process may seem similar, they behave fundamentally differently. Although both processes have an at most logarithmic expected survival time for sufficiently small infection rates
| infection rate | SIS | SIRS | cSIRS |
|---|---|---|---|
| λ ∈ O(n-1/2 ) λ ∈ Θ(n-1/2+ε ) and λ ≤ 1 λ > 1 | O(log(n)) Ω(enε) Ω(en1/2) | O(log(n)) ̂Θ(n2εϱ ) Thm. 7 ̂Θ(nϱ ) | O(log(n)) Ω(en2ε/3 ) Thm. 8 Ω(en1/3) |
λ ∈ O(n-1/2 ), the expected survival time of the cSIRS process jumps immediately to a super-polynomial expected survival time for only slightly larger values of λ ∈ Θ(n-1/2+ε ), with ε ∈ R>0 being an arbitrary constant, whereas the expected survival time of the SIRS process remains polynomial, regardless of λ. Thus, the cSIRS process behaves far more closely to the SIS than to the SIRS process. This shows that although the probability to become re-infected is the same in the SIRS and cSIRS process for the first re-infection attempt, the gradual decline of immunity in the cSIRS process has a dramatic impact on its survival time. This impact is more comparable to a process that does not feature any immunity, although our lower bounds for the cSIRS process are lower than for the SIS process, hinting at a still existing, albeit far less impactful benefit of immunity. The fundamental reason for this different behavior is that many infection attempts in the cSIRS process challenge the immunity repeatedly whereas this is not the case in the SIRS process. Overall, our results suggest that incorporating immunity only has a substantial benefit if it can be guaranteed fully for a sufficient amount of time. Since our results carry over to supergraphs and since stars are present in many graphs, our results cover a wide range of different graph classes, such as scale-free graphs [Berger et al., 2005; Friedrich et al., 2024b].
Our results for the SIRS process on stars are an improvement over those by [Friedrich et al., 2024b], who only proved an upper bound of ̂O(nϱ ) for all values of λ. Our bounds are tight up to sub-polynomial factors and showcase different regimes for larger values of λ. We note that [Lam et al., 2024] investigated the same question and independently found similar results that do not need the sub-polynomial factors.
In addition to our results on stars, we prove that the at least exponential survival time of the SIRS process with sufficiently large infection rate on expanders carries over to the cSIRS process (Corollary 19). Hence, once the graph is sufficiently dense, the SIRS and the cSIRS process start acting similarly.
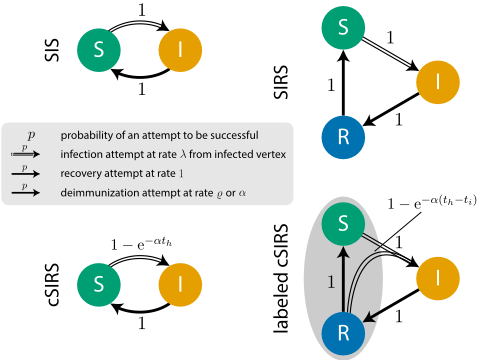
From a mathematical perspective, the analysis of the cSIRS process proves challenging, as it is not Markovian. We approach this problem by introducing an intermediate process, where we relabel some of the vertices in the cSIRS process such that the resulting process resembles a SIRS process with extra transitions that allow recovered vertices to become directly infected (Figure 1, bottom right). Due to its closer relation to the SIRS process, this intermediate process allows an easier analysis based on more traditional methods.
2 Preliminaries
We define the general notation for infection processes as well as the SIRS process, following the notation by [Friedrich et al., 2024a]. The cSIRS process is defined in Section 3.
Infection processes are random processes on labeled graphs where the dynamics are solely driven by Poisson processes and the labels of the vertices. Poisson processes are onedimensional Poisson point processes that output a random subset of the non-negative real numbers. We consider infection processes on finite, undirected graphs with n vertices. All bigO notation concerns asymptotics in this value of n. Especially, a constant is a value independent of n.
The SIRS process is defined over a graph G = (V,E) and two values λ, ϱ ∈ R>0, which are the infection rate and deimmunization rate, respectively. To each edge e ∈ E, we assign a Poisson process Me of rate λ, and to each vertex v ∈ V , we assign two Poisson processes: Nv with rate 1 and Ov with rate ϱ. We call these processes clocks, and when a time point t ∈ R≥0 is part of a clock's output, we say that the clock triggers at t. We assume that all clocks evolve simultaneously and independently. Since all clocks are Poisson processes, there is almost surely no point at which two clocks trigger at once, and each clock outputs almost surely a countably infinite number of triggers such that for each point, there exists a trigger that is at least as large. Let {γi}i∈N≥0 with γ0 = 0 denote the (random) sequence of all these triggers.
A SIRS process is a random process (Ct)t∈R≥0 that partitions V for all time points t ∈ R≥0 into the set S′t of susceptible vertices, the set I ′ t of infected vertices, and the set R′t of recovered vertices, that is, Ct = (S′t , I ′ t , R′t ). The value of C0 is given, and all other values are defined inductively based on {γi}i∈N≥0 such that the process is for all i ∈ N≥0 constant on [γi, γi+1). That is, states only change when a clock triggers, especially, for all t ∈ [0, γ1), it holds that S′t = S′0 , I ′ t = I ′0 , and R′t = R′0 . Depending on which clock triggers and the state of the involved vertices, we have the following transitions for all i ∈ N≥0 and any s ∈ [γi, γi+1):
- Susceptible to infected. Let e = {u, v} ∈ E with γi+1 ∈ Me and u ∈ I ′s as well as v ∈ S′s . Then for all t ∈ [γi+1, γi+2) holds that u, v ∈ I ′ t . We say that u infects v (at time γi+1).
- Infected to recovered. Let v ∈ V with γi+1 ∈ Nv and v ∈ I ′s . Then for all t ∈ [γi+1, γi+2) holds that v ∈ R′t . We say that v recovers (at time γi+1).
- Recovered to susceptible. Let v ∈ V with γi+1 ∈ Ov and v ∈ R′s . Then for all t ∈ [γi+1, γi+2) holds that v ∈ S′t . We say that v becomes susceptible (at time γi+1).
In addition, we may call vertices that are not infected healthy, and we may call the transition of an infected vertex to a noninfected state 1 healing.
1 In the SIRS process, this is the transition to the recovered state. In the SIS process, this is the transition to the susceptible state.
During each of the transitions above, all vertices not mentioned remain in their respective set. Moreover, note that not all triggers lead necessarily to a state change. For example, if the clock of an edge triggers whose two incident vertices are already infected, nothing changes.
As states remain unchanged for most of the time, we consider in our analyses only those time points where a state change occurs. Formally, we consider {γ0} ∪ {γi | i ∈ N>0 ∧ Cγi ̸= Cγi-1 }, which we index by the increasing sequence {τi}i∈N≥0 . For all i ∈ N, we call τi the i-th step of the SIRS process.
We are interested in the first point in time where no vertex is infected, as such a state leads quickly to the (only) stable state where all vertices are susceptible. We call T := inf{t ∈ R≥0 | I ′ t = ∅} the survival time of the SIRS process, and we say that the infection dies out or goes extinct at T .
Useful definitions and mathematical tools. For the graphs we consider, it is sufficient to only consider the number of vertices in each of the sets of the partition of V . To this end, we define for all t ∈ R≥0 the random variables St = |S′t |, It = |I ′ t |, and Rt = |R′t |. These random variables change based on events triggered by the clocks. We say an event happens at a rate of r ∈ R>0 if and only if the set of clocks causing this event by triggering has a sum of rates equal to r.
We use stochastic domination to bound the values of random processes with other random processes. We say that a random process (Xt)t∈R≥0 dominates another random process (Yt)t∈R≥0 if and only if there exists a coupling (X′ t , Y ′ t )t∈R≥0 such that for all t ∈ R≥0 holds X′ t ≥ Y ′ t .
One way we use domination is to connect our processes to well analyzed processes like the gambler's ruin process. For this process, we require the following known results.
Theorem 1 (Gambler's ruin [Feller, 1968, page 345]). Let (Pt)t∈N be the amount of money that a player has in a gambler's ruin game that has a probability of p ̸= 1/2 for them to win in each step. Let q = 1 - p. The game ends at time T when the player either reaches the lower bound ℓ or the upper bound u of money. Then
In the analyses, terms like ∏ni=1 i i+c show up. We bound their asymptotic behavior with the following theorem, which follows from result (1) of [Tricomi and Erd´elyi, 1951].
Theorem 2 (Ratio of Gamma Functions [Tricomi and Erd´elyi, 1951, page 133]). Let n ∈ N, and let α, β ∈ R>0 be constants. Then Γ(n+α) Γ(n+β) ∈ Θ(nα-β ).
This yields the following corollary.
Corollary 3. Let n,m ∈ N, and let c ∈ R>0 be a constant. Then ∏ni=m i i+c ∈ Θ( mc nc ).
Proof. The result follows from Theorem 2 and the fact that ∏ni=m i i+c = (∏ni=1 i i+c )/(∏m-1 i=1 i i+c ) and ∏ni=1 i i+c = Γ(c+1)·Γ(n+1) Γ(n+c+1) .
3 The cSIRS Process
We introduce the cSIRS (continuous SIRS) process, which aims to model the continuous decay of immunity. It behaves mostly like the SIRS process, but instead of a recovered vertex being fully immune and losing this immunity after an exponentially distributed time, the immunity decreases exponentially in a deterministic way. More precisely, the process behaves like an SIS process where every vertex v additionally has a resistance rv ∈ [0, 1], which is initialized with 0. Whenever a vertex changes its state from infected to susceptible, its resistance is set to 1. The resistance then exponentially declines with some resistance decay rate α ∈ R>0. That is, after a time th ∈ R≥0 after healing, the resistance is e-αth . When a vertex v would get infected by an infection clock on an edge in the SIS process, it now gets infected with probability 1-rv and otherwise remains susceptible. A depiction of these transitions is shown in Figure 1, bottom left.
We note that the SIRS process is expressible in a similar manner by dropping the resistance from 1 to 0 after an exponentially distributed random time instantly instead of letting it decline gradually. By choosing the same α in the cSIRS process as ϱ in the SIRS process, the expected resistance in the SIRS process matches the actual resistance in the cSIRS process at all times. Note that the cSIRS process is not Markovian anymore, which removes some useful properties that are normally used to analyze processes. Below, we explain how we still manage to extend existing results to the new process.
3.1 Useful Properties
As a first observation, we note that the number of infected vertices in the cSIRS process is dominated by the number of infected vertices in the SIS process with the same parameters. This means that all upper bounds on survival times in the SIS process carry over to the cSIRS process.
Theorem 4. Let G be a graph and let λ ∈ R>0. Let C be a cSIRS process on G with infection rate λ and a resistance decay rate α ∈ R>0, and let C ′ be a SIS process on G with infection rate λ that starts with the same infected vertices as C. Then there exists a coupling of C and C ′ such that the set of infected vertices of C is for all points in time a subset of the set of infected vertices of C ′ .
To obtain lower bounds on the survival time, we modify the cSIRS process to be closer to the SIRS process. This makes it easier to apply previous results to this new process and to talk about the SIRS and the new process using the same notation. To this end, we define the labeled cSIRS process. It is almost equivalent to the cSIRS process with the only difference that we extend the SIRS process instead of the SIS process. As it is just a SIRS process with an extra rate to infect recovered vertices, results from the SIRS process are much easier to adapt to this definition. The success probability for infection attempts is chosen in a way such that relabeling all recovered vertices in the labeled cSIRS process to susceptible yields the cSIRS process. The definition is visualized in Figure 1.
Definition 5 (labeled cSIRS). A labeled cSIRS process on a graph G with infection rate λ ∈ R>0 and resistance decay rate α ∈ R>0 is defined like a SIRS process with ϱ = α, with the difference that recovered vertices have a possibility to become infected. For all t ∈ R≥0 and each vertex v that is recovered at time t, let th be the time that passed from the last time that v recovered, that is, for t∗ := sup{s ∈ R≥0 | s ≤ t∧v recovers at s}, let th = t-t∗ , where we define sup ∅ = 0. Moreover, let ti be the time that passed since the last infection attempt involving v, or let ti = th if no such attempt occurred since t∗ . That is, let ti = t - max {t∗ , sup{s ∈ R≥0 | s < t ∧ ∃{u, v} ∈ E : (s ∈ M{u,v} ∧ u is infected at s)}}. Then each infection attempt at v is successful with probability 1 - e-α(th-ti) .
We note that we believe that adding an extra rate to infect recovered vertices directly should increase the survival time of the infection. We show in Corollary 19 that this belief is correct for expander graphs. However, to the best of our knowledge, there is no general result for the SIRS process that proves this belief. There are some scenarios where infecting a recovered vertex leads to it being recovered instead of susceptible later which could potentially block a relevant infection later. Thus, we argue differently in the following by showing that the cSIRS process is equivalent to the labeled cSIRS in which all recovered vertices are relabeled to be susceptible.
Observation 6. A cSIRS process and a labeled cSIRS process with the same parameters (including the same initialization) can be coupled in a way such that at each time they have exactly the same set of infected vertices. Especially, they have the same distribution of survival times.
4 cSIRS and SIRS on Stars
It is known that the SIRS process never survives superpolynomially long on stars when the deimmunization rate is constant [Friedrich et al., 2024a]. This is in big contrast to the SIS process, in which there is a relatively tight threshold at which the survival time goes from logarithmic to superpolynomial (see also Table 1). We aim to see how the cSIRS process compares to these results. To this end, we analyze the expected survival time of both the cSIRS process (Theorem 8) and the SIRS process (Theorem 7) at this threshold-the latter, since the only existing result so far [Friedrich et al., 2024a] is only an upper bound. We note that the lower bounds of our two main theorems above hold for any graph that contains a star as a subgraph, as long as this subgraph satisfies the starting conditions mentioned in the theorems (Observation 9). As various graph classes contain large stars, such as scale-free graphs, this typically translates into bounds based on the overall graph size, not just the star size [Berger et al., 2005].
For the SIRS process, we show in Theorems 15 and 16 almost tight polynomial upper and lower bounds for the survival time above the threshold, showing that the upper bound by [Friedrich et al., 2024a] is almost tight. Our two theorems directly imply the following theorem.
Theorem 7. Let G be a star with n leaves. Let C be a SIRS process on G with infection rate λ ≤ 1 with λ ∈ Ω(n-1/2 ) and with constant deimmunization rate ϱ that starts with infected center and no recovered leaves. Let T be the survival time of C. Then E[T ] ∈ ̂Θ((λ2n)ϱ ).
For the cSIRS process, we show a behavior very similar to the SIS process. That is, from the same value of the infection rate onward as in the SIS process, the cSIRS process exhibits a super-polynomial expected survival time.
Theorem 8. Let G be a star with n leaves. Let ε ∈ (0, 1/2] be a constant and let C be a labeled cSIRS process or cSIRS process on G with infection rate λ ≤ 1 with λ ∈ Ω(n-1/2+ε ) and with constant resistance decay rate α that starts with infected center and no recovered leaves. Let T be the survival time of C. Then E[T ] ∈ Ω(en2ε/3).
Theorems 7 and 8 show that the immunity in each process has drastically different effects, although the expected degree of immunity is the same in either process. In the SIRS process, the full immunity guarantees that the expected survival time does not become super-polynomial. However, in the cSIRS process, the expected survival time is very similar to that of the SIS process (see also Table 1), the latter of which does not exhibit any immunity at all. Hence, immunity does not seem to be very useful if it cannot be guaranteed at full levels for a certain amount of time.
Our mathematical analysis for the SIRS and the cSIRS process is very similar, as the processes are defined rather similarly. Thus, we first prove useful statements that hold for both processes. We note that instead of analyzing the cSIRS process directly, we analyze the labeled cSIRS process in order to use its shared notation with the SIRS process.
Our general proof strategy is to first show that it is very unlikely that there are ever too many recovered leaves. In turn, while there are not many infected vertices, there are almost always enough susceptible vertices to infect. Since infections cannot spread once the center of the star is not infected, we split the processes into center-healthy phases and center-infected phases. We show that center-infected phases have a constant probability to end with at least λdn infected vertices for some constant d ∈ R>0. We then show that the process needs a lot of center-healthy phases in order to heal these λdn leaves. As each center-infected phase in between has a high enough probability to get back up to these many infected leaves, the process survives relatively long until then. However, the actual details and results differ a lot between the two processes in this last step.
Generalization. Below, we provide the formal statement that our lower bounds for the survival time also hold when the star is only a subgraph of the underlying graph, and higher infection rates lead to stronger lower bounds. This normally does not have to be the case in the SIRS or cSIRS process as additional infections can lead to more recovered vertices that block the infection. However, our analysis is not affected by such events, as our proof method operates on average cases of a potential function that has sufficient slack such that such events do not change our result.
Observation 9. Let Gbe a star with n leaves. Let C be a SIRS process or a labeled cSIRS process on G with infection rate λ. All our lower bounds for the expected survival time of C also hold when the process runs on a supergraph of G (with same parameters and starting configuration on vertices of G, noting that n still refers to the number of leaves in G, not the number of vertices not in the supergraph). The lower bounds also hold for processes on the same graph with infection rate λ′ ∈ R>λ. In particular, our lower bounds for λ = 1 also hold for all infection rates λ′ > 1.
4.1 Center-Infected Phase
We show that with constant probability, a center-infected phase on the star ends with at least dλn infected vertices, for some constant d ∈ R>0. This holds for both the SIRS and the labeled cSIRS process. To get this bound, we first show that both processes likely never reach a state with too many recovered vertices.
Lemma 10. Let G be a star with n leaves. Let C be a SIRS process or a labeled cSIRS process on G with infection rate λ tance decay rate α respectively, but we refer to it as ϱ until
2+ϱ n is at most (2 ϱ 2(2+ϱ) n - 1)-1 .
and with constant deimmunization rate ϱ (or constant resisthe end of the statement). Let t ∈ N, and let Rτt ≤ 2 2+ϱ n + 1. Then the probability p that Rτt reaches 2+ϱ/2 2+ϱ n before reaching 2
Although Lemma 10 only shows an exponentially low probability of reaching too many recovered vertices during a single phase, in the following, we often assume that the process never does so before it dies out. This assumption makes sense, as we only make it for statements for which we show a sub-exponential expected survival time. Thus, due to the exponentially small probability in Lemma 10, the probability of ever having too many recovered vertices before the process dies out is overall still sub-constant. Hence, conditioning on this never occurring does not change our arguments in the following asymptotically. Moreover, once the process dies out under the previous event, it can never reach too many recovered vertices anymore.
Let c = ϱ 4(2+ϱ) . Lemma 10 shows that the process is exponentially unlikely to reach a state without at least 2cn vertices that are not recovered. Hence, as long as there are at most cn infected vertices, there are very likely at least cn susceptible vertices. We use this fact to first show that, with constant probability, we reach a state with sufficiently many infected vertices after a center-infected phase.
Lemma 11. Let G be a star with n leaves. Let C be a SIRS process or a labeled cSIRS process on G with infection rate λ ≤ 1 with λ ∈ ω(n-1 ) and with constant deimmunization rate ϱ (or constant resistance decay rate α respectively, but we refer to it as ϱ until the end of the statement). Let ε ∈ R>0 be a constant and let t ∈ N such that the center is infected at time τt. Furthermore, let c = ϱ 4(2+ϱ) . Assume that there are always at least 2cn vertices that are not recovered during the considered time interval. Let d ∈ R>0 be a constant with d ≤ c/7 and e-2d/c ≥ 1 - ε/2. Then starting from τt, the probability of the event E that we reach a state with at least λdn infected vertices before the center heals is at least 1 - ε for sufficiently large n.
For the rest of the analysis of the survival time, the two processes differ. Hence, we analyze them separately.
4.2 The SIRS Process
For the SIRS process, the idea of the proof is as follows. We consider the number of infected leaves while the center is recovered. When the center becomes susceptible and loses its immunity, we condense the following center-susceptible and center-infected phase into one step. We analyze the number of infected leaves of the resulting process between some lower bound ℓ and some upper bound u. We upper-bound the probability of dropping down to ℓ from u - 1 before reaching u again. This gives us a lower bound on how many of these phases happen in expectation. As each of these phases includes the center losing immunity, they have an expected constant length.
The process we consider is quite simple, as it just decreases the number of infected vertices by 1 at rate Iτt and starts a center-susceptible and center-infected phase at rate ϱ. For the latter, we showed in Lemma 11 that it reaches a state with at least u infected vertices with constant probability and show here that it is very unlikely to ever reduce the number of infected vertices by more than ℓ. Essentially, we use ℓ vertices as a buffer that is used for phases where the center is not recovered. Thus, we consider vertices that heal in these phases to not decrease Iτt . However, as long as these phases do not heal ℓ vertices and the process does not fall below ℓ, we know that the original process cannot have died out yet.
Lemma 11 shows that each center-infected phase has a constant probability of infecting more than λdn vertices, for some constant d ∈ R>0. We now show that the center-infected phases that do not achieve this together with their preceding center-susceptible phases have a very low probability of healing too many vertices.
Lemma 12. Let G be a star with n leaves. Let C be a SIRS process on G with infection rate λ ≤ 1 and with constant deimmunization rate ϱ. Let ε ∈ R>0 be a constant and let t ∈ N such that the center is susceptible at time τt. For c = ϱ 4(2+ϱ) , assume that there are always at least 2cn vertices that are not recovered during the considered time interval. Let d ∈ R>0 be a constant with d ≤ c/7. Then starting from τt, the probability of the event E that we reach a state with at most Iτt - 2λ-1nε infected vertices before either the center recovers or we reach at least λdn infected vertices is at most 2e-nε /2 for sufficiently large n.
Lemma 11 shows that each center-infected phase has a constant probability of infecting more than λdn vertices, and Lemma 12 shows that each center-infected phase and centersusceptible phase does not heal too many vertices. We now combine these two results to show that all center-infected phases and center-susceptible phases together do not heal too many vertices before they infect more than λdn vertices.
Corollary 13. Let G be a star with n leaves. Let C be a SIRS process on G with infection rate λ ≤ 1 with λ ∈ ω(n-1 ) and with constant deimmunization rate ϱ. Let ε0, ε1 ∈ R>0 be constants with ε0 ≤ e-1 and let t ∈ N such that the center is susceptible at time τt. For c = ϱ 4(2+ϱ) , assume that there are always at least 2cn vertices that are not recovered during the considered time interval. Let d ∈ R>0 be a constant with d ≤ c/7 and e-2d/c ≥ 1 - ε0/2. We define the random process (Xt′)t′∈N≥t to be 0 at step t, to increase by 1 in every step in which a leaf is healed in a center-susceptible or center-infected phase and to decrease by one in every step it is positive and a leaf gets infected. Then starting from step t, the probability of the event E that we reach a time step t′ with Xt′ ≥ 2λ-1nε1 before we reach a time step with at least λdn infected vertices is at most e-nε1/4 .
Corollary 13 shows that center-susceptible phases and center-infected phases do not heal that many leaves in total. Thus, in order to bound the probability of the infection dying out, we mainly consider the center-recovered phases. We capture this in the following lemma.
Lemma 14. Let G be a star with n leaves. Let C be a SIRS process on G with infection rate λ ≤ 1 with λ ∈ ω(n-1 ) and with constant deimmunization rate ϱ. Let ε0, ε1 ∈ R>0 be constants with ε0 ≤ e-1 . For c = ϱ 4(2+ϱ) , assume that there are always at least 2cn vertices that are not recovered during the considered time interval. Let d ∈ R>0 be a constant with d ≤ c/7 and e-2d/c ≥ 1 - ε0/2 and let t ∈ N such that there are λdn - 1 infected vertices at time τt. Then starting from τt, the probability of the event E that the infection dies out before it reaches at least λdn infected vertices is at most Θ(λ-2(1-ε0)ϱn-(1-ε0)(1-ε1)ϱ ).
We now combine these results into a lower bound for the expected survival time.
Theorem 15. Let G be a star with n leaves. Let C be a SIRS process on G with infection rate λ ≤ 1 with λ ∈ ω(n-1 ) and with constant deimmunization rate ϱ that starts with an infected center and no recovered leaves. Let ε ∈ R>0 be a constant, and let T be the survival time of C. Then E[T] ∈ Ω((λ2n)(1-ε)ϱ ).
We now show that this lower bound is actually tight when disregarding sub-polynomial factors.
Theorem 16. Let G be a star with n leaves. Let C be a SIRS process on G with infection rate λ ≤ 1 with λ ∈ Ω(n-1/2 ) and with constant deimmunization rate ϱ that starts with infected center and no recovered leaves. Let T be the survival time of C. Then E[T ] ∈ O((λ2n)ϱ + log n).
4.3 The cSIRS Process
The idea of the proof for the cSIRS process is to show that the process stays at a number of infected leaves for a long time, in which it likely needs a super-polynomial number of center-healthy phases for the infection to die out. In order to show this, we bound the number of leaves that heal in a center-healthy phase. To this end, we split the center-healthy phase into two intervals, in which the first one is just there to pass some time such that the resistance in the second interval is small enough such that the center very likely gets infected during this interval. Recall that we consider the labeled cSIRS process instead of the cSIRS process, as this lets us use some results from the SIRS process.
We start with upper-bounding the number of leaves that heal in a time interval of length t.
Lemma 17. Let G be a star with n leaves. Let C be a labeled cSIRS process on G with infection rate λ ∈ ω(n-1 ) and with constant resistance decay rate α. Let d ∈ R>0 be a constant and let t′ ∈ R≥0 such that there are at most dλn infected leaves at time t′ . Furthermore, let t ∈ [0, 1]. Then the probability that more than 2tdλn of the infected leaves heal until time t′ + t is at most e- tdλn 6 .
Next, we lower-bound the probability of infecting the center in a time interval of length t when there are more than dλn/2 infected leaves.
Lemma 18. Let G be a star with n leaves. Let C be a labeled cSIRS process on G with infection rate λ ≤ 1 with λ ∈ ω(n-1 ) and with constant resistance decay rate ϱ. Let d ∈ R>0 be a constant and let t′ ∈ R≥0 and t ∈ [0, 1] such that the center healed at time t′ and there are at least dλn/2 infected leaves at all times in [t′ , t′ +t]. Then the probability p that the center does not get infected until time t′ + t is at most e-dλ2 nt2 /32 .
We combine Lemmas 17 and 18 to show in Theorem 8 a long expected survival time of the labeled cSIRS process and therefore also for the cSIRS process, due to Observation 6.
5 The cSIRS Process on Expanders
[Friedrich et al., 2024a] show that the SIRS process survives exponentially long on graphs with expanding subgraphs once the infection rate is above a certain threshold, which is identical to the threshold in the SIS process. With minor modifications, this proof translates to a proof of exponential survival time for the cSIRS process, giving us the following result.
Corollary 19. Let G be a graph, and let G′ be a subgraph of G that is an (n, (1 ± εd)d, δ)-expander (see [Friedrich et al., 2024a]). Let d → ∞ and δ, εd → 0 as n → ∞. Let C be the cSIRS process on G with infection rate λ and with constant resistance decay rate ϱ. Furthermore, let C start with at least one infected vertex in G′ . Last, let C ′ be the projection of C
onto G′ , and let T be the survival time of C ′ . If λ ≥ cd for a constant c ∈ R>1, then for sufficiently large n, it holds that E[T ] = 2Ω(n) .
6 Conclusion and FutureWork
We study the impact of gradually declining immunity on the SIRS process. To this end, we define the cSIRS process, whose expected degree of immunity at all points in time is the same as in the original SIRS process. We mathematically rigorously analyze the expected survival time of the cSIRS process on stars and expander graphs, as well as the expected survival time of the SIRS process on stars. This allows us to compare these two processes more precisely to each other and also to the well known SIS process, which features no immunity. We prove that the survival time of the cSIRS process becomes super-polynomial at the same thresholds as the SIS process on both of these graph classes. This stands in contrast to the SIRS process, for which we prove an almost tight polynomial expected survival time on stars for any choice of the infection rate of the process. Since our lower bounds carry over to graphs that contain stars as subgraphs, such as scale-free networks, they show on a huge variety of networks that gradually declining immunity is far more similar to no immunity at all than to temporary full immunity.
While we show that the cSIRS process exhibits a superpolynomial expected survival time for the same infection rates as the SIS process, our lower bounds for the cSIRS process are strictly smaller than the known lower bounds for the SIS process. This can hint at a potential advantage of gradually declining immunity, albeit just for the super-polynomial regime of the expected survival time. In order to make this point formal, it would be required to prove upper bounds on the expected survival time of the cSIRS process in this regime. Moreover, it would be interesting to investigate whether there are graph classes on which the potential impact of declining immunity is more noticeable than on stars. While we looked at the behavior of the process on stars and cliques, it is still open what happens on graphs that contain both.
Another interesting direction for future work is to consider other functions for the declining resistance than the current choice, which declines exponentially with a rate constant in the number of vertices. Studying such functions could provide important insights into when immunity starts to have a meaningful impact in decreasing the expected survival time.
Last, our bounds for the SIRS process assume a deimmunization rate ϱ that is independent of the network size. As this rate approaches zero, the SIRS process should approach the SIS process. Hence, the effect of full immunity also vanishes. However, it is not known yet for which exact values of ϱ this is the case.
Acknowledgments
Andreas G¨obel was funded by the project PAGES (project No. 467516565) of the German Research Foundation (DFG).
@inproceedings{ijcai2025p13,
  title     = {Resistance is Futile: Gradually Declining Immunity Retains the Exponential Duration of Immunity-Free Diffusion},
  author    = {Göbel, Andreas and Klodt, Nicolas and Krejca, Martin S. and Pappik, Marcus},
  booktitle = {Proceedings of the Thirty-Fourth International Joint Conference on
               Artificial Intelligence, {IJCAI-25}},
  publisher = {International Joint Conferences on Artificial Intelligence Organization},
  editor    = {James Kwok},
  pages     = {108--116},
  year      = {2025},
  month     = {8},
  note      = {Main Track},
  doi       = {10.24963/ijcai.2025/13},
  url       = {https://doi.org/10.24963/ijcai.2025/13},
}
TY - CPAPER TI - Resistance is Futile: Gradually Declining Immunity Retains the Exponential Duration of Immunity-Free Diffusion AU - Göbel, Andreas AU - Klodt, Nicolas AU - Krejca, Martin S. AU - Pappik, Marcus T2 - Proceedings of the Thirty-Fourth International Joint Conference on Artificial Intelligence, IJCAI-25 PB - International Joint Conferences on Artificial Intelligence Organization PY - 2025 SP - 108 EP - 116 DO - 10.24963/ijcai.2025/13 UR - https://doi.org/10.24963/ijcai.2025/13 ER -Copied
Machine-readable versions of this paper, for tools and AI agents:





