
Rethinking Graph Contrastive Learning Through Relative Similarity Preservation
Proceedings of the Thirty-Fourth International Joint Conference on Artificial Intelligence. Main Track. Pages 3217-3225.
https://doi.org/10.24963/ijcai.2025/358
Keywords
- Data Mining: DM: Applications
- Data Mining: DM: Other
- Data Mining: DM: Mining graphs
Abstract
Graph contrastive learning (GCL) has achieved remarkable success by following the computer vision paradigm of preserving absolute similarity between augmented views. However, this approach faces fundamental challenges in graphs due to their discrete, non-Euclidean nature -- view generation often breaks semantic validity and similarity verification becomes unreliable. Through analyzing 11 real-world graphs, we discover a universal pattern transcending the homophily-heterophily dichotomy: label consistency systematically diminishes as structural distance increases, manifesting as smooth decay in homophily graphs and oscillatory decay in heterophily graphs. We establish theoretical guarantees for this pattern through random walk theory, proving label distribution convergence and characterizing the mechanisms behind different decay behaviors. This discovery reveals that graphs naturally encode relative similarity patterns, where structurally closer nodes exhibit collectively stronger semantic relationships. Leveraging this insight, we propose RELGCL, a novel GCL framework with complementary pairwise and listwise implementations that preserve these inherent patterns through collective similarity objectives. Extensive experiments demonstrate that our method consistently outperforms 20 existing approaches across both homophily and heterophily graphs, validating the effectiveness of leveraging natural relative similarity over artificial absolute similarity.
- [Bramoullé et al., 2012] Yann Bramoullé, Sergio Currarini, Matthew O Jackson, Paolo Pin, and Brian W Rogers. Ho- mophily and long-run integration in social networks. Jour- nal of Economic Theory, 147(5):1754-1786, 2012.
- [Chen and He, 2021] Xinlei Chen and Kaiming He. Explor- ing simple siamese representation learning. In Proceed- ings of the IEEE/CVF conference on computer vision and pattern recognition, pages 15750-15758, 2021.
- [Chen et al., 2020] Ting Chen, Simon Kornblith, Moham- mad Norouzi, and Geoffrey Hinton. A simple framework for contrastive learning of visual representations. In In- ternational conference on machine learning, pages 1597- 1607. PMLR, 2020.
- [He et al., 2020] Kaiming He, Haoqi Fan, Yuxin Wu, Sain- ing Xie, and Ross Girshick. Momentum contrast for unsu- pervised visual representation learning. In Proceedings of the IEEE/CVF conference on computer vision and pattern recognition, pages 9729-9738, 2020.
- [Hoffmann et al., 2022] David T. Hoffmann, Nadine Behrmann, Juergen Gall, Thomas Brox, and Mehdi Noroozi. Ranking info noise contrastive estimation: Boosting contrastive learning via ranked positives. Pro- ceedings of the AAAI Conference on Artificial Intelligence, pages 897-905, 2022.
- [Hou et al., 2022] Zhenyu Hou, Xiao Liu, Yukuo Cen, Yux- iao Dong, Hongxia Yang, Chun-Wei Wang, and Jie Tang. Graphmae: Self-supervised masked graph autoencoders. ArXiv, abs/2205.10803, 2022.
- [Hu et al., 2020] Weihua Hu, Matthias Fey, Marinka Zitnik, Yuxiao Dong, Hongyu Ren, Bowen Liu, Michele Catasta, and Jure Leskovec. Open graph benchmark: Datasets for machine learning on graphs. Advances in neural informa- tion processing systems, 33:22118-22133, 2020.
- [Jin et al., 2021] Wei Jin, Xiaorui Liu, Xiangyu Zhao, Yao Ma, Neil Shah, and Jiliang Tang. Automated self-supervised learning for graphs. arXiv preprint arXiv:2106.05470, 2021.
- [Khosla et al., 2020] Prannay Khosla, Piotr Teterwak, Chen Wang, Aaron Sarna, Yonglong Tian, Phillip Isola, Aaron Maschinot, Ce Liu, and Dilip Krishnan. Supervised con- trastive learning. Advances in neural information process- ing systems, 33:18661-18673, 2020.
- [Kingma and Ba, 2014] Diederik P Kingma and Jimmy Ba. Adam: A method for stochastic optimization. arXiv preprint arXiv:1412.6980, 2014.
- [Kipf and Welling, 2016] Thomas Kipf and Max Welling. Variational graph auto-encoders. ArXiv, abs/1611.07308, 2016.
- [Lee et al., 2022] Namkyeong Lee, Junseok Lee, and Chany- oung Park. Augmentation-free self-supervised learning on graphs. Proceedings of the AAAI Conference on Artificial Intelligence, 36:7372-7380, Jun. 2022.
- [Levin and Peres, 2017] David A Levin and Yuval Peres. Markov chains and mixing times, volume 107. American Mathematical Soc., 2017.
- [Lovász, 1993] László Lovász. Random walks on graphs. Combinatorics, Paul erdos is eighty, 2(1-46):4, 1993.
- [McPherson et al., 2001] Miller McPherson, Lynn Smith- Lovin, and James M Cook. Birds of a feather: Homophily in social networks. Annual review of sociology, pages 415- 444, 2001.
- [Miech et al., 2020] Antoine Miech, Jean-Baptiste Alayrac, Lucas Smaira, Ivan Laptev, Josef Sivic, and Andrew Zis- serman. End-to-end learning of visual representations from uncurated instructional videos. In Proceedings of the IEEE/CVF Conference on Computer Vision and Pat- tern Recognition, pages 9879-9889, 2020.
- [Mo et al., 2022] Yujie Mo, Liang Peng, Jie Xu, Xiaoshuang Shi, and Xiaofeng Zhu. Simple unsupervised graph rep- resentation learning. Proceedings of the AAAI Conference on Artificial Intelligence, pages 7797-7805, 2022.
- [Oord et al., 2018] Aaron van den Oord, Yazhe Li, and Oriol Vinyals. Representation learning with contrastive predic- tive coding. arXiv preprint arXiv:1807.03748, 2018.
- [Pei et al., 2020] Hongbin Pei, Bingzhen Wei, Kevin Chen- Chuan Chang, Yu Lei, and Bo Yang. Geom-gcn: Geomet- ric graph convolutional networks. ArXiv, abs/2002.05287, 2020.
- [Peng et al., 2020] Zhen Peng, Wenbing Huang, Minnan Luo, Qinghua Zheng, Yu Rong, Tingyang Xu, and Jun- zhou Huang. Graph representation learning via graphi- cal mutual information maximization. Proceedings of The Web Conference 2020, 2020.
- [Thakoor et al., 2021] Shantanu Thakoor, Corentin Tallec, Mohammad Gheshlaghi Azar, Mehdi Azabou, Eva L Dyer, Remi Munos, Petar Veličković, and Michal Valko. Large- scale representation learning on graphs via bootstrapping. arXiv preprint arXiv:2102.06514, 2021.
- [Tschannen et al., 2019] Michael Tschannen, Josip Djo- longa, Paul K Rubenstein, Sylvain Gelly, and Mario Lu- cic. On mutual information maximization for representa- tion learning. arXiv preprint arXiv:1907.13625, 2019.
- [Velickovic et al., 2018] Petar Velickovic, Guillem Cucurull, Arantxa Casanova, Adriana Romero, Pietro Lio', and Yoshua Bengio. Graph attention networks. ArXiv, abs/1710.10903, 2018.
- [Velickovic et al., 2019] Petar Velickovic, William Fedus, William L. Hamilton, Pietro Lio', Yoshua Bengio, and R. Devon Hjelm. Deep graph infomax. ArXiv, abs/1809.10341, 2019.
- [Welling and Kipf, 2016] Max Welling and Thomas N Kipf. Semi-supervised classification with graph convolutional networks. In J. International Conference on Learning Rep- resentations (ICLR 2017), 2016.
- [Xiao et al., 2024] Teng Xiao, Huaisheng Zhu, Zhengyu Chen, and Suhang Wang. Simple and asymmetric graph contrastive learning without augmentations. Advances in Neural Information Processing Systems, 36, 2024.
- [Zhang et al., 2021] Hengrui Zhang, Qitian Wu, Junchi Yan, David Wipf, and Philip S Yu. From canonical correlation analysis to self-supervised graph neural networks. In Ad- vances in Neural Information Processing Systems, pages 76-89, 2021.
- [Zhu et al., 2020a] Jiong Zhu, Yujun Yan, Lingxiao Zhao, Mark Heimann, Leman Akoglu, and Danai Koutra. Be- yond homophily in graph neural networks: Current limita- tions and effective designs. Advances in Neural Informa- tion Processing Systems, 33:7793-7804, 2020.
- [Zhu et al., 2020b] Yanqiao Zhu, Yichen Xu, Feng Yu, Q. Liu, Shu Wu, and Liang Wang. Deep graph contrastive representation learning. ArXiv, abs/2006.04131, 2020.
- [Zhu et al., 2021] Yanqiao Zhu, Yichen Xu, Feng Yu, Q. Liu, Shu Wu, and Liang Wang. Graph contrastive learning with adaptive augmentation. Proceedings of the Web Confer- ence 2021, 2021.
References were extracted automatically from the PDF and may contain errors.
Full text extracted automatically from the PDF; figures, tables and equations may differ. The PDF is the version of record.
1 Introduction
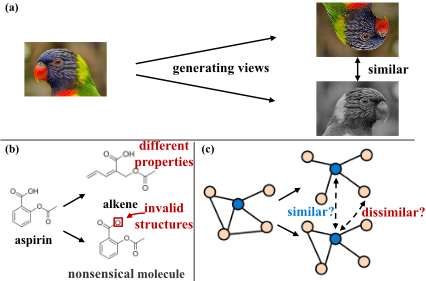
Graph contrastive learning (GCL) has emerged as a powerful approach for graph self-supervised learning, demonstrating strong performance across node classification, clustering, and similarity search tasks [Velickovic et al., 2019; Zhu et al., 2020b; Thakoor et al., 2021]. Following the success in computer vision [He et al., 2020; Chen et al., 2020], these methods typically generate multiple views of the same graph through augmentation techniques, aiming to maximize the agreement between different views of the same instance. This approach implicitly assumes that different views should maintain absolute similarity in the embedding spacean assumption that has proved powerful for visual representations [Chen and He, 2021] (as shown in Figure 1 (a)). However, graphs fundamentally differ from images in their discrete, non-Euclidean nature [Thakoor et al., 2021]. This fundamental difference creates two critical challenges. First, view generation often breaks semantic validity (as shown in Figure 1 (b))-while rotating an image preserves its meaning, removing an edge from a molecular graph could yield an entirely different chemical compound with distinct properties [Lee et al., 2022]. Second, and more fundamentally, similarity verification becomes unreliable (as shown in Figure 1 (c))-while humans can easily verify if two image views represent the same object, judging similarity between graph views often exceeds human intuition [Hou et al., 2022], especially for abstract graphs representing complex relationships.
∗Corresponding author.
These challenges suggest that enforcing absolute similarity through artificial views fundamentally misaligns with the nature of graph data. Rather than imposing external similarity constraints, a more promising direction would be to understand and leverage the inherent structural patterns that naturally exist in graphs [Bramoullé et al., 2012; Zhu et al.,
2020a]. This leads us to a more fundamental question: how is similarity inherently encoded in graph structures themselves? While traditional similarity analysis in graphs focuses on immediate neighborhood relationships-characterizing graphs as either homophily graphs [McPherson et al., 2001] where similar nodes connect, or heterophily graphs [Pei et al., 2020] where dissimilar nodes connect-such local characterization fails to capture broader similarity patterns that could provide richer signals for representation learning.
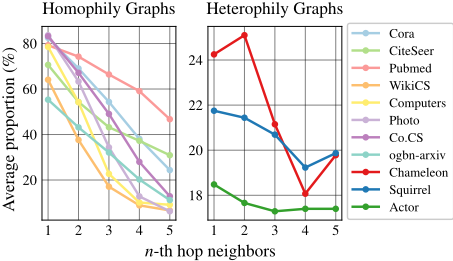
To obtain this broader perspective, we examine how node labels distribute across multi-hop neighborhoods in 11 realworld graph datasets: 8 homophily graphs and 3 heterophily graphs (as shown in Figure 2). Through quantifying semantic relationships via "label consistency"-the average proportion of same-labeled nodes at each structural distancewe discover an unexpected universal pattern: despite their distinct local connectivity patterns, both types of graphs show systematic diminishing of label consistency as structural distance increases. While this decay manifests differently (smooth in homophily graphs versus ✿✿✿✿✿✿✿✿ oscillatory in heterophily graphs), it reveals a fundamental principle: nodes that are structurally closer tend to share stronger semantic relationships collectively. We rigorously validate this empirical observation through random walk theory [Lovász, 1993; Levin and Peres, 2017], establishing the first theoretical guarantees on universal label distribution convergence and revealing the underlying mechanisms of distinct decay patterns in homophily versus heterophily graphs. Our discovery fundamentally shifts how we define similarity in GCLmoving away from artificially imposed absolute similarity ("whether two instances are similar") towards relative similarity ("which instance is more similar to the anchor") inherent in structural proximity. Based on these theoretical insights, we develop RELGCL (RELative Graph Contrastive Learning), a novel GCL framework that leverages natural relative similarity patterns encoded in structural proximity. Through carefully designed collective similarity objectives, we propose two complementary implementations of RELGCL (RELGCLPAIR and RELGCLLIST) that preserve these inherent patterns from different perspectives. Extensive experiments demonstrate state-of-the-art performance across 8 homophily and 3 heterophily graphs, consistently outperforming 20 existing approaches while showing strong generalization to large-scale graphs and diverse tasks.
2 Universal Decay Patterns in Graphs
Having identified the limitations of imposing absolute similarity through artificial views, we now investigate how similarity is naturally encoded in graph structures. While traditional similarity analysis of graph focuses on local neighborhood patterns, our investigation extends to a broader neighborhood range, revealing a universal property that goes beyond local homophily-heterophily differences.
In this section, we first present empirical evidence for this universal pattern, followed by theoretical analysis that explains its underlying mechanisms. Before the subsequent analysis, let's first define the basic notation. Let G = {V, E,X,A} denote a graph with N nodes, where V = {vi}Ni=1 is the node set, E ⊆ V × V is the edge set, X ∈ RN×D is the node feature matrix, and A ∈ RN×N is the adjacency matrix. For each node vi, let N(vi)[n] denote its n-th hop neighbors, and yi denote the label of node vi. When considering a k-hop neighborhood range, we denote the set of neighbors at different hops as N(vi)[k] = {N(vi)[1] ,N(vi)[2] , . . . ,N(vi)[k] ,N(vi)[k+1] }, where N(vi)[k+1] contains all nodes beyond k hops.
2.1 Empirical Evidence of Universal Decay
We examine a collection of 11 real-world datasets: 8 homophily graphs and 3 heterophily graphs. To quantify semantic relationships at different structural scales, we introduce the empirical label consistency measure (LCemp). For a given structural distance k, LCemp(k) captures the average proportion of k-hop neighbors sharing the same label as the anchor node:
Our analysis of LCemp(k) across different structural distances reveals how label consistency evolves in different types of graphs (as shown in Figure 2):
- Homophily Graphs: Display smooth, monotonic decay in label consistency, reflecting their local preference for similar neighbors. Starting from high initial values (LCemp(1) typically > 0.5), the consistency gradually diminishes as structural distance increases.
- Heterophily Graphs: Exhibit ✿✿✿✿✿✿✿✿ oscillatory ✿✿✿✿✿✿ decay ✿✿✿✿✿✿✿ patterns, where label consistency may occasionally increase at certain hops due to the graph's tendency to connect dissimilar neighbors, though the overall trend remains downward. Starting from low initial values (LC emp(1) typically < 0.5), the pattern shows possible local increases but maintains a decreasing trend with structural distance.
Despite these distinct decay patterns, a universal property emerges: label consistency exhibits an overall diminishing trend with increasing structural distance across both graph types. This decay pattern is statistical in nature. At each hop, we can still find nodes sharing the same label as the anchor node, but the proportion of same-labeled nodes among all neighbors at each hop, when averaged across all nodes in the graph, exhibits a clear decreasing trend as structural distance increases. Such universal decay suggests a fundamental connection between structural proximity and semantic similarity in graphs, independent of whether the graph exhibits homophily or heterophily.
2.2 RandomWalk Theory of Label Consistency
While these empirical observations reveal an intriguing universal pattern transcending local connectivity differences, they raise fundamental questions: Why does label consistency universally decay with distance? What mechanisms drive the distinct decay patterns in homophily versus heterophily graphs? To answer these questions, we turn to random walk theory [Lovász, 1993; Levin and Peres, 2017].
Following the notations defined in Section 2, consider a random walk starting from a node with label i in a graph with c distinct labels. We analyze this process at two levels: the microscopic node-level transitions, where a walker moves between individual nodes with probability Puv = Auv/deg(u), and the macroscopic label-level dynamics, where we track transitions between different label classes. At the label level, let pk(j|i) denote the probability of reaching a node with label j after k steps from any node with label i. The theoretical label consistency LCprob(k) = pk(i|i) then measures the probability of returning to a node with the same label after k steps. Let l(v) denote the label of node v. The evolution of these probabilities is governed by a label transition matrix T . We establish the following fundamental results about label distribution dynamics:
Theorem 1 (Label Distribution Convergence). For a connected graph where each node has a self-loop, there exists a unique probability distribution π (where πj = ∑u:l(u)=j deg(u) ∑v deg(v) ) such that:
moreover, the convergence is exponential:
where C > 0 and λ < 1 are constants from the graph.
Proof Sketch. The key is showing T satisfies Markov chain properties. Perron-Frobenius theorem yields the unique stationary distribution π and exponential convergence.
This stationary distribution πj represents the proportion of edges connected to nodes with label j, naturally characterizing the structural importance of different labels. This convergence result leads us to analyze how Label Consistency evolves during this process:
Corollary 1 (Label Consistency Decay). The Label Consistency LC prob(k) = pk(i|i) exhibits a decay pattern where:
Proof Sketch. Graph connectivity ensures πi < 1 since some edges must connect to nodes with other labels. Exponential decay follows from spectral decomposition of T k .
To further explain the distinct decay patterns in homophily versus heterophily graphs, we analyze the spectral properties of their transition matrices in a simplified two-label setting:
Proposition 1 (Decay Pattern Characterization). In a twolabel simplified model:
These eigenvalue patterns explain the distinct decay behaviors: monotonic decay when λ2 > 0 (homophily) versus oscillatory decay when λ2 < 0 (heterophily).
In summary, empirical observations and theoretical analysis show that label consistency decays with structural distance-both in smooth and oscillatory patterns. This decay law will fundamentally change how we view similarity in GCL, leading to a new framework that naturally captures structural relationships, detailed next.
3 Methodology
Building upon our established observations and theoretical foundations of the universal label consistency diminishing property, we propose RELGCL (RELative Graph Contrastive Learning), a principled framework to leverage this inherent characteristic for GCL. The key insight is to preserve the naturally encoded relative similarity patterns that persist across both homophily and heterophily graphs. In this section, our goal is to learn a graph encoder (we take graph convolutional network [Welling and Kipf, 2016]) f : (X,A) → H ∈ RN×d that maps nodes to low-dimensional representations (d ≪ D) while preserving the inherent relative similarity patterns in graphs. Let hi ∈ Rd denote the learned representation of node vi in the embedding space (i.e., the i-th row of H). For clarity, we denote H[n] i = {hj ∈ Rd : vj ∈ N(vi)[n] } as the set of representations in the embedding space corresponding to vi's n-th hop neighbors.
3.1 FromLabel Consistency to Relative Similarity
Building upon the universal label consistency diminishing property established in Section 2, we formalize this statistical pattern as a principled foundation for defining relative similarity in graphs. Formally, for any node vi, we can quantify the label consistency of its n-th hop neighbors through:
similarly, for nodes beyond hop n, we define:
Our empirical and theoretical analyses in Section 2 prove that while this relationship may not hold deterministically for every individual node, it holds statistically across the graph:
this statistical property reveals a fundamental characteristic of graphs: nodes at hop n collectively exhibit stronger semantic similarity to the anchor node compared to further nodes, regardless of the graph's homophily nature. We term this the "relative similarity" property, as it describes similarity from a relative and collective perspective rather than an absolute or individual one. To preserve this property in the learned representations H, we need our embeddings to satisfy an analogous relationship in the representation space. Let s(·, ·) denote a similarity measure between node representations. For any node vi, its representation hi should maintain:
this formulation translates the statistical patterns in label space to constraints in the embedding space, providing a principled objective for GCL. The key challenge lies in how to effectively model and preserve such collective relative similarity, which we address in the following sections.
3.2 Building Collective Similarity
The relative similarity property established in Section 3.1 reveals two key characteristics that guide our modeling choices: (1) similarity should be measured collectively across groups of nodes rather than individual pairs, and (2) the relationship is statistical rather than deterministic. These insights drive us to develop a framework that can effectively handle collective similarity patterns. A straightforward approach to handle multiple positive examples [Khosla et al., 2020] in contrastive learning is to extend InfoNCE loss [Oord et al., 2018] by summing over positive examples:
where θ(·, ·) = s(g(·), g(·)) combines a nonlinear projection head g(·) and a cosine similarity measure s(·, ·), and τ is a temperature parameter [Zhu et al., 2021; Chen et al., 2020; Tschannen et al., 2019]. However, this formulation enforces high similarity between the query q and each individual positive example p [Hoffmann et al., 2022; Khosla et al., 2020], conflicting with the statistical nature of relative similarity in graphs. A more principled approach is to sum over positive examples inside the logarithm [Miech et al., 2020]:
this formulation offers several advantages: (1) The summation inside the logarithm naturally handles collective patterns by comparing aggregate similarities between groups [Hoffmann et al., 2022; Miech et al., 2020], (2) it allows for variation within groups while maintaining their overall relative relationships, and (3) the soft nature of the exponential terms aligns with the statistical nature of our similarity definition. From an optimization perspective, minimizing Lin leads to maximizing the similarity ratio ∑p∈P exp(θ(q,p)/τ) ∑n∈N exp(θ(q,n)/τ) , which simultaneously increases collective similarity with positive examples P while decreasing that with negative examples Nnaturally aligning with our goal of modeling relative similarity, as it enhances the similarity distinction between different node groups while maintaining their collective nature.
3.3 Learning Framework
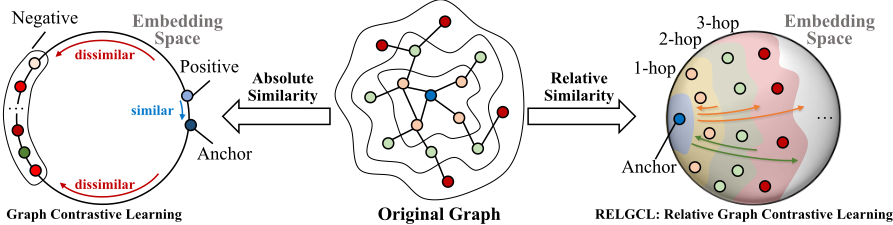
Based on the collective similarity building block, specifically adopting the Lin formulation (as shown in Equation 10) due to its advantages in handling collective patterns, we now present RELGCL for preserving the graph-inherent relative similarity (an overview of RELGCL is presented in Figure 3). For each node vi, within a k-hop neighborhood range, we aim to ensure that its n-th hop neighbors (n ≤ k) are collectively more similar to it than further neighbors. We propose two complementary implementations of RELGCL that differ in how they handle the comparison with further neighbors. Both approaches use a threshold α ∈ (0, 1) to prevent over-optimization of similarity ratios, reflecting the statistical rather than deterministic nature of relative similarity established in Section 2.2-while closer nodes exhibit stronger collective similarity statistically, this relationship should not be enforced as an absolute constraint.
RELGCLPAIR. This approach examines relative similarity through sequential pairwise comparisons between hops (e.g., comparing hop-1 vs. hop-2, hop-1 vs. hop-3, hop-2 vs.
hop-3, etc.). For any node vi, we define the pairwise similarity ratio between hop n and hop n + m as:
The overall pairwise objective is:
The pairwise implementation enables fine-grained modeling of structural transitions between specific hop distances, potentially making it more suitable for capturing oscillatory patterns in graphs (Proposition 1).
RELGCLLIST. This approach compares each hop against all its subsequent hops as a whole (e.g., comparing hop-1 vs. {hop-2, hop-3, ...}, hop-2 vs. {hop-3, hop-4, ...}, etc.). For node vi, we define the listwise similarity ratio for hop n as:
The overall listwise objective is:
The listwise implementation aggregates all subsequent hops collectively, providing a holistic view of the broader neighborhood structure.
4 Experiments
4.1 Experimental Setting
Datasets. To validate the universality of our approach, we conduct experiments on 11 real-world datasets spanning diverse domains and scales (2K to 169K nodes), including 8 homophily graphs (Cora, Citeseer, Pubmed, WikiCS, AmazonComputers, Amazon-Photo, Coauthor-CS, and ogbn-arxiv) and 3 heterophily graphs (Chameleon, Squirrel, and Actor). Baselines. We compare RELGCL against 20 representative methods across 5 categories: 2 supervised methods [Welling and Kipf, 2016; Velickovic et al., 2018], 3 graph autoencoder methods [Kipf and Welling, 2016; Hou et al., 2022], 9 augmentation-based GCL methods [Velickovic et al., 2019; Zhu et al., 2020b; Thakoor et al., 2021; Zhang et al., 2021], 5 augmentation-free GCL methods [Peng et al., 2020; Lee et al., 2022], 1 multi-task self-supervised learning based method [Jin et al., 2021]. For baselines that either don't use standard splits or don't report results on certain datasets, we reproduce their results using official implementations under the same experimental setup for fair comparison.
Evaluation Protocol. Following standard practice in GCL [Velickovic et al., 2019; Zhu et al., 2020b; Thakoor et al., 2021], we evaluate using linear evaluation: first train the graph encoder in a self-supervised manner using our relative similarity objectives, then freeze it to generate node embeddings for training a logistic regression classifier. For datasets with multiple splits (e.g., WikiCS with 20 public splits), we conduct experiments on all provided splits. We report the average classification accuracy and standard deviation over 20 random runs with different random seeds to ensure reliability. Implementation Details. We implement RELGCL using GCN [Welling and Kipf, 2016] as the encoder, optimized with Adam [Kingma and Ba, 2014] on a NVIDIA V100 GPU. Based on our empirical analysis in Section 2.1, we set the neighborhood range k = 4 to capture meaningful structural patterns, as the number of semantically similar neighbors becomes particularly small beyond 4 hops.
4.2 Overall Performance
Performance on Homophily Graphs. We first evaluate RELGCL on 7 widely-used homophily graphs. Table 1 presents a comprehensive comparison against 20 baselines. Several key observations emerge: (1) Both implementations of RELGCL achieve superior performance across datasets, outperforming all baselines with average ranks of both 1.6 versus the best baseline rank of 5.3. This demonstrates that leveraging inherent structural patterns through relative similarity is more effective than artificially imposing absolute similarity constraints through augmentations. (2) The comparable performance between pairwise and listwise implementations (achieving SOTA on 4 and 3 datasets respectively) validates the robustness of our relative similarity frameworkboth approaches effectively capture the smooth decay patterns theoretically predicted in Section 2.2. (3) Methods like SUGRL [Mo et al., 2022], AFGRL [Lee et al., 2022] and GraphACL [Xiao et al., 2024] that only leverage local absolute similarity, or AUTOSSL [Jin et al., 2021] that relies on homophily-guided task search, achieve inferior results. This highlights the advantage of modeling broader structural-semantic relationships over focusing solely on immediate neighborhoods or artificial task designs.
Performance on Heterophily Graphs. We further evaluate RELGCL on 3 heterophily graphs. Table 2 demonstrates the effectiveness of our approach: (1) Both implementations of RELGCL substantially outperform all baselines across these datasets, validating that our approach of modeling relative similarity patterns remains effective even when local connectivity patterns differ significantly from homophily graphs. (2) RELGCLPAIR consistently outperforms RELGCLLIST across all 3 heterophily datasets, as the fine-grained pairwise implementation may better capture the oscillatory decay patterns characteristic of heterophily graphs. (3) AFGRL [Lee et al., 2022] that assume local homophily (treating immediate neighbors as similar) show significantly worse performance, confirming the importance of moving beyond local connectivity assumptions to capture universal structural patterns.
Extensibility Analysis. We demonstrate RELGCL's extensibility across different scales and tasks: (1) On the large-scale ogbn-arxiv graph dataset (169K nodes, 1.2M edges), following [Hu et al., 2020; Thakoor et al., 2021], both implementations outperform existing unsupervised methods (Table 3). (2) For additional downstream tasks (node clustering and similarity search), our method consistently achieves superior performance across representative datasets (Table 4), with substantial improvements over methods that only consider local patterns [Lee et al., 2022]. These results validate that capturing broader structural relationships through relative similarity modeling produces versatile representations that generalize well across scales and tasks.
| Method | Cora | Citeseer | Pubmed | WikiCS | Computers | Photo | Co.CS | Rank |
|---|---|---|---|---|---|---|---|---|
| GCN | 81.5 | 70.3 | 79.0 | 77.19±.12 | 86.51±.54 | 92.42±.22 | 93.03±.31 | 16.7 |
| GAT | 83.0±.7 | 72.5±.7 | 79.0±.3 | 77.65±.11 | 86.93±.29 | 92.56±.35 | 92.31±.24 | 14.4 |
| GAE | 71.5±.4 | 65.8±.4 | 72.1±.5 | 70.15±.01 | 85.27±.19 | 91.62±.13 | 90.01±.71 | 21.4 |
| VGAE | 76.3±.2 | 66.8±.2 | 75.8±.4 | 75.63±.19 | 86.37±.21 | 92.20±.11 | 92.11±.09 | 19.7 |
| GraphMAE | 84.2±.4 | 73.4±.4 | 81.1±.4 | 77.12±.30 | 79.44±.48 | 90.71±.40 | 93.13±.15 | 11.9 |
| DGI | 82.3±.6 | 71.8±.7 | 76.8±.6 | 75.35±.14 | 83.95±.47 | 91.61±.22 | 92.15±.63 | 19.0 |
| MVGRL | 83.5±.4 | 73.3±.5 | 80.1±.7 | 77.52±.08 | 87.52±.11 | 91.74±.07 | 92.11±.12 | 13.6 |
| GRACE | 81.9±.4 | 71.2±.5 | 80.6±.4 | 78.19±.01 | 86.25±.25 | 92.15±.24 | 92.93±.01 | 15.4 |
| GCA | 82.1±.1 | 71.3±.4 | 80.2±.4 | 78.30±.00 | 87.85±.31 | 92.49±.09 | 93.10±.01 | 13.7 |
| BGRL | 82.7±.6 | 71.1±.8 | 79.6±.5 | 79.31±.55 | 89.62±.37 | 93.07±.34 | 92.67±.21 | 11.7 |
| G-BT | 81.5±.4 | 71.9±.5 | 80.4±.6 | 76.65±.62 | 88.14±.33 | 92.63±.44 | 92.95±.17 | 14.3 |
| CCA-SSG | 84.2±.4 | 73.1±.3 | 81.6±.4 | 78.65±.14 | 88.74±.28 | 93.14±.14 | 93.31±.22 | 6.4 |
| gCooL | 83.2±.5 | 72.7±.4 | 80.5±.4 | 78.74±.04 | 88.85±.14 | 93.18±.12 | 93.32±.02 | 8.3 |
| HomoGCL | 84.5±.5 | 72.3±.7 | 81.1±.3 | 78.84±.47 | 88.46±.20 | 92.92±.18 | 92.74±.22 | 8.9 |
| COSTA | 83.3±.3 | 72.1±.3 | 81.1±.2 | 79.12±.02 | 88.32±.03 | 92.56±.45 | 92.94±.10 | 9.7 |
| SUGRL | 83.4±.5 | 73.0±.4 | 81.9±.3 | 78.97±.22 | 88.91±.22 | 92.85±.24 | 92.83±.23 | 7.9 |
| AFGRL | 83.2±.4 | 72.6±.3 | 80.8±.6 | 77.62±.49 | 89.88±.33 | 93.22±.28 | 93.27±.17 | 8.0 |
| SP-GCL | 83.2±.2 | 72.0±.4 | 79.1±.8 | 79.01±.51 | 89.68±.19 | 92.49±.31 | 91.92±.10 | 12.6 |
| GraphACL | 84.2±.3 | 73.6±.2 | 82.0±.2 | 79.27±.45 | 89.80±.25 | 93.31±.19 | 92.77±.14 | 5.3 |
| AUTOSSL | 83.1±.4 | 72.1±.4 | 80.9±.6 | 76.80±.13 | 88.18±.43 | 92.71±.32 | 93.35±.09 | 11.0 |
| RELGCLPAIR | 84.4±.2 | 73.7±.4 | 82.2±.3 | 80.14±.51 | 90.14±.35 | 93.42±.44 | 93.53±.12 | 1.6 |
| RELGCLLIST | 84.5±.4 | 73.6±.5 | 82.7±.4 | 80.16±.58 | 89.99±.38 | 93.40±.48 | 93.50±.12 | 1.6 |
| Method | Chameleon | Squirrel | Actor |
|---|---|---|---|
| DGI GRACE GCA BGRL AFGRL SP-GCL GraphACL | 60.27 ±0.70 61.24 ±0.53 60.94 ±0.81 64.86 ±0.63 59.03 ±0.78 65.28 ±0.53 69.12 ±0.24 | 42.22 ±0.63 | 28.30 ±0.76 |
| 41.09 ±0.85 | 28.27 ±0.43 | ||
| 41.53 ±1.09 | 28.89 ±0.50 | ||
| 46.24 ±0.70 | 28.80 ±0.54 | ||
| 42.36 ±0.40 | 27.43 ±1.31 | ||
| 52.10 ±0.67 | 28.94 ±0.69 | ||
| 54.05 ±0.13 | 30.03 ±0.13 | ||
| RELGCLPAIR | 69.25±0.89 | 57.67±0.96 | 30.32±0.91 |
| RELGCLLIST | 69.06 ±0.86 | 57.53 ±0.92 | 30.23 ±0.88 |
4.3 Structural Pattern Analysis
Impact of Neighborhood Range. We investigate how the choice of neighborhood range k affects model performance across different graph types and scales. Figure 4 shows the performance variations with different k values on 3 categories of datasets: small homophily graphs (Cora), large homophily graphs (WikiCS), and heterophily graphs (Squirrel, Actor). The analysis reveals distinct patterns: (1) For small homophily graph, optimal performance is achieved with k = 1 or 2, with accuracy declining as k increases. This aligns with our empirical analysis in Section 2.1, where label consistency drops substantially (to around 20% at k = 4) in homophily graphs-when graph size is small, the number of semantically similar nodes at larger distances becomes too sparse to provide meaningful signals. (2) For large homophily graph and heterophily graphs, performance generally improves with increasing k until k = 3 or 4. This suggests that larger graphs benefit from capturing broader structural relationships, while heterophily graphs require a wider range to effectively model their oscillatory decay patterns characterized in Section 2.2. (3) Performance stabilizes or declines beyond k = 4 across most datasets, supporting our default setting.
| Method | Validation | Test |
|---|---|---|
| DGI | 71.26 ± 0.11 | 70.34 ± 0.16 |
| GRACE-Sampling | 72.61 ±0.15 | 71.51 ± 0.11 |
| G-BT | 71.16 ± 0.14 | 70.12 ± 0.18 |
| BGRL | 72.53 ± 0.09 | 71.64 ± 0.12 |
| CCA-SSG | 72.34 ± 0.21 | 71.24 ± 0.20 |
| GraphACL | 72.59 ± 0.20 | 71.68 ± 0.22 |
| RELGCLPAIR | 72.69 ± 0.14 | 72.06 ± 0.20 |
| RELGCLLIST | 72.75±0.12 | 72.24±0.19 |
| Supervised GCN | 73.00 ±0.17 | 71.74 ± 0.29 |
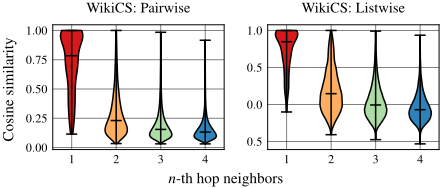
Preservation of Label Consistency Pattern. To verify whether our learned representations preserve the universal decay property, we analyze the similarity distributions across different structural distances in the embedding space. Figure 5 shows the cosine similarity distributions between node representations at different hop distances on WikiCS datasets. The results reveal that: (1) The similarities exhibit an overall diminishing trend as structural distance increases, consistent with Theorem 1's prediction of exponential convergence in label distributions. This empirically validates that our framework effectively captures the universal decay pattern without explicit constraints. (2) While maintaining this collective trend, individual variations exist where some further neighbors show higher similarity than closer ones. This aligns with both our empirical observations in Section 2.1 and the theoretical prediction that convergence occurs at a statistical rather than individual level.

| Dataset Metric | WikiCS | Computers | Photo | |||
|---|---|---|---|---|---|---|
| NMI | Sim@5 | NMI | Sim@5 | NMI | Sim@5 | |
| GRACE | 0.4282 | 0.7754 | 0.4793 | 0.8738 | 0.6513 | 0.9155 |
| GCA | 0.3373 | 0.7786 | 0.5278 | 0.8826 | 0.6443 | 0.9112 |
| BGRL | 0.3969 | 0.7739 | 0.5364 | 0.8947 | 0.6841 | 0.9245 |
| AFGRL | 0.4132 | 0.7811 | 0.5520 | 0.8966 | 0.6563 | 0.9236 |
| RELGCLPAIR | 0.4354 | 0.7919 | 0.5643 | 0.8992 | 0.6935 | 0.9302 |
| RELGCLLIST | 0.4376 | 0.7951 | 0.5627 | 0.8988 | 0.6917 | 0.9297 |
4.4 Framework Analysis
Collective Similarity Design. We compare our collective similarity formulation Lin (Equation 10) against individual similarity summation Lout (Equation 9) on 4 representative datasets. Table 5 shows consistent performance degradation (>1% drop on Cora and WikiCS) when switching to individual similarity summation. This validates the design motivation in Section 3.3-while nodes at different distances may share labels with the anchor node (as established in our theoretical analysis), enforcing individual similarity constraints fails to capture the statistical nature of these relationships. Our collective formulation, by comparing aggregate similarities between groups, maintains robustness to individual variations while preserving the broader structural patterns.
| Method | Cora | Citeseer | WikiCS | Photo |
|---|---|---|---|---|
| RELGCLPAIR | 84.4 | 73.7 | 80.14 | 93.42 |
| -Lout | 83.4(↓1.0) | 73.1(↓0.6) | 78.71(↓1.43) | 93.16(↓0.26) |
| RELGCLLIST | 84.5 | 73.6 | 80.16 | 93.40 |
| -Lout | 83.4(↓1.1) | 73.3(↓0.3) | 78.94(↓1.22) | 93.18(↓0.22) |
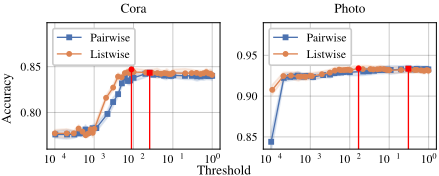
Relative Similarity Control. We analyze the impact of threshold α by varying it in [0.0001, 1.0] while keeping other parameters fixed. Figure 6 shows that: (1) Both implementations achieve optimal performance at moderate α valuesextremely small thresholds overly restrict similarity relationships, while large values fail to distinguish between different structural distances. (2) RELGCLLIST consistently requires smaller optimal α values than RELGCLPAIR, reflecting their different granularities in modeling structural relationships. This empirically supports our framework's flexibility in adapting to different similarity modeling strategies while maintaining effective relative similarity control.
5 Conclusion
This work fundamentally reimagines similarity in graph contrastive learning by discovering a universal pattern: the systematic diminishing of label consistency with structural distance. Through rigorous analysis, we establish random walk guarantees for this pattern in both homophily and heterophily graphs. Building on these insights, we develop RELGCL, a principled framework that preserves these inherent patterns through collective similarity objectives. Extensive experiments validate that leveraging natural relative similarity yields superior performance across diverse graph types, opening new directions for robust graph representation learning.
Acknowledgements
This work is supported by the Science and Technology Development Fund (FDCT), Macau SAR (file no. 0123/2023/RIA2, 001/2024/SKL), the National Natural Science Foundation of China (Grant Nos. 92470204, 62406306 and 62406056), and the State Key Laboratory of Internet of Things for Smart City (University of Macau) No. SKLIoTSC(UM)-2024-2026/ORP/GA02/2023.
@inproceedings{ijcai2025p358,
  title     = {Rethinking Graph Contrastive Learning Through Relative Similarity Preservation},
  author    = {Ning, Zhiyuan and Wang, Pengfei and Qiao, Ziyue and Wang, Pengyang and Zhou, Yuanchun},
  booktitle = {Proceedings of the Thirty-Fourth International Joint Conference on
               Artificial Intelligence, {IJCAI-25}},
  publisher = {International Joint Conferences on Artificial Intelligence Organization},
  editor    = {James Kwok},
  pages     = {3217--3225},
  year      = {2025},
  month     = {8},
  note      = {Main Track},
  doi       = {10.24963/ijcai.2025/358},
  url       = {https://doi.org/10.24963/ijcai.2025/358},
}
TY - CPAPER TI - Rethinking Graph Contrastive Learning Through Relative Similarity Preservation AU - Ning, Zhiyuan AU - Wang, Pengfei AU - Qiao, Ziyue AU - Wang, Pengyang AU - Zhou, Yuanchun T2 - Proceedings of the Thirty-Fourth International Joint Conference on Artificial Intelligence, IJCAI-25 PB - International Joint Conferences on Artificial Intelligence Organization PY - 2025 SP - 3217 EP - 3225 DO - 10.24963/ijcai.2025/358 UR - https://doi.org/10.24963/ijcai.2025/358 ER -Copied
Machine-readable versions of this paper, for tools and AI agents:





