
TrajAR: Long-Term Trajectory Prediction at Urban Intersections via Multi-scale Interaction Perception
Proceedings of the Thirty-Fifth International Joint Conference on Artificial Intelligence. Main Track. Pages 2635-2643.
https://doi.org/10.24963/ijcai.2026/293
Keywords
- Data Mining: Mining spatial and/or temporal data
Abstract
Accurate trajectory prediction of multiple road users at urban intersections--including motorized and nonmotorized vehicles and pedestrians--is critical for cooperative vehicle-infrastructure systems and intelligent transportation systems. This study focuses on multiple road users' trajectory prediction in urban intersections. Such predictions face two key challenges: modeling interactions among multiple road users in complex scenarios and achieving accurate long-term prediction. Existing solutions inadequately incorporate these interactions and suffer from error accumulation or overall bias when performing long-term prediction. To overcome these challenges, we propose a long-term Trajectory prediction multi-scale AutoRegressive framework (TrajAR), which follows an encoder-decoder structure. The encoder dynamically perceives road users' motion trends, types, signals, and implicit interactions for effective handling of complex scenarios. The decoder employs a multi-scale prediction strategy that progressively refines the predicted trajectory from coarse to fine scales, where coarse-scale predictions establish long-term path backbones and finer scales enhance precision. These designs allow TrajAR to achieve accurate long-term prediction in real-world scenarios, demonstrated through experiments on four real-world urban datasets from different intersections. Our results show an average improvement of 23.8%. We provide the code of TrajAR at https://github.com/LetianGong/TrajAR.
- [Abdelraouf et al., 2022] Amr Abdelraouf, Mohamed Abdel- Aty, Zijin Wang, and Ou Zheng. Trajectory prediction for vehicle conflict identification at intersections using sequence-to-sequence recurrent neural networks. arXiv preprint arXiv:2210.08009, 2022.
- [Bhattacharyya et al., 2024] Prarthana Bhattacharyya, Chengjie Huang, and Krzysztof Czarnecki. Ssl-interactions: Pretext tasks for interactive trajectory prediction. arXiv preprint arXiv:2401.07729, 2024.
- [Chen and Wang, 2024] Siyuan Chen and Jiahai Wang. Het- erogeneous interaction modeling with reduced accumulated error for multi-agent trajectory prediction. arXiv preprint arXiv:2410.21342, 2024.
- [Chen et al., 2022] Xiaobo Chen, Huanjia Zhang, Feng Zhao, Yu Hu, Chenkai Tan, and Jian Yang. Intention-aware vehi- cle trajectory prediction based on spatial-temporal dynamic attention network for internet of vehicles. IEEE Transac- tions on Intelligent Transportation Systems, 23(10):19471- 19483, 2022.
- [Deo and Trivedi, 2018] Nachiket Deo and Mohan M Trivedi. Convolutional social pooling for vehicle trajectory predic- tion. In Proceedings of the IEEE conference on computer vi- sion and pattern recognition workshops, pages 1468-1476, 2018.
- [Goldhammer et al., 2018] Michael Goldhammer, Sebastian Köhler, Stefan Zernetsch, Konrad Doll, Bernhard Sick, and Klaus Dietmayer. Intentions of vulnerable road users-detection and forecasting by means of machine learning. arXiv, abs/1803.03577, 2018.
- [Huang et al., 2020] Zijie Huang, Yizhou Sun, and Wei Wang. Learning continuous system dynamics from irregularly- sampled partial observations. Advances in Neural Informa- tion Processing Systems, 33:16177-16187, 2020.
- [Jiang et al., 2025] Jiaming Jiang, Kai Yan, Xindong Xia, and Biao Yang. A survey of deep learning-based pedestrian trajectory prediction: Challenges and solutions. Sensors, 25(3):957, 2025.
- [Jiao et al., 2023] Yujun Jiao, Mingze Miao, Zhishuai Yin, Chunyuan Lei, Xu Zhu, Linzhen Nie, and Bo Tao. A hierar- chical hybrid learning framework for multi-agent trajectory prediction. arXiv preprint arXiv:2303.12274, 2023.
- [Kawasaki and Tasaki, 2018] Atsushi Kawasaki and Tsuyoshi Tasaki. Trajectory prediction of turning vehicles based on intersection geometry and observed velocities. In 2018 IEEE Intelligent Vehicles Symposium (IV), pages 511-516. IEEE, 2018.
- [Lepikhin et al., 2020] Dmitry Lepikhin, HyoukJoong Lee, Yuanzhong Xu, Dehao Chen, Orhan Firat, Yanping Huang, Maxim Krikun, Noam Shazeer, and Zhifeng Chen. Gshard: Scaling giant models with conditional computation and au- tomatic sharding. arXiv preprint arXiv:2006.16668, 2020.
- [Li et al., 2019] Xin Li, Xiaowen Ying, and Mooi Choo Chuah. Grip++: Enhanced graph-based interaction-aware trajectory prediction for autonomous driving. arXiv preprint arXiv:1907.07792, 2019.
- [Li et al., 2022] Keqiang Li, Hui Xiong, and Jinxin Liu. Vul- nerable road user multi-target motion trajectory predic- tion method. Chinese Journal of Highway and Transport, 35(1):298-315, 2022.
- [Liao et al., 2024a] Haicheng Liao, Yongkang Li, Zhenning Li, Chengyue Wang, Zhiyong Cui, Shengbo Eben Li, and Chengzhong Xu. A cognitive-based trajectory prediction approach for autonomous driving. IEEE Transactions on Intelligent Vehicles, 2024.
- [Liao et al., 2024b] Haicheng Liao, Zhenning Li, Huanming Shen, Wenxuan Zeng, Dongping Liao, Guofa Li, and Chengzhong Xu. Bat: Behavior-aware human-like trajec- tory prediction for autonomous driving. In Proceedings of the AAAI Conference on Artificial Intelligence, volume 38, pages 10332-10340, 2024.
- [Rowe et al., 2023] Luke Rowe, Martin Ethier, Eli-Henry Dykhne, and Krzysztof Czarnecki. Fjmp: Factorized joint multi-agent motion prediction over learned directed acyclic interaction graphs. In Proceedings of the IEEE/CVF Con- ference on Computer Vision and Pattern Recognition, pages 13745-13755, 2023.
- [Rudenko et al., 2019] Andrey Rudenko, Luigi Palmieri, Michael Herman, Kris M. Kitani, Dariu M. Gavrila, and Kai O. Arras. Human motion trajectory prediction: A survey. arXiv, abs/1905.06113, 2019.
- [Shen et al., 2025] Zekai Shen, Haitao Yuan, Xiaowei Mao, Congkang Lv, Shengnan Guo, Youfang Lin, and Huaiyu Wan. Towards an efficient and effective en route travel time estimation framework. In International Conference on Database Systems for Advanced Applications, pages 604-619. Springer, 2025.
- [Song et al., 2020] Haoran Song, Wenchao Ding, Yuxuan Chen, Shaojie Shen, Michael Yu Wang, and Qifeng Chen. Pip: Planning-informed trajectory prediction for autonomous driving. In Computer Vision-ECCV 2020: 16th European Conference, Glasgow, UK, August 23-28, 2020, Proceedings, Part XXI 16, pages 598-614. Springer, 2020.
- [Tian et al., 2024] Keyu Tian, Yi Jiang, Zehuan Yuan, Bingyue Peng, and Liwei Wang. Visual autoregressive modeling: Scalable image generation via next-scale predic- tion. Advances in neural information processing systems, 37:84839-84865, 2024.
- [Velickovic et al., 2017] Petar Velickovic, Guillem Cucurull, Arantxa Casanova, Adriana Romero, Pietro Lio, and Yoshua Bengio. Graph attention networks. stat, 1050:20, 2017.
- [Wang et al., 2023] Renzhi Wang, Senzhang Wang, Hao Yan, and Xiang Wang. Wsip: Wave superposition inspired pool- ing for dynamic interactions-aware trajectory prediction. In Proceedings of the AAAI Conference on Artificial Intelli- gence, volume 37, pages 4685-4692, 2023.
- [Wang et al., 2025a] Tingjing Wang, Daiquan Xiao, Xuecai Xu, and Quan Yuan. A survey on vehicle trajectory prediction procedures for intelligent driving. Sensors, 25(16):5129, 2025.
- [Wang et al., 2025b] Zichen Wang, Hao Miao, Senzhang Wang, Renzhi Wang, Jianxin Wang, and Jian Zhang. C2f- tp: A coarse-to-fine denoising framework for uncertainty- aware trajectory prediction. In Proceedings of the AAAI Conference on Artificial Intelligence, volume 39, pages 12810-12817, 2025.
- [Wei et al., 2024] Chuheng Wei, Guoyuan Wu, Matthew J Barth, Amr Abdelraouf, Rohit Gupta, and Kyungtae Han. Ki-gan: Knowledge-informed generative adversarial net- works for enhanced multi-vehicle trajectory forecasting at signalized intersections. In Proceedings of the IEEE/CVF Conference on Computer Vision and Pattern Recognition, pages 7115-7124, 2024.
- [Westny et al., 2023] Theodor Westny, Joel Oskarsson, Björn Olofsson, and Erik Frisk. Mtp-go: Graph-based proba- bilistic multi-agent trajectory prediction with neural odes. IEEE Transactions on Intelligent Vehicles, 8(9):4223-4236, 2023.
- [Xu et al., 2022] Yanchao Xu, Wenbo Shao, Jun Li, Kai Yang, Weida Wang, Hua Huang, Chen Lv, and Hong Wang. SIND: A drone dataset at signalized intersection in china. In 25th IEEE International Conference on Intelligent Transporta- tion Systems, ITSC 2022, Macau, China, October 8-12, 2022, pages 2471-2478. IEEE, 2022.
References were extracted automatically from the PDF and may contain errors.
Full text extracted automatically from the PDF; figures, tables and equations may differ. The PDF is the version of record.
1 Introduction
Accurate trajectory prediction of multiple road usersincluding motorized and non-motorized vehicles and pedestrians-represents a critical task in cooperative vehicleinfrastructure systems (CVIS), and has extensive applications in intelligent transportation systems (ITS), such as intelligent surveillance and traffic strategy simulation [Wang et al., 2025a; Jiang et al., 2025; Rudenko et al., 2019; Goldhammer et al., 2018; Li et al., 2022; Shen et al., 2025]. This study focuses on multiple road users' trajectory prediction, analyzing the trajectory of road users derived from unmanned aerial vehicles (UAVs) recorded videos. These UAVs are deployed as roadside perception devices to record trajectories at intersections.
∗Corresponding author.
One challenge of multiple road users' trajectory prediction stems from the complexity of real-world traffic.
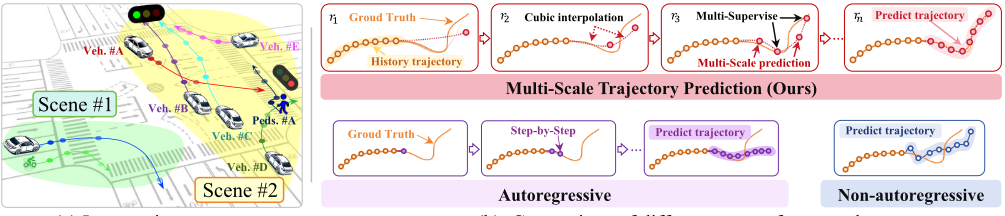
Fig. 1(a) presents two scenes at urban intersections, where each road user includes 4 timesteps of future motion. In Scene #1, the road users do not interact with each other, and their future motion can be simply predicted based on the historical motion trend. Scene #2 is much more complicated with interactions between multiple road users. Specifically, left-turning Veh. #A will interact with straight-moving Veh. #B in the next 2 timesteps and give way to Veh. #B. Based on the motion trend and positions of Veh. #C and Peds. #A at the 3rd timestep, they do not interfere with Veh. #A's left-turn motion, thus their future motion will not interfere with that of Veh. #A. At timestep 4, the motion of Veh. #C and Veh. #E indicates potential collision risk, requiring the turning of Veh. #E to give way and avoid interfering with the straight-moving Veh. #C. Meanwhile, Veh. #D's right-turn motion does not obstruct Peds #A's path even though they are close, thus their motion can be regarded as non-interactive in this scenario. Accurate multiple road users' trajectory prediction necessitates incorporating implicit interactions derived from both dynamic information (including signals, road users' positions, motion trends) and static information, including road users' types and traffic restrictions (e.g., rules where turning vehicles give way to straight-moving traffic, right-turning vehicles give way to left-turning ones in countries following right-hand traffic (RHT), and all vehicles give way to pedestrians). While existing methods demonstrate satisfactory performance in simple scenarios like that in Scene #1, they struggle to incorporate the implicit interactions like that in Scene #2. Thus, their effectiveness in real-world traffic environments remains limited. [Bhattacharyya et al., 2024;
(a) Intersections scenes
(b) Comparison of different output frameworks
Figure 1: (a) illustrates the interactions among road users in a simple Scene #1 and a complex Scene #2, with each scenario showing the positions of all road users over the next four timesteps. (b) presents three decoding strategies for trajectory prediction: autoregressive, non-autoregressive, and our proposed multi-scale trajectory prediction approach.
Jiao et al., 2023; Chen and Wang, 2024]
Another challenge lies in achieving accurate long-term trajectory prediction. Existing trajectory prediction methods typically adopt one of the two frameworks shown in Fig. 1(b), either autoregressive or non-autoregressive. [Wei et al., 2024; Westny et al., 2023] The autoregressive approach suffers from error accumulation, leading to significant deviation in the latter part of the predicted trajectory. On the other hand, the non-autoregressive method predicts all future steps in parallel, which tends to introduce bias into the whole predicted trajectory. Each prediction step lacks correction mechanisms with insights from the previous step, risking violation of kinematic constraints, such as abrupt acceleration changes or unrealistic turning radii.
To address these challenges, we propose a long-term Trajectory prediction multi-scale AutoRegressive framework (TrajAR), which follows an encoder-decoder structure. The TrajAR encoder is a dynamic perception encoder that models their motion trends, road user types, and signals, incorporating implicit constraints. The TrajAR decoder introduces a multiscale trajectory prediction structure inspired by VAR [Tian et al., 2024] in image generation. As illustrated in Fig. 1(b), the TrajAR decoder progressively generates trajectories from a coarser scale rn to a finer scale rn+1. The coarse-scale predictions form the backbone of long-term trajectories and receive more frequent supervision to minimize error accumulation, while finer-scale predictions maintain precision through cubic interpolation constraints based on previous scales. These designs together enable both dynamic perception of trajectory and long-term forecasting, allowing TrajAR to understand complex scenarios while delivering precise trajectory predictions effectively. Our contributions are summarized as follows:
- We reformulate autoregressive trajectory prediction from next-step to next-scale, enabling coarse-to-fine trajectory generation. This approach reduces error accumulation and improves long-term prediction accuracy.
- A motion MoE module and a GAT-based interaction layer are introduced to jointly model road user types, motion trends, traffic signals, and implicit interactions. This allows TrajAR to better handle complex scenarios at intersections.
- Extensive experiments on four real-world intersection datasets show that TrajAR outperforms state-of-the-art meth-
ods by up to 32.0% in FDE and 29.8% in APDE, demonstrating its robustness and generalization ability.
2 RelatedWork
Trajectory prediction for road users is vital in complex urban environments and can be broadly categorized into two scenarios: highway on-ramps/off-ramps and intersections.
Trajectory Prediction at HighwayOn/Off-Ramps In highway on-ramp and off-ramp scenarios, researchers primarily focus on predicting vehicle behaviors such as lane changing and acceleration or deceleration, while accounting for the influence of surrounding vehicles on target vehicle motion. Notable approaches include CS-LSTM [Deo and Trivedi, 2018] and PiP [Song et al., 2020], which introduce social pooling layers to capture inter-vehicle interactions. WSiP [Wang et al., 2023] advances this concept by modeling interactions as wave superposition through a wave-pooling mechanism, which C2F-TP [Wang et al., 2025b] further enhances using diffusionbased trajectory generation. BAT [Liao et al., 2024b] employs dynamic geometric graphs for driving behavior modeling, while HLTP [Liao et al., 2024a] incorporates vision-aware pooling with a knowledge distillation framework to refine interaction representations. These scenarios, however, typically involve only one type of vehicle, resulting in relatively homogeneous interaction patterns. Moreover, the datasets used in these studies are predominantly collected under free-flowing traffic conditions, lacking validation in congested or highly interactive environments that are targeted in this paper.
Trajectory Prediction at Intersections Trajectory prediction at intersections is highly challenging due to multiple road users (vehicles, bicycles, pedestrians) and explicit traffic regulations (e.g., traffic lights, right-of-way). These scenarios involve diverse and dynamic interaction patterns, where accurate prediction must consider not only road users' motion trends and kinematic constraints but also their implicit interactions with various surrounding road users. Early efforts [Abdelraouf et al., 2022; Kawasaki and Tasaki, 2018] primarily focuses on single road user prediction using LSTMbased or physics-based models, but fails to capture multiple road users' dynamics. Addressing this limitation, GRIP++ [Li et al., 2019] and LG-ODE [Huang et al., 2020] utilize GNNs to encode multi-agent scenes and apply RNN- or neural ODEbased decoders for prediction. MTP-GO [Westny et al., 2023] introduces multi-modal probabilistic outputs using mixture density networks and Kalman filtering, while FJMP [Rowe et al., 2023] combines attention mechanisms with sparse interaction graphs based on influencer-reactor relationships to improve future interaction modeling. Recognizing the impact of traffic signals, KI-GAN [Wei et al., 2024] incorporates vehicle motion, signal states, and spatial relations through multiple encoders and an attention pooling module, enabling more accurate prediction under traffic regulations. Furthermore, intersections frequently experience congestion and conflict points, further complicating accurate long-term forecasting. While many models perform well in controlled or highwaylike environments, their generalization to complex, multiple road user urban intersections remains limited.
3 Preliminary
Trajectory Features zν t of a road user ν at time t include road users' motion positions τνt = (xνt , yν t ) and the traffic signal state st ∈ RNs at time t. Road users include the target road user νT , and road users νI ∈ VI interacting with it (denoted as interactive road users). Each road user has a type attribute, such as vehicle, bicycle, pedestrian, etc., represented as a one-hot vector av, and Na is the number of unique types. The traffic signal state lt ∈ RNl is a one-hot vector, representing one of the states among all possible combinations of traffic signals at the intersection. The set VI of interaction road users is selected as the NR road users closest to the target road user.
Problem Definition The trajectory prediction problem is formulated as estimating the future motion positions ⟨τνT t0+1 , τνT t0+2 , . . . , τνT t0+tf ⟩ of the target road user given the history H, where tf is the prediction horizon and t0 is the current time. The history H = ⟨zν t0-th+1 , zν t0-th+2 , . . . , zν t0 ⟩, ν ∈ VI ∪ {νT } consist of the history trajectory features of target and interactive road users from time t0 - th + 1 to t0, where th is the history horizon.
4 Methodology
4.1 TrajAR Encoder
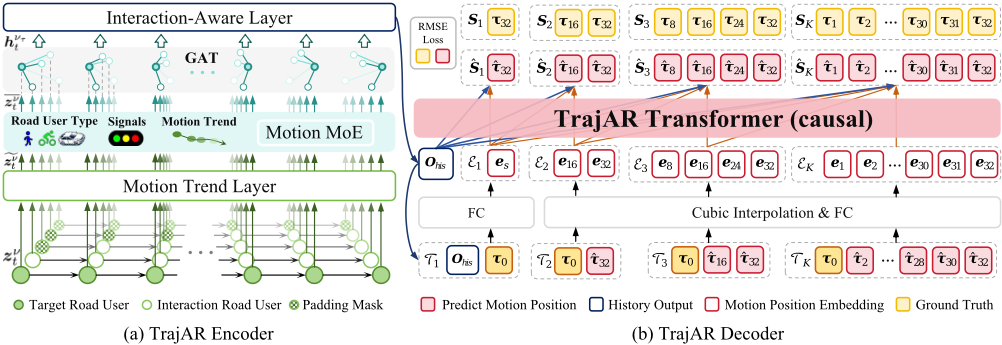
The TrajAR encoder comprises three key layers: (1) Motion trend layer that standardizes variable-length road users' motion positions into unified-length motion trends; (2) Motion MoE layer combining indicator and route experts to model road users' motion intentions; (3) Interaction-aware layer that uses dynamic interaction graphs to construct implicit interactions of the target road user, then incorporates these implicit interactions with explicit traffic regulations via Transformer-based situation awareness. Since the encoder processes historical trajectory features, we assume that the time range in this section is t0 - th < t ≤ t0 unless otherwise specified.
Motion Trend Layer The motion trend layer primarily captures the motion trends of road users from their historical trajectory features, providing a foundation for subsequent modeling of interactions between road users. We implement this layer as a single-layer Transformer encoder. Because road users enter and leave the frame at different times, their trajectory feature sequences can vary in length. As illustrated in Fig. 2(a), we temporally align the trajectory features of each road user and pad all sequences to the same length th. For each road user's trajectory feature sequence ⟨zν t ⟩, we process it through the motion trend layer. The output at step t, denoted as ˜ zν t , represents the road user's motion trend at time t.
MotionMoE The motion intention of a road user, defined as its planned future movement behavior, depends on multiple aspects of information, including its specific type attributes, motion trends, and signal states at a specific time. To extract motion intention in complex scenarios, we propose motion Mixture-of-Experts (MoE). This architecture enhances effectiveness by incorporating multi-aspect information through specialized experts, each handling distinct informational aspects. Compared with traditional MoE architectures like GShard [Lepikhin et al., 2020], Motion MoE employs a specialized structure: indicator experts for modeling motion trends, and route experts for modeling type attributes and signal states. The output of Motion MoE, denoted as zν t , is calculated as:
where pn,t = Sigmoid(˜ zν t cn) represents the trend-to-expert affinity, indicating the relevance to the n-th routing expert. Here, I a n and I sn are one-hot indicators that mark the positions of the current road user type and traffic signal state, respectively. We use 8 routed experts. Na and Nl denote the numbers of road user type indicator experts, signal state indicator experts, respectively. FFN(a) n (·), FFN(s) n (·) and FFN(r) n (·) represent the n-th indicator expert or routed expert, respectively; Kr specifies the number of activated routed experts; gn is the gating value for the n-th route expert; cn is the centroid vector of the n-th routed expert; and TopK(·, K) denotes the set comprising K highest scores among the affinity scores calculated for the motion trend ˜ zν t and all routed experts. The indicator experts handle discrete features such as road user types and traffic signal states, while route experts model continuous features, including motion trends.
Interaction-Aware Layer This layer models implicit interactions between the target road user and its interactive road users by integrating motion intention information. To capture these interactions, we employ GAT [Velickovic et al., 2017] layers to compute attention weights between the target road user and each interactive road user. This mechanism enables the network to selectively focus on more relevant interactive road users in complex traffic scenarios. Specifically, the attention weights are determined by:
where a˜α andW˜α are learnable parameters, and γ is the leaky ReLU activation function. Note that the edge weight βν,νT t is included as a feature in the computation of ˜αν,νT t . These edge weights are computed using a Gaussian kernel:
where dν,νT is the Euclidean distance between road users ν and νT . The parameter σe controls how much to weigh down edges to road users that are far away. This parameter is learned jointly with the rest of the model. The representation of implicit interactions hνT t is then computed using the attention weights as:
Finally, we process the sequence ⟨hνT t ⟩ with a single-layer Transformer encoder. At each time step, it takes hνT t as input and produces the corresponding output oνT t . The final output of the TrajAR encoder is obtained by concatenating the outputs over the history horizon, denoted as Ohis = [oνT t0-th+1 ∥oνT t0-th+2 ∥ · · · ∥oνT t0 ].
4.2 TrajARDecoder
Multi-scale Autoregressive Prediction To address the longterm trajectory prediction challenge discussed in Sec. 1, we take inspiration from visual autoregressive modeling and reconceptualize autoregressive trajectory prediction from "next-step prediction" to "next-scale prediction". In each autoregressive step, we predict a finer resolution scale of future motion positions, rather than the next step of motion position. We start by grouping the future motion positions ⟨τνT t0+1 , τνT t0+2 , . . . , τνT t0+tf ⟩ of the target road user into K multi-scale motion position resolutions (S1, S2, . . . , SK):
As shown in Fig. 2(b), each resolution Sk is progressively finer compared to its preceding resolution Sk-1, with the final scale SK aligning with the target prediction resolution. The autoregressive likelihood is defined as:
where each autoregressive step Tk = [S0∥ ˆ Sk-1] serves as the source sequence for ˆ Sk, and T1 = [Ohis∥S0] serves as the source sequence for ˆ S1 when k = 1. During the k-th autoregressive step, the whole sequence ˆ Sk is generated in parallel.
Cubic Interpolation As shown in Fig. 2, when k = 1, we use a fully-connected layer ϕ1 to map the autoregressive step T1 to its latent embeddings E1 = ⟨es⟩. When k > 1, we perform cubic interpolation to estimate a finer resolution scale ¯ Tk on top of the motion positions in Tk. More specifically, we apply cubic interpolation to insert a new motion position between every two consecutive positions in Tk, and lastly drop τνT t0 . The result is formulated as:
where ¯τνT t denotes an interpolated motion position, and ˆτνT t denotes a motion position in ˆ Sk-1. Then, we use a fullyconnected layer ϕk to map each motion position in ¯ Tk to its corresponding latent embedding, and obtain the sequence:
Compared to alternative interpolation methods such as linear interpolation, cubic interpolation fits a smooth third-degree polynomial between motion positions, ensuring the interpolated positions' continuity in position, velocity, and curvature.
TrajAR Transformer The final output layer of the TrajAR decoder is an ld-layer Transformer decoder. To ensure the information of finer resolution scales does not leak to coarser ones, we use a block-wise causal attention mask. This ensures that each ˆ Sk can only attend to the source sequences corresponding to resolution scales not finer than k, i.e., Tj where 0 < j ≤ k. To produce the prediction of motion positions at resolution scale k, we use the sequence of autoregressive steps ⟨T1, T2, ..., Tk⟩ as the memory sequence, and the step Tk as the target sequence of the Transformer decoder. The output sequence from the decoder is fed into a one-layer MLP (with BatchNorm and Sigmoid activation function) to calculate the prediction as:
Finally, the prediction of the finest resolution scale, denoted as ˆ SK, is the output prediction of the TrajAR decoder.
Loss Function During the training phase, trajectory predictions at all resolution scales are simultaneously compared with the ground truth using RMSE loss:
5 Experiments
We focus on urban intersections due to their high practical relevance and inherent complexity. These scenes involve diverse road users-including vehicles, bicycles, and pedestrians-interacting under traffic signals and right-of-way constraints. Intersections are also common locations for vehicleinfrastructure systems deployment and are associated with a high risk of traffic conflicts. While other settings, such as highways or campuses, are also of interest, they typically feature more uniform traffic compositions and simpler interaction patterns. Our goal is to address the most safety-critical and interaction-rich scenarios, leaving broader generalization to future work. To ensure the fairness of the experiments, we run each set of experiments 5 times and report the mean value.
Datasets In our experiments, we use four real-world datasets: SinD-Tianjin, SinD-Xian, InD-Bendplatz, and InDFrankenburg. The two SinD [Xu et al., 2022] datasets record signalized intersections in Tianjin and Xian, China, at 10 Hz. The two InD datasets 1 contain recorded trajectories of four types of road users from different intersections in Germany, with several hours recorded at 25 Hz. The input and target data are down-sampled by a factor of 3, resulting in an effective sampling interval of 0.12s. To evaluate the model's performance in predicting long-term trajectory for different types of road users, the prediction step is set to 32, matching the observation window length. We split it into training, validation, and test sets in a 6:2:2 ratio based on the recorded time.
Baselines We compare our method with a set of baselines across three categories, including the most classical, the most representative, and the most recent state-of-the-art methods. First, we include classic physics-based models: CV (Constant Velocity) and CA (Constant Acceleration) assume simplified motion patterns, while Cubic generates a smooth trajectory via piecewise cubic polynomial interpolation. Second, we evaluate several learning-based methods specifically designed for vehicle trajectory prediction: C2F-TP [Wang et al., 2025b], WSiP [Wang et al., 2023], HLTP [Liao et al., 2024a], PiP [Song et al., 2020], STDAN [Chen et al., 2022], and BAT [Liao et al., 2024b]. Finally, we include multiple road users trajectory prediction baselines: MTP-GO [Westny et al., 2023], FJMP [Rowe et al., 2023], and KI-GAN [Wei et al., 2024].
Evaluation Metrics We use four types of basic metrics, the same as MTP-Go [Westny et al., 2023]: ADE (Average Displacement Error), FDE (Final Displacement Error), MR (Miss Rate), APDE (Average Path Displacement Error).
Implementation Settings For all datasets, we select the optimal parameter combinations based on validation dataset performance, including the Top value of MoE Kr and the number of TrajAR Transformer layers ld. We set the number of road user type experts Na and signal state experts Nl equal to the number of unique road user types and traffic signal states in each corresponding dataset. Specifically, we configure the parameter combinations {Kr, ld,Na,Nl} for SinDTianjin, SinD-Xian, InD-Bendplatz, and InD-Frankenburg as {2, 4, 7, 6}, {2, 6, 7, 4}, {4, 6, 4, -}, and {2, 8, 4, -}, respectively. Since the InD dataset contains no signal information, we omit the signal state experts when experimenting on this dataset to prevent interference. To ensure a fair comparison, no external contextual information is introduced during the generation phase. We set the number of closest road users of targent user NR = 15. The learning rate is set to 1e-4, and the model is pre-trained for 100 epochs on the training sets with an early-stopping patience of 5. All experiments are conducted on Intel Rapids-SP CPUs and NVIDIA A40 GPUs.
Trajectory Prediction Comparison Results in Tab. 1 and Tab. 2 show that TrajAR consistently outperforms all baselines on both datasets across all metrics, surpassing the best baseline by up to 32.0% in FDE and 29.8% in APDE. Compared with the second-best method, TrajAR achieves average improvements of 10.0%-29.0% over short- (step@8), mid- (step@16), and long-term (step@24/FDE) predictions. In contrast, traditional, physics-based, and prior deep learning methods suffer from error accumulation with increasing horizons. While graph networks and adversarial models outperform traditional methods, they still lag behind TrajAR with its dynamic perception encoding.These experimental results clearly demonstrate TrajAR's robustness and generalization capabilities across diverse road scenarios and long-term prediction tasks.
Ablation of Modules Our ablation study evaluates the contribution of each module by systematically removing individual components. Results shown in Tab. 3 that all modules are critical to TrajAR. Removing the Motion MoE significantly increases errors (ADE/FDE +118.1%/+105.8% on SinDTianjin), indicating its importance for capturing road user types and traffic light dynamics. Excluding the InteractionAware layer similarly degrades performance (ADE/FDE +115.6%/+103.1%), highlighting its role in modeling implicit multi-agent interactions. Replacing encoders with fully connected layers leads to substantial performance drops. Notably, removing the TrajAR decoder causes the largest ADE and FDE increase, validating the effectiveness of the next-scale autoregressive prediction strategy. Overall, the full model achieves the lowest errors, demonstrating the strong synergy of all components.
| Datasets | SinD-TianJin | SinD-XiAn | ||||||||||||
|---|---|---|---|---|---|---|---|---|---|---|---|---|---|---|
| Metric (e-2) Method | ADE | APDE | MR | step@8 | step@16 | step@24 | FDE | ADE | APDE | MR | step@8 | step@16 | step@24 | FDE |
| CA | 6.322 | 1.963 | 0.767 | 3.197 | 5.522 | 6.111 | 9.774 | 7.484 | 2.114 | 0.763 | 5.645 | 5.832 | 8.232 | 9.635 |
| CV | 6.161 | 2.464 | 0.704 | 3.174 | 5.568 | 8.022 | 9.193 | 8.152 | 3.145 | 0.654 | 5.053 | 4.684 | 9.074 | 16.89 |
| Cubic | 3.261 | 1.367 | 0.387 | 2.721 | 3.282 | 4.381 | 7.346 | 4.913 | 1.323 | 0.454 | 4.377 | 2.935 | 5.512 | 8.926 |
| C2F-TP | 0.732 | 0.283 | 0.267 | 0.687 | 0.951 | 1.013 | 1.933 | 0.942 | 0.322 | 0.292 | 0.944 | 0.975 | 1.194 | 2.123 |
| WSiP | 1.123 | 0.428 | 0.284 | 1.193 | 1.362 | 1.417 | 2.187 | 2.171 | 0.664 | 0.355 | 1.226 | 1.445 | 1.466 | 3.573 |
| HLTP | 1.022 | 0.393 | 0.263 | 1.066 | 0.875 | 1.792 | 3.654 | 1.787 | 0.615 | 0.432 | 1.234 | 1.477 | 1.338 | 3.114 |
| PiP | 0.756 | 0.227 | 0.142 | 0.432 | 0.463 | 0.666 | 1.057 | 0.715 | 0.328 | 0.223 | 0.474 | 0.559 | 0.685 | 1.565 |
| STDAN | 0.603 | 0.237 | 0.131 | 0.365 | 0.451 | 0.695 | 1.011 | 0.651 | 0.236 | 0.235 | 0.419 | 0.517 | 0.656 | 1.252 |
| BAT | 0.512 | 0.214 | 0.138 | 0.353 | 0.427 | 0.652 | 0.931 | 0.663 | 0.216 | 0.192 | 0.508 | 0.473 | 0.693 | 1.259 |
| MTP-GO | 0.992 | 0.496 | 0.221 | 0.621 | 0.932 | 1.174 | 2.169 | 1.543 | 0.532 | 0.342 | 1.073 | 0.936 | 1.638 | 1.912 |
| FJMP | 0.542 | 0.234 | 0.134 | 0.357 | 0.447 | 0.673 | 0.932 | 0.624 | 0.224 | 0.243 | 0.457 | 0.547 | 0.683 | 1.244 |
| KI-GAN | 0.495 | 0.196 | 0.141 | 0.374 | 0.418 | 0.628 | 0.945 | 0.666 | 0.213 | 0.197 | 0.494 | 0.513 | 0.754 | 1.245 |
| TrajAR | 0.409 | 0.151 | 0.103 | 0.279 | 0.325 | 0.503 | 0.798 | 0.509 | 0.181 | 0.166 | 0.383 | 0.403 | 0.568 | 0.942 |
| Imp.(∆%) | 21.0% | 29.8% | 27.1% | 26.5% | 28.6% | 24.8% | 16.6% | 22.5% | 17.6% | 15.6% | 9.30% | 17.3% | 15.4% | 32.0% |
| Datasets | InD-Bendplatz | InD-Frankenburg | ||||||||||||
|---|---|---|---|---|---|---|---|---|---|---|---|---|---|---|
| Metric (e-2) Method | ADE | APDE | MR | step@8 | step@16 | step@24 | FDE | ADE | APDE | MR | step@8 | step@16 | step@24 | FDE |
| CA | 5.543 | 1.911 | 0.572 | 2.634 | 4.435 | 7.233 | 9.324 | 5.893 | 3.286 | 0.531 | 2.063 | 4.673 | 8.912 | 13.66 |
| CV | 5.182 | 2.134 | 0.562 | 1.863 | 2.873 | 7.756 | 9.755 | 5.152 | 2.924 | 0.564 | 1.714 | 3.391 | 6.065 | 10.25 |
| Cubic | 2.033 | 0.962 | 0.387 | 0.934 | 1.237 | 2.467 | 3.926 | 2.327 | 1.066 | 0.432 | 0.845 | 1.594 | 2.675 | 5.857 |
| C2F-TP | 0.722 | 0.475 | 0.281 | 0.475 | 0.842 | 1.485 | 1.857 | 1.193 | 0.563 | 0.232 | 0.528 | 0.583 | 1.272 | 3.514 |
| WSiP | 1.231 | 0.637 | 0.342 | 0.856 | 1.324 | 1.848 | 3.992 | 1.862 | 1.176 | 0.421 | 0.523 | 0.852 | 2.163 | 4.325 |
| HLTP | 0.872 | 0.633 | 0.334 | 0.357 | 0.617 | 1.354 | 1.894 | 1.018 | 0.673 | 0.274 | 0.322 | 0.915 | 1.442 | 2.277 |
| PiP | 0.543 | 0.252 | 0.164 | 0.263 | 0.457 | 0.727 | 1.856 | 0.782 | 0.455 | 0.234 | 0.297 | 0.514 | 0.886 | 1.674 |
| STDAN | 0.535 | 0.255 | 0.158 | 0.262 | 0.411 | 0.735 | 1.288 | 0.572 | 0.354 | 0.246 | 0.256 | 0.407 | 0.876 | 1.584 |
| BAT | 0.536 | 0.283 | 0.156 | 0.242 | 0.389 | 0.741 | 1.189 | 0.598 | 0.334 | 0.232 | 0.229 | 0.449 | 0.789 | 1.421 |
| MTP-GO | 1.213 | 0.476 | 0.235 | 0.353 | 0.825 | 1.263 | 2.484 | 0.847 | 0.632 | 0.295 | 0.385 | 0.892 | 1.687 | 2.883 |
| FJMP | 0.532 | 0.252 | 0.163 | 0.255 | 0.398 | 0.718 | 1.197 | 0.583 | 0.324 | 0.232 | 0.221 | 0.392 | 0.884 | 1.575 |
| KI-GAN | 0.523 | 0.284 | 0.162 | 0.252 | 0.414 | 0.732 | 1.312 | 0.593 | 0.312 | 0.215 | 0.222 | 0.414 | 0.815 | 1.555 |
| TrajAR | 0.437 | 0.223 | 0.133 | 0.206 | 0.324 | 0.587 | 1.029 | 0.493 | 0.271 | 0.185 | 0.185 | 0.331 | 0.692 | 1.284 |
| Imp.(∆%) | 19.6% | 13.0% | 17.2% | 17.4% | 20.0% | 22.3% | 15.5% | 16.0% | 15.1% | 16.2% | 19.4% | 18.4% | 14.0% | 10.6% |
| TrajAR Encoder | TrajAR Decoder | SinD-Tianjin | SinD-Xian | ||||
|---|---|---|---|---|---|---|---|
| Motion MoE | GAT & ESA | Fully Connection | ADE | FDE | ADE | FDE | |
| × | × | ✓ | ✓ | 1.231 | 2.542 | 1.423 | 2.782 |
| × | ✓ | × | ✓ | 0.892 | 1.642 | 1.023 | 2.122 |
| ✓ | × | × | ✓ | 0.882 | 1.621 | 0.929 | 1.837 |
| ✓ | ✓ | × | × | 1.623 | 3.241 | 1.892 | 3.912 |
| ✓ | ✓ | × | ✓ | 0.409 | 0.798 | 0.509 | 0.942 |
Probabilistic & Safety Performance We further evaluate probabilistic and safety performance by comparing TrajAR with KI-GAN on four datasets using minADE, Negative LogLikelihood NLL, and Collision Rate as shown in Tab. 4. Despite using a deterministic RMSE objective, TrajAR consistently outperforms KI-GAN across all metrics.
| Dataset | Model | minADE ↓ | NLL ↓ | Collision ↓ |
|---|---|---|---|---|
| SinD-Tianjin | KI-GAN TrajAR | 0.451 0.392 | 1.2345 1.0987 | 0.04567 0.01982 |
| SinD-Xian | KI-GAN TrajAR | 0.487 0.421 | 1.5432 1.2876 | 0.05123 0.01651 |
| InD-Bendplatz | KI-GAN TrajAR | 0.432 0.378 | 1.3210 1.1894 | 0.03891 0.00912 |
| InD-Frankenburg | KI-GAN TrajAR | 0.469 0.407 | 1.4123 1.2765 | 0.04218 0.01765 |

Statistical Analysis We run each method with 5 random seeds and report the mean ± standard deviation. Statistical significance is evaluated using a paired t-test comparing TrajAR with the strongest baseline KI-GAN on the primary metrics. This paired setting ensures that the observed performance differences are attributed to the modeling capability rather than random initialization or data variance. The results shown in Tab. 5 demonstrate that the improvements of TrajAR are consistent and statistically significant.
| Dataset | Metric | KI-GAN | TrajAR |
|---|---|---|---|
| SinD-Tianjin | ADE FDE | 0.495 ± 0.021 0.945 ± 0.045 | 0.409 ± 0.015 0.798 ± 0.032 |
| SinD-Xian | ADE FDE | 0.666 ± 0.028 1.245 ± 0.061 | 0.509 ± 0.019 0.942 ± 0.041 |
Per-type and Scenario-based Evaluation To address the diversity of road users and traffic scenarios, we extend our evaluation in two aspects. We first perform a per-category analysis on the SinD dataset, including vehicles, bicycles, and pedestrians. As shown in Tab. 6, TrajAR achieves consistently strong performance across all categories. We further evaluate performance under different traffic conditions by splitting the test set into Off-Peak and Peak periods. While all methods degrade in Peak traffic, TrajAR exhibits a substantially smaller performance drop than KI-GAN, demonstrating stronger robustness in dense and highly interactive scenarios.
Efficiency Analysis As shown in Fig. 3(a), TrajAR achieves an optimal accuracy-efficiency trade-off, delivering the highest prediction accuracy with under 100 ms latency. Its lightweight design ensures minimal computational cost, enabling stable, real-time industrial deployment on resource-constrained platforms with reduced overhead.
| Road User Type | Model | Off-Peak | Peak | Drop (%) |
|---|---|---|---|---|
| Vehicles | KI-GAN TrajAR | 0.310 0.295 | 0.395 0.320 | +27.4 +8.5 |
| Bicycles | KI-GAN TrajAR | 0.650 0.610 | 0.850 0.680 | +30.8 +11.5 |
| Pedestrians | KI-GAN TrajAR | 0.420 0.405 | 0.540 0.435 | +28.6 +7.4 |
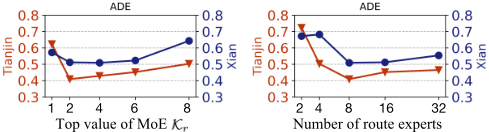
Expert Routing Analysis We analyze MoE expert effectiveness. Fig. 3(b) shows distinct route expert loads for different motion trends, confirming routing specialization. Fig. 3(c) demonstrates that ablating user types, signals, or shuffling expert routes degrades performance; shuffling causes the most severe drop, highlighting the route expert's necessity. Finally, Fig. 4 confirms optimal ADE is achieved using 8 experts with top-Kr routing.
Interpolation Analysis As shown in Tab. 7, cubic interpolation outperforms other methods by generating smooth, oscillation-free trajectories. Unlike linear interpolation (which degrades for fast agents) and Lagrange (prone to Runge effects), cubic interpolation offers the optimal stability-accuracy balance, enhancing long-horizon autoregressive prediction.
| Method | Cubic | Linear | Lagrange | None | ||||
|---|---|---|---|---|---|---|---|---|
| Cat. / Metrics | ADE | FDE | ADE | FDE | ADE | FDE | ADE | FDE |
| Vehicles | 0.303 | 0.564 | 1.321 | 2.212 | 0.321 | 0.604 | 0.412 | 0.712 |
| Bicycles | 0.613 | 1.171 | 1.324 | 2.982 | 1.234 | 2.312 | 0.732 | 1.342 |
| Pedestrians | 0.408 | 0.701 | 0.421 | 0.732 | 1.723 | 3.345 | 0.512 | 1.134 |
6 Conclusion
We propose TrajAR, a lightweight, multi-scale autoregressive framework that mitigates error accumulation for real-time multi-agent trajectory prediction in urban intersections. Future work will explore probabilistic multimodal prediction and broader urban generalization.
Ethical Statement
There are no ethical issues.
Acknowledgements
This work was supported by the National Natural Science Foundation of China (No. 62272033).
Contribution Statement
The authors Letian Gong and Yan Lin contributed equally to this work and share co-first authorship.
@inproceedings{ijcai2026p293,
  title     = {TrajAR: Long-Term Trajectory Prediction at Urban Intersections via Multi-scale Interaction Perception},
  author    = {Gong, Letian and Lin, Yan and Zhang, Xinyue and Shuang, Yiwei and Yao, Guanyu and Long, Cheng and Guo, Shengnan and Lin, Youfang and Wan, Huaiyu},
  booktitle = {Proceedings of the Thirty-Fifth International Joint Conference on
               Artificial Intelligence, {IJCAI-26}},
  publisher = {International Joint Conferences on Artificial Intelligence Organization},
  editor    = {Diego Calvanese},
  pages     = {2635--2643},
  year      = {2026},
  month     = {8},
  note      = {Main Track},
  doi       = {10.24963/ijcai.2026/293},
  url       = {https://doi.org/10.24963/ijcai.2026/293},
}
TY - CPAPER TI - TrajAR: Long-Term Trajectory Prediction at Urban Intersections via Multi-scale Interaction Perception AU - Gong, Letian AU - Lin, Yan AU - Zhang, Xinyue AU - Shuang, Yiwei AU - Yao, Guanyu AU - Long, Cheng AU - Guo, Shengnan AU - Lin, Youfang AU - Wan, Huaiyu T2 - Proceedings of the Thirty-Fifth International Joint Conference on Artificial Intelligence, IJCAI-26 PB - International Joint Conferences on Artificial Intelligence Organization PY - 2026 SP - 2635 EP - 2643 DO - 10.24963/ijcai.2026/293 UR - https://doi.org/10.24963/ijcai.2026/293 ER -Copied
Machine-readable versions of this paper, for tools and AI agents:





