
Spot-Adaptive Structural Rectification for Spatially Resolved Transcriptomics Data Clustering
Proceedings of the Thirty-Fifth International Joint Conference on Artificial Intelligence. Main Track. Pages 5369-5377.
https://doi.org/10.24963/ijcai.2026/598
Keywords
- Machine Learning: Clustering
- Computer Vision: Representation learning
- Machine Learning: Feature extraction, selection and dimensionality reduction
Abstract
Spatially resolved transcriptomics integrates gene expression with spatial coordinates to decode tissue microenvironments. Existing methods predominantly utilize graph structures to model relationships between spots. However, their performance is bottlenecked by the reliability of gene feature graph, facing the following hurdles: (1) ubiquitous housekeeping genes cause high-expression spots to densely connect with heterogeneous spots, leading to a skewed graph structure; (2) information reduction during Highly Variable Gene (HVG) selection results in the loss of intrinsic local structures. To address these challenges, we propose a Spot-Adaptive Structural Rectification method, called SASR. Specifically, SASR employs a hyperspherical expansion constraint that projects gene expression profiles onto a unit hypersphere to maximize angular distances, effectively separating spots falsely clustered by high total counts. Simultaneously, a topological consistency constraint repairs structural fractures caused by HVG selection via aligning latent embeddings with the local structures of the raw full-gene space. The complementary synergy balances angular discriminability with topological fidelity for accurate clustering. Experiments demonstrate that SASR effectively corrects structural biases and surpasses state-of-the-art methods in spatial clustering.
- [Chen et al., 2020] Wei-Ting Chen, Ashley Lu, Katleen Craessaerts, Benjamin Pavie, Carlo Sala Frigerio, Nikky Corthout, Xiaoyan Qian, Jana Laláková, Malte Kühnemund, Iryna Voytyuk, et al. Spatial transcriptomics and in situ sequencing to study alzheimer's disease. Cell, 182(4):976-991, 2020.
- [Cui et al., 2025] Yaxuan Cui, Yang Cui, Ruheng Wang, Zheyong Zhu, Xin Zeng, Kenta Nakai, Feifei Cui, Zilong Zhang, Hua Shi, Yan Chen, et al. Diffusionst: a deep gen- erative diffusion model-based framework for enhancing spatial transcriptomics data quality and identifying spa- tial domains. Briefings in Bioinformatics, 26(4):bbaf390, 2025.
- [Deng et al., 2025a] Shanghui Deng, Xiao Zheng, Chang Tang, Xinwang Liu, Yuanyuan Liu, and Shan An. scspaf: Cell similarity purified adaptive fusion network for single- cell multi-omics clustering. IEEE Transactions on Com- putational Biology and Bioinformatics, 2025.
- [Deng et al., 2025b] Shanghui Deng, Xiao Zheng, Chang Tang, Kun Sun, Yuanyuan Liu, and Xinwang Liu. Find true collaborators: Banzhaf index-based cross view align- ment for partially view-aligned clustering. In Proceedings of the 33rd ACM International Conference on Multimedia, pages 2447-2456, 2025.
- [Dong and Zhang, 2022] Kangning Dong and Shihua Zhang. Deciphering spatial domains from spatially resolved tran- scriptomics with an adaptive graph attention auto-encoder. Nature communications, 13(1):1739, 2022.
- [Eraslan et al., 2019] Gökcen Eraslan, Lukas M Simon, Maria Mircea, Nikola S Mueller, and Fabian J Theis. Single-cell rna-seq denoising using a deep count autoen- coder. Nature communications, 10(1):390, 2019.
- [Gao et al., 2025] Qi Gao, Shasha Yuan, Shengjun Li, and Juan Wang. Integrating modularity maximization and con- trastive learning for identifying spatial domain from spa- tial transcriptomics. Expert Systems with Applications, page 129426, 2025.
- [Hershey and Olsen, 2007] John R Hershey and Peder A Olsen. Approximating the kullback leibler divergence between gaussian mixture models. In 2007 IEEE In- ternational Conference on Acoustics, Speech and Signal Processing-ICASSP'07, volume 4, pages IV-317. IEEE, 2007.
- [Hu et al., 2021] Jian Hu, Xiangjie Li, Kyle Coleman, Amelia Schroeder, Nan Ma, David J Irwin, Edward B Lee, Russell T Shinohara, and Mingyao Li. Spagcn: Integrating gene expression, spatial location and histology to identify spatial domains and spatially variable genes by graph con- volutional network. Nature methods, 18(11):1342-1351, 2021.
- [Ioffe and Szegedy, 2015] Sergey Ioffe and Christian Szegedy. Batch normalization: Accelerating deep net- work training by reducing internal covariate shift. In International conference on machine learning, pages 448-456. pmlr, 2015.
- [Khan et al., 2024] Shawez Khan, Jong Joo Kim, et al. Spa- tial transcriptomics data and analytical methods: an up- dated perspective. Drug Discovery Today, 29(3):103889, 2024.
- [Li et al., 2022] Jiachen Li, Siheng Chen, Xiaoyong Pan, Ye Yuan, and Hong-Bin Shen. Cell clustering for spatial transcriptomics data with graph neural networks. Nature Computational Science, 2(6):399-408, 2022.
- [Liao et al., 2021] Jie Liao, Xiaoyan Lu, Xin Shao, Ling Zhu, and Xiaohui Fan. Uncovering an organ's molecular architecture at single-cell resolution by spatially resolved transcriptomics. Trends in biotechnology, 39(1):43-58, 2021.
- [Liu et al., 2023] Teng Liu, Zhao-Yu Fang, Xin Li, Li-Ning Zhang, Dong-Sheng Cao, and Ming-Zhu Yin. Graph deep learning enabled spatial domains identification for spatial transcriptomics. Briefings in Bioinformatics, 24(3):bbad146, 2023.
- [Liu et al., 2024] Teng Liu, Zhao-Yu Fang, Zongbo Zhang, Yongxiang Yu, Min Li, and Ming-Zhu Yin. A comprehen- sive overview of graph neural network-based approaches to clustering for spatial transcriptomics. Computational and Structural Biotechnology Journal, 23:106-128, 2024.
- [Long et al., 2023] Yahui Long, Kok Siong Ang, Mengwei Li, Kian Long Kelvin Chong, Raman Sethi, Chengwei Zhong, Hang Xu, Zhiwei Ong, Karishma Sachaphibulkij, Ao Chen, et al. Spatially informed clustering, integration, and deconvolution of spatial transcriptomics with graphst. Nature Communications, 14(1):1155, 2023.
- [Maynard et al., 2021] Kristen R Maynard, Leonardo Collado-Torres, Lukas M Weber, Cedric Uytingco, Bri- anna K Barry, Stephen R Williams, Joseph L Catallini, Matthew N Tran, Zachary Besich, Madhavi Tippani, et al. Transcriptome-scale spatial gene expression in the human dorsolateral prefrontal cortex. Nature neuroscience, 24(3):425-436, 2021.
- [Meilȃ, 2007] Marina Meilȃ. Comparing clusterings-an in- formation based distance. Journal of multivariate analysis, 98(5):873-895, 2007.
- [Pham et al., 2023] Duy Pham, Xiao Tan, Brad Balderson, Jun Xu, Laura F Grice, Sohye Yoon, Emily F Willis, Minh Tran, Pui Yeng Lam, Arti Raghubar, et al. Robust map- ping of spatiotemporal trajectories and cell-cell interac- tions in healthy and diseased tissues. Nature communica- tions, 14(1):7739, 2023.
- [Radovanović et al., 2009] Miloš Radovanović, Alexandros Nanopoulos, and Mirjana Ivanović. Nearest neighbors in high-dimensional data: The emergence and influence of hubs. In Proceedings of the 26th Annual International Conference on Machine Learning, pages 865-872, 2009.
- [Radovanovic et al., 2010] Milos Radovanovic, Alexandros Nanopoulos, and Mirjana Ivanovic. Hubs in space: Popu- lar nearest neighbors in high-dimensional data. Journal of Machine Learning Research, 11(sept):2487-2531, 2010.
- [Rodriques et al., 2019] Samuel G Rodriques, Robert R Stickels, Aleksandrina Goeva, Carly A Martin, Evan Mur- ray, Charles R Vanderburg, Joshua Welch, Linlin M Chen, Fei Chen, and Evan Z Macosko. Slide-seq: A scalable technology for measuring genome-wide expression at high spatial resolution. Science, 363(6434):1463-1467, 2019.
- [Schmidhuber, 2015] Jürgen Schmidhuber. Deep learning in neural networks: An overview. Neural networks, 61:85- 117, 2015.
- [Ståhl et al., 2016] Patrik L Ståhl, Fredrik Salmén, Sanja Vickovic, Anna Lundmark, José Fernández Navarro, Jens Magnusson, Stefania Giacomello, Michaela Asp, Jakub O Westholm, Mikael Huss, et al. Visualization and analysis of gene expression in tissue sections by spatial transcrip- tomics. Science, 353(6294):78-82, 2016.
- [Trosten et al., 2023] Daniel J Trosten, Rwiddhi Chakraborty, Sigurd Løkse, Kristoffer Knutsen Wick- strøm, Robert Jenssen, and Michael C Kampffmeyer. Hubs and hyperspheres: Reducing hubness and improv- ing transductive few-shot learning with hyperspherical embeddings. In Proceedings of the IEEE/CVF confer- ence on computer vision and pattern recognition, pages 7527-7536, 2023.
- [Wang et al., 2023] Bo Wang, Jiawei Luo, Ying Liu, Wan- wan Shi, Zehao Xiong, Cong Shen, and Yahui Long. Spatial-mgcn: a novel multi-view graph convolutional net- work for identifying spatial domains with attention mech- anism. Briefings in Bioinformatics, 24(5):bbad262, 2023.
- [Williams et al., 2022] Cameron G Williams, Hyun Jae Lee, Takahiro Asatsuma, Roser Vento-Tormo, and Ashraful Haque. An introduction to spatial transcriptomics for biomedical research. Genome medicine, 14(1):68, 2022.
- [Xiao et al., 2025a] Yuang Xiao, Chang Tang, Xiao Zheng, Weiqing Yan, Yuanyuan Liu, and Xinwang Liu. Mu- tual calibration network for multi-view clustering. IEEE Transactions on Circuits and Systems for Video Technol- ogy, 2025.
- [Xiao et al., 2025b] Yuang Xiao, Dong Yang, Jiaxin Li, Xin Zou, Hua Zhou, and Chang Tang. Dual alignment fea- ture embedding network for multi-omics data clustering. Knowledge-Based Systems, 309:112774, 2025.
- [Xiao et al., 2025c] Yuang Xiao, Yanran Zhu, Chang Tang, Xiao Zheng, Yuanyuan Liu, Kun Sun, and Xinwang Liu. Spatially resolved transcriptomics data clustering with tai- lored spatial-scale modulation. In Proceedings of the Thirty-Fourth International Joint Conference on Artificial Intelligence, pages 6669-6677, 2025. IJCAI
- [Xu et al., 2022] Chang Xu, Xiyun Jin, Songren Wei, Ping- ping Wang, Meng Luo, Zhaochun Xu, Wenyi Yang, Yi- deng Cai, Lixing Xiao, Xiaoyu Lin, et al. Deepst: identi- fying spatial domains in spatial transcriptomics by deep learning. Nucleic Acids Research, 50(22):e131-e131, 2022.
- [Xu et al., 2024] Hang Xu, Huazhu Fu, Yahui Long, Kok Siong Ang, Raman Sethi, Kelvin Chong, Meng- wei Li, Rom Uddamvathanak, Hong Kai Lee, Jingjing Ling, et al. Unsupervised spatially embedded deep rep- resentation of spatial transcriptomics. Genome Medicine, 16(1):12, 2024.
- [Yang et al., 2025] Yitao Yang, Yang Cui, Xin Zeng, Yubo Zhang, Martin Loza, Sung-Joon Park, and Kenta Nakai. Staig: Spatial transcriptomics analysis via image-aided graph contrastive learning for domain exploration and alignment-free integration. Nature Communications, 16(1):1067, 2025.
- [Yu et al., 2025] Zhuohan Yu, Yuning Yang, Xingjian Chen, Ka-Chun Wong, Zhaolei Zhang, Yuming Zhao, and Xi- angtao Li. Accurate spatial heterogeneity dissection and gene regulation interpretation for spatial transcriptomics using dual graph contrastive learning. Advanced Science, 12(3):2410081, 2025.
- [Zhai et al., 2023] Yuyao Zhai, Liang Chen, and Minghua Deng. Realistic cell type annotation and discovery for single-cell rna-seq data. In IJCAI, pages 4967-4974, 2023. IJCAI
- [Zhang et al., 2024] Daoliang Zhang, Na Yu, Zhiyuan Yuan, Wenrui Li, Xue Sun, Qi Zou, Xiangyu Li, Zhiping Liu, Wei Zhang, and Rui Gao. stmmr: accurate and robust spatial domain identification from spatially resolved tran- scriptomics with multimodal feature representation. Giga- Science, 13:giae089, 2024.
- [Zhu et al., 2024] Yanran Zhu, Xiao He, Chang Tang, Xin- wang Liu, Yuanyuan Liu, and Kunlun He. Multi-view adaptive fusion network for spatially resolved transcrip- tomics data clustering. IEEE Transactions on Knowledge and Data Engineering, 2024.
- [Zhu et al., 2025a] Jun Zhu, Yifu Li, Zhenchao Tang, and Cheng Chang. Dusted: Dual-attention enhanced spatial transcriptomics denoiser. In Proceedings of the AAAI Con- ference on Artificial Intelligence, volume 39, pages 1219- 1227, 2025.
- [Zhu et al., 2025b] Yanran Zhu, Xiao Zheng, Xiao He, Xin Zou, Peihong Wang, Chang Tang, Xinwang Liu, and Kunlun He. Bmcst: Balanced multi-view clustering for spatially resolved transcriptomics with mamba-driven dynamic feature refinement. Information Fusion, page 103425, 2025.
- [Ziegenhain et al., 2017] Christoph Ziegenhain, Beate Vieth, Swati Parekh, Björn Reinius, Amy Guillaumet-Adkins, Martha Smets, Heinrich Leonhardt, Holger Heyn, Ines Hellmann, and Wolfgang Enard. Comparative analysis of single-cell rna sequencing methods. Molecular cell, 65(4):631-643, 2017.
References were extracted automatically from the PDF and may contain errors.
Full text extracted automatically from the PDF; figures, tables and equations may differ. The PDF is the version of record.
1 Introduction
Spatially Resolved Transcriptomics (SRT) is a transformative approach that integrates gene expression with spatial coordinates to decipher tissue architecture [St˚ahl et al., 2016; Williams et al., 2022]. While single-cell RNA sequencing excels at exploring tissue heterogeneity [Ziegenhain et al., 2017; Zhai et al., 2023], its dissociation process results in the loss of positional information and obscures cell-cell interactions [Liao et al., 2021]. To overcome this limitation, spatially resolved technologies such as Slide-seq [Rodriques et al., 2019] analyze transcriptomes. These advancements not only enable the reconstruction of molecular landscapes but also allow for the precise identification of coordinated cellular responses in complex pathological conditions like neurodegenerative diseases [Chen et al., 2020].
∗Corresponding author.
To effectively tackle the high-dimensional complexity of SRT data, the scientific community has shifted from traditional statistics to advanced artificial intelligence, especially deep learning [Khan et al., 2024; Zhai et al., 2023]. Graph Neural Network(GNN) is a predominant framework for modeling intricate relationships between tissue spots [Liu et al., 2024]. GNN constructs a graph where nodes and edges (spatial proximity) leverage gene expression, spatial coordinates, and histological images to identify spatial domains. By integrating spatial context, these graph-based frameworks facilitate precise unsupervised cell clustering and the discovery of functional subtypes [Li et al., 2022].
The reliability of gene feature graph construction serves as a critical bottleneck for GNN in integrating spatial information with gene expression data. Generally, existing methods primarily rely on selecting Highly Variable Gene (HVG) to construct node features [Long et al., 2023; Zhang et al., 2024]. Some approaches further augment gene expression matrices [Xu et al., 2022] or fuse multi-modal information with spatial structures [Dong and Zhang, 2022] to improve gene graph representation.
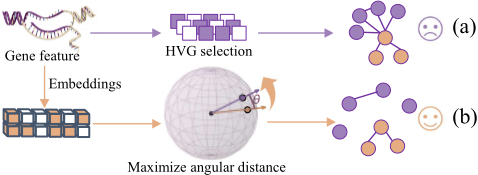
However, these methods encounter the following predicaments: (1) The pervasive influence of housekeeping genes leads to overly dense and distorted connections between high-
(a) Skewness Comparison
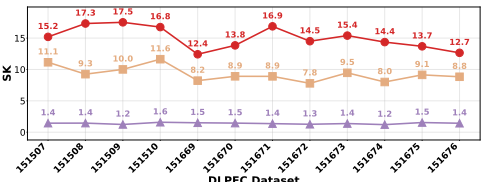
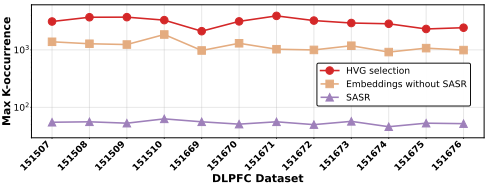
expression spots and heterogeneous spots, inducing graph structural skewness, as illustrated in Fig. 1(a). Adopting normalization and scaling pre-processing after HVG selection cannot alleviate this impact. These procedures merely alter the magnitude but do not resolve the dominant source of the vector's direction. (2) Inevitable information loss during HVG selection and other dimensionality reduction methods can degrade the intrinsic local structure of gene expression data. This reduction in the quantity of information may disrupt the inherent pairwise relationships between spots, further diminishing the expressive power of the graph. As evidenced by the significantly high SK values[Radovanovi´c et al., 2009] in Fig. 2(a), the graph structure constructed via HVG selection exhibits severe skewness. Furthermore, Fig. 2(b) reveals that some spots become neighbors to thousands of others, indicating that the graph structural skewness arises because multitudes of other spots are aggregated towards these high-expression spots, thereby disrupting a reasonable graph topology[Radovanovic et al., 2010].
To address these challenges, we propose a novel SpotAdaptive Structural Rectification method, called SASR, specifically designed to construct a reliable gene feature graph by learning rectified embeddings. SASR employs a two-pronged approach leveraging complementary constraints. As illustrated in Fig. 1(b), the hyperspherical expansion constraint projects gene expression profiles onto a unit hypersphere, normalizing feature vectors to unit length so that discriminability depends solely on directional patterns. By explicitly maximizing inter-spot angular distances, this mechanism forces the dispersion of falsely aggregated spots, effectively disentangling spots that are erroneously clustered due to high total counts. Concurrently, the topological consistency constraint rectifies structural fractures introduced by HVG selection. This is achieved by explicitly aligning the low-dimensional latent embeddings with the local structures of the raw full-gene expression space, thereby preserving intrinsic pairwise relationships. These two constraints function in a complementary manner. SASR strikes a balance between maximizing angular discriminability and maintaining topological fidelity. As demonstrated in Fig. 2, the synergistic application of the two constraints leads to a substantial reduction in SK values, indicative of a more accurate and less skewed graph structure.
Our main contributions are summarized as follows:
- To the best of our knowledge, our proposed SASR is the first work to identify and address the issue of graph structure skewness caused by spot aggregation in gene feature graph construction for spatial transcriptomics.
- We employ a hyperspherical expansion constraint to project gene features onto a unit hypersphere, maximizing inter-spot angular distances to disperse falsely aggregated spots. This is complemented by a topological consistency constraint that aligns latent embeddings with the raw full-gene space to repair structural fractures. Crucially, the synergy between these constraints balances angular discriminability with topological fidelity to ensure accurate clustering.
- Extensive experiments on multiple benchmark datasets substantiate the effectiveness of SASR. It significantly outperforms state-of-the-art methods in spatial clustering. These results confirm its capability to rectify structural biases and enhance downstream analysis.
2 RelatedWork
In spatial transcriptomics analysis, the construction of gene feature maps is a critical step that fuses gene expression and spatial information to learn high-quality node representations. While standard workflows typically initiate this process by reducing data dimensionality through filtering highly variable genes and using normalized expression vectors[Zhu et al., 2024; Xiao et al., 2025c], these basic inputs often fail to capture the full complexity of tissue microenvironments. Consequently, recent approaches have sought to generate more informative representations by enhancing the intrinsic feature matrix or employing multi-modal strategies to better resolve cellular heterogeneity. For instance, DeepST[Xu et al., 2022] innovatively fuses gene expression correlation, morphological similarity and spatial distance prior to PCA dimensionality reduction. stMMR[Zhang et al., 2024] utilizes vision transformer and GCN to deeply align gene and image features. Advanced self-supervised and generative models have been introduced to optimize features. SEDR[Xu et al., 2024] employs masked self-supervised learning to derive robust representations. DiffusionST[Cui et al., 2025] utilizes diffusion models to denoise high-dimensional gene vectors reshaped into "pseudo-images". Furthermore, innovations regarding the graph structure itself have emerged. STAGATE[Dong and Zhang, 2022] constructs a "cell-type aware" graph by pruning inter-region connections to preserve tissue boundaries and CCST[Li et al., 2022] introduces a hybrid adjacency matrix combined with graph contrastive learning to refine the final node embeddings.
Beyond representation learning, advanced clustering strategies are essential for identifying distinct spatial domains. STMACL[Gao et al., 2025] introduces a graph selfsupervised framework that combines modularity maximization with contrastive learning. Addressing the specific noise characteristics of spatial data, DUSTED[Zhu et al., 2025a] proposes a dual-attention denoising autoencoder. It utilizes a gene-channel attention module to handle heterogeneous noise levels across genes and a graph attention module to capture spatial dependencies. STAlG[Yang et al., 2025] focuses on multi-modal integration and batch effect correction through a graph contrastive learning framework. Finally, SCGDL[Liu et al., 2023] combines deep graph learning with Bayesian clustering in a dual-layer architecture. It uses deep graph infomax and residual gated GCN for high-level feature embedding, coupled with a Bayesian gaussian mixture model at the lower level to achieve adaptive clustering.
Despite the substantial progress achieved by these feature enhancement and clustering paradigms, current methods face limitations. The phenomenon of point aggregation during graph construction and the loss of local structure during dimensionality reduction can lead to skewed graph structures. This work investigates and aims to mitigate these issues.
3 Methodology
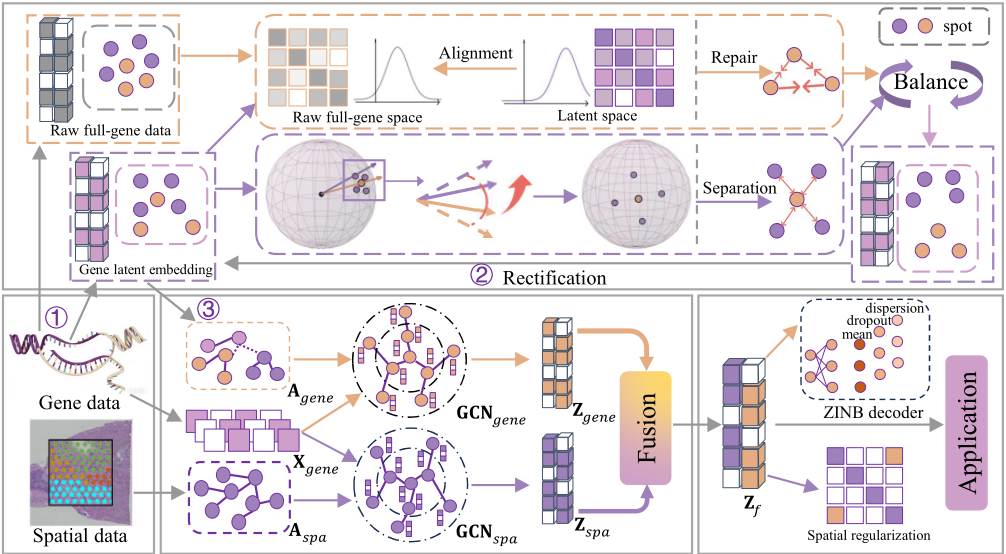
This section begins with the overall framework of the proposed SASR method, as illustrated in Fig. 3. Then, we detail the components of the network, concluding with the mathematical formulation of the optimization objective.
3.1 Overview of SASR
The proposed SASR consists of three main components: (i) spot-adaptive structural rectification for graph construction, (ii) multi-view GCN propagation, and (iii) spatial domain constraints. SRT data are processed to construct a spatial graph and a rectified gene feature graph. The gene feature graph is optimized by the SASR method to correct structural skewness via hyperspherical and topological constraints. Subsequently, the multi-view GCN encodes these graphs to extract and adaptively fuse spatial and transcriptomic features. Finally, the unified representation is optimized under ZINB reconstruction and spatial regularization constraints to ensure high-fidelity clustering.
3.2 Spot-adaptive Structural Rectification
Standard graph construction methods suffer from a skewed graph structure caused by ubiquitous housekeeping genes connecting heterogeneous spots, and a loss of intrinsic local structures due to information reduction during HVG selection. To construct a high-fidelity feature graph for reliable downstream clustering, we propose SASR method. This method learns a rectified embedding Zrec by performing spot-adaptive structural rectification that effectively separates falsely clustered spots while repairing structural fractures.
Modeling Intrinsic Topological Probabilities. To remedy the structural fractures caused by HVG selection, we need to capture the intrinsic pairwise relationships present in the raw full-gene space. Let X ∈ RN×Dfull denote the raw expression profiles of N spots with genes by genes of Dfull dimensions. We model the intrinsic topology as a conditional probability distribution G, where gj|i represents the likelihood of spot j being a "true neighbor" of spot i. Using a gaussian kernel in the high-dimensional raw space:
where σi is an adaptive variance tailored to the local density of spot i. To ensure symmetry, we define the target affinity matrix P with entries, where the elements pij are defined as:
This distribution P serves as the ground truth for topological fidelity, preserving the fine-grained local structures that are often lost during standard dimensionality reduction.
Hyperspherical Rectified Embedding. To address the skewed graph structure caused, we design a parametric mapping function fθ : X → Zrec, where Zrec ∈ RN×d denotes the rectified latent embedding. Significantly, we enforce a strict unit hypersphere constraint to eliminate magnitude bias. The rectified representation zrec,i for spot i is defined as:
On this unit hypersphere, the similarity between spots is determined solely by angular alignment, effectively filtering out the influence of total counts[Trosten et al., 2023].We construct the rectified latent distribution Q, where the elements qij are defined using an exponential kernel to represent the matching probability:
where τ is a temperature parameter controlling the sharpness of the distribution.
To construct a high-fidelity feature graph, we aim to align the latent distribution Q with the intrinsic topology P by minimizing the Kullback-Leibler divergence[Hershey and Olsen, 2007]. We decompose this optimization into two synergistic components that work in complementary directions.
Hyperspherical Expansion Constraint. To separate spots falsely clustered by high total counts, we employ the hyperspherical expansion constraint (Lexp). This term serves as a repulsive force by minimizing the log-partition function. Geometrically, it explicitly maximizes inter-spot angular distances, forcing the embeddings to spread uniformly across the hypersphere to correct dense connectivity:
Topological Consistency Constraint. To repair the structural fractures caused by HVG selection, we introduce the topological consistency constraint (Ltopo). This term acts as an attractive force. Maximizing the dot product weighted by the intrinsic probability pij, it explicitly aligns the lowdimensional embeddings with the local structures of the raw full-gene space. This ensures that biologically similar spots remain proximal:
The final objective is a weighted combination of these two constraints, governed by a trade-off coefficient γ ∈ [0, 1]:
Leveraging the Zrec rectified by Lsasr, we construct the gene feature graph Agene using the k-nearest neighbor algorithm. The adjacency matrix is formally defined as:
where Nk(zrec,i) denotes the set of k-nearest neighbors of spot i based on the cosine similarity of their embeddings.
3.3 Multi-viewGCN Propagation
To comprehensively learn latent representations from spatial and transcriptomic perspectives, we employ a multi-view GCN. This architecture consists of two parallel branches that process the normalized gene expression matrix Xgene (containing the top-3000 HVGs) as node features, utilizing distinct graph structures to capture complementary information.
We formulate a spatial proximity graph, denoted by the adjacency matrix Aspa ∈ {0, 1}N×N , leveraging the available physical coordinates S. A connection is established between two distinct spots, i and j, provided that their Euclidean distance falls within a fixed radius threshold r. Mathematically, the adjacency matrix is defined as:
With both the spatial graph Aspa and gene feature graph Agene established, the propagation rule for a GCN layer is given by:
where ˜A=A+I is the adjacency matrix with self-loops, ˜D is the corresponding degree matrix, H(l) is the feature matrix at layer l (with H(0) = Xgene), W(l) is a trainable weight matrix, and σ is a non-linear activation function. The two branches generate view-specific embeddings as follows:
where GCNspa and GCNgene are multi-layer GCNs with separate parameters.
The fused representation Zf ∈ RN×d is obtained by adaptively integrating the outputs of the two branches:
where Fusion(·) function represents an attention-based adaptive integration.
We concatenate the view-specific embeddings to learn importance weights via an MLP, which are L2-normalized and applied element-wise to rescale the features[Schmidhuber, 2015; Ioffe and Szegedy, 2015]. The re-weighted embeddings are finally concatenated and projected to generate the unified representation[Deng et al., 2025a; Xiao et al., 2025b].
3.4 Spatial Domain Constraints
To capture the global probability distribution of gene expression and preserve spatial neighbor coherence in the final embedding, we introduce two critical constraints applied to the fused representation Zf .
ZINB Loss. Considering the high sparsity and overdispersion inherent in ST data, we utilize a ZINB decoder to reconstruct the raw expression matrix X[Eraslan et al., 2019]. The decoder maps Zf to estimate three parameters of the ZINB distribution for each spot i and gene j: the mean µ, dispersion θ, and dropout probability π. The reconstruction loss is defined as the negative log-likelihood:
Spatial Regularization Loss. To ensure that the learned embeddings respect the physical tissue structure, we impose a spatial regularization constraint[Hu et al., 2021]. This loss encourages spatially adjacent spots to have similar representations while pushing non-neighbors apart in the latent space Zf . It is formulated as:
where Ni denotes the set of spatial neighbors for spot i, and σ(·) is the sigmoid function. This constraint prevents the model from learning spatially incoherent patterns, thereby enhancing the smoothness of the identified domains.
3.5 Total Loss Function
The overall objective function is formulated as:
where α and β are hyperparameters that control the contribution of the ZINB reconstruction loss and the spatial regularization constraint[Deng et al., 2025b].
By minimizing L, our model simultaneously learns biologically meaningful representations while preserving spatial coherence and correcting structural biases.
| Metrics | Methods | 151669 | 151670 | 151671 | 151672 | 151673 | 151674 | 151675 | 151676 | HBC | MBA |
|---|---|---|---|---|---|---|---|---|---|---|---|
| ARI | DeepST[NAS'22] Spatial-MGCN[BIB'23] stLearn[Nat. Com.'23] stMMR[GigaSci'24] | 45.44 | 36.48 | 51.61 | 48.52 | 50.68 | 54.68 | 52.31 | 56.83 | 53.13 | 25.63 |
| 39.04 | 35.05 | 60.15 | 77.35 | 60.42 | 59.61 | 54.48 | 57.48 | 64.32 | 42.46 | ||
| 32.24 | 22.79 | 35.69 | 34.02 | 30.31 | 38.04 | 38.03 | 39.62 | 55.26 | 38.42 | ||
| 42.45 | 37.41 | 54.82 | 57.50 | 62.18 | 50.71 | 55.69 | 57.49 | 65.65 | 47.26 | ||
| MAFN[TKDE'24] | 59.54 | 48.34 | 83.26 | 77.14 | 57.34 | 48.95 | 49.88 | 54.32 | 61.88 | 43.58 | |
| stDCL[Adv. Sci.'25] | 57.00 | 44.74 | 66.74 | 69.82 | 61.81 | 48.05 | 57.60 | 57.49 | 55.73 | 42.05 | |
| BMCST[Inf. Fus.'25] | 61.36 | 60.20 | 82.94 | 78.39 | 63.80 | 54.46 | 57.61 | 58.30 | 67.98 | 48.34 | |
| SASR(ours) | 65.59 | 60.95 | 86.46 | 80.54 | 62.65 | 61.31 | 60.21 | 59.82 | 68.65 | 53.51 | |
| NMI | DeepST[NAS'22]] Spatial-MGCN[BIB'23] stLearn[Nat. Com.'23] stMMR[GigaSci'24] MAFN[TKDE'24] | 52.89 | 52.33 | 64.28 | 61.53 | 67.16 | 69.75 | 64.13 | 70.69 | 68.75 | 56.71 |
| 58.51 | 55.62 | 72.24 | 75.18 | 67.55 | 69.34 | 66.57 | 66.99 | 69.11 | 71.13 | ||
| 49.18 | 40.63 | 54.44 | 47.37 | 49.47 | 54.38 | 55.62 | 56.21 | 62.64 | 65.52 | ||
| 53.59 | 49.15 | 66.56 | 68.27 | 69.18 | 60.89 | 64.55 | 68.13 | 69.65 | 68.16 | ||
| 64.35 | 60.82 | 79.15 | 78.52 | 65.91 | 61.95 | 64.45 | 67.44 | 69.32 | 72.76 | ||
| stDCL[Adv. Sci.'25] | 63.11 | 58.68 | 73.91 | 72.96 | 70.20 | 65.11 | 67.11 | 66.20 | 67.80 | 70.75 | |
| BMCST[Inf. Fus.'25] | 70.58 | 63.61 | 78.84 | 79.40 | 69.23 | 65.48 | 67.44 | 68.74 | 71.83 | 70.96 | |
| SASR(ours) | 71.58 | 65.51 | 79.50 | 81.70 | 67.33 | 70.40 | 68.70 | 66.61 | 69.80 | 72.89 |
4 Experiment
4.1 Experimental Settings
Datasets. We evaluate our method on ten benchmark spatial transcriptomics datasets generated by the 10x Genomics Visium platform. These include the human breast cancer (HBC) dataset, which encompasses 20 regions and 36,601 genes, and the mouse brain anterior (MBA) tissue, containing 32,285 genes annotated with 52 distinct regions. Additionally, we utilize eight slices from the human dorsolateral prefrontal cortex (DLPFC, 151669-151676)[Maynard et al., 2021]. These slices feature manual annotations of six cortical layers and white matter. Specifically, slices 151669-151672 consist of five annotated regions, while the remaining slices are divided into seven regions.
Competing Methods. We evaluate the efficacy of our model against seven competitive baselines, namely DeepST[Xu et al., 2022], Spatial-MGCN[Wang et al., 2023], stLearn[Pham et al., 2023], stMMR[Zhang et al., 2024], MAFN[Zhu et al., 2024], stDCL[Yu et al., 2025] and BMCST[Zhu et al., 2025b]. All comparative experiments were performed using the default hyperparameters.
Training Details and Metrics. We implemented SASR using PyTorch on a single NVIDIA GeForce RTX 3090 GPU. Prior to training, we followed standard quality control with SCANPY to filter low-quality spots and retained the top 3,000 highly variable genes (HVGs) after scaling normalization. These processed HVGs serve as the node feature input for the multi-view GCN, while the gene feature graph is constructed using the rectified embeddings learned by SASR. The model was trained using the Adam optimizer with an initial learning rate of 0.001 and a weight decay of 5 × 10⁻⁴ . The training process spanned at least 150 iterations to ensure convergence. To quantitatively evaluate clustering performance, we employed the Adjusted Rand Index (ARI)[Meil˘a, 2007] and Normalized Mutual Information (NMI)[Xiao et al., 2025a], multiplying all scores by 100 for presentation.
4.2 Comparison Analysis
Table 1 presents a comprehensive quantitative evaluation on ten spatial transcriptomics datasets, including eight slices from the DLPFC, the HBC dataset, and the MBA dataset. The benchmarking covers seven state-of-the-art approaches, ranging from established deep graph learning models to recent multi-modal frameworks. Among them, SASR demonstrates robust and consistent superiority. Quantitatively, it achieves the highest ARI scores on 9 out of 10 datasets and secures the top NMI scores on 7 out of 10 datasets. For instance, on the DLPFC slice 151669, SASR outperforms the closest competitor (BMCST) by a significant margin of 4.23 ARI points Similarly, on the complex HBC dataset, which is characterized by intricate tumor boundaries and high noise levels, SASR attains the highest ARI of 68.65%. This validates its capability to accurately dissect heterogeneous tumor microenvironments where standard methods fail. Even when compared to the most recent and competitive methods like stDCL and BMCST, SASR maintains a distinct advantage, highlighting the effectiveness of our spot-adaptive structural rectification strategy in mitigating graph bias and handling diverse tissue architectures.
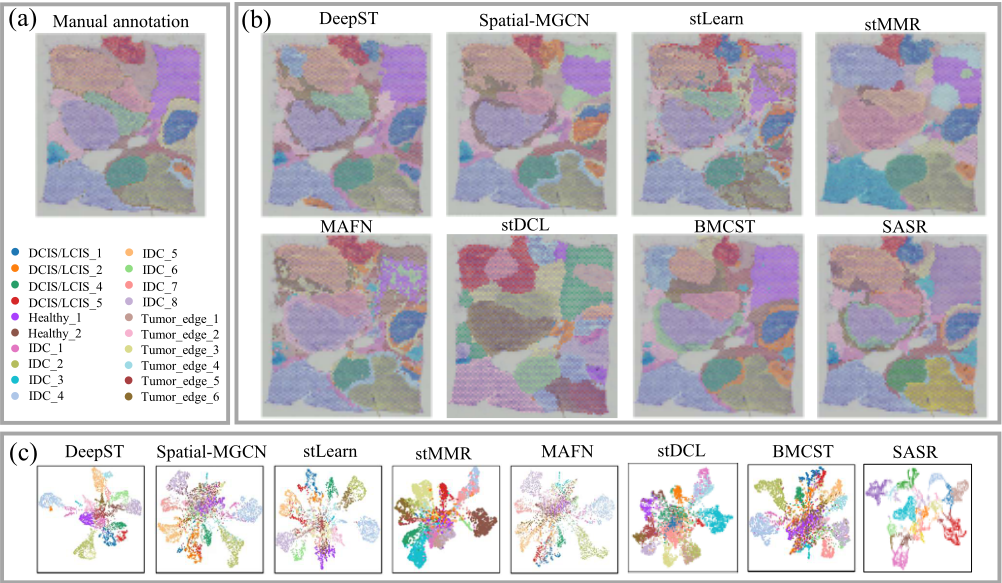
Complementing these quantitative findings, Fig. 4 provides a qualitative visualization of spatial clustering results on the HBC dataset. Fig. 4(a) displays the manually annotated layer structure, serving as the ground truth. As shown in Fig. 4(b), SASR produces more anatomically coherent and biologically meaningful clusters compared to other baselines. Methods like DeepST and stLearn exhibit significant noise and fragmented clusters and fail to capture the continuous tissue structure. In contrast, SASR effectively delineates the boundaries between different tumor regions and healthy tissues. Additionally, the UMAP visualizations in Fig. 4(c) further confirm that the embeddings learned by SASR form well-separated and compact clusters even compared to recent methods like stDCL, demonstrating its ability to effectively capture both functional and structural tissue patterns with superior accuracy and biological consistency.
| Variants | ARI | NMI | ||||||||||||
|---|---|---|---|---|---|---|---|---|---|---|---|---|---|---|
| 151672 | 151673 | 151674 | 151675 | 151676 | HBC | MBA | 151672 | 151673 | 151674 | 151675 | 151676 | HBC | MBA | |
| w/o Lexp | 81.75 | 53.77 | 56.04 | 58.06 | 51.69 | 56.37 | 45.70 | 77.34 | 64.26 | 63.28 | 67.96 | 63.66 | 64.35 | 66.72 |
| w/o Ltopo | 80.29 | 51.79 | 58.00 | 56.95 | 52.99 | 56.54 | 45.68 | 75.74 | 58.63 | 64.20 | 67.43 | 63.91 | 66.86 | 65.97 |
| w/o Lzinb | 78.55 | 49.80 | 49.83 | 51.50 | 50.59 | 57.93 | 46.12 | 74.93 | 64.96 | 62.53 | 64.22 | 61.22 | 61.77 | 67.30 |
| w/o Lreg | 81.92 | 42.68 | 43.20 | 52.43 | 46.14 | 62.49 | 43.67 | 77.60 | 55.62 | 56.74 | 65.03 | 59.65 | 63.58 | 65.29 |
| SASR | 80.54 | 62.65 | 61.31 | 60.21 | 59.82 | 68.65 | 53.51 | 81.70 | 67.33 | 70.40 | 68.70 | 66.61 | 69.80 | 72.89 |
4.3 Ablation Studies
This section presents an ablation study to examine the impact of each component in our SASR model. The ablation experiments are categorized into four sections, and Table 2 shows the ARI and NMI performance across seven datasets.
Effect of Lexp. As shown in Table 2, removing Lexp results in a 17.89% ARI drop on the HBC dataset. This highlights its critical role in maximizing angular distances to separate spots falsely clustered by high total counts, thereby securing the necessary geometric space for accurate clustering.
Effect of Ltopo. The absence of Ltopo leads to a 17.6% ARI drop on HBC. This validates that aligning latent embeddings with the raw full-gene space effectively repairs structural fractures caused by HVG selection, ensuring biologically similar spots remain proximal.
Effect of Lzinb. Removing Lzinb causes an 18.7% ARI drop on slice 151674. This confirms the ZINB decoder's critical role in modeling global expression distributions to effectively mitigate noise caused by sparsity and over-dispersion.
Effect of Lreg. Removing Lreg reduces ARI by 31.8% on slice 151673. This confirms its importance in preserving spatial coherence by bringing spatial neighbors closer in the latent space.
Overall, the full SASR model consistently achieves the highest performance across all datasets and metrics, demonstrating that the synergistic integration of these four components is essential for accurate spatial clustering.
4.4 Parameter Analysis
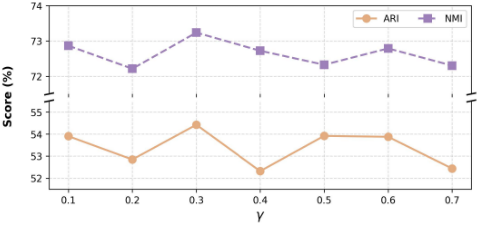
We investigate the sensitivity of the coefficient γ in SASR, balancing the hyperspherical expansion and topological consistency constraints. Fig. 5 illustrates clustering performance
β
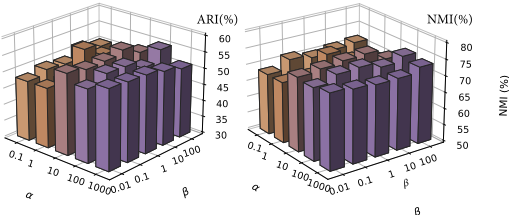
Figure 6: Comparison of ARI and NMI for different α and β combinations on the MBA dataset.
on the MBA dataset as γ increases from 0.1 to 0.7. Results demonstrate consistently robust performance, peaking at γ =0.3. This indicates that a balanced synergy between maximizing angular discriminability and preserving local topology is critical for accurate structural rectification. Consequently, γ =0.3 is adopted as the default.
Building on the internal calibration of SASR, we further evaluate the total loss components. The model adopts a dualhyperparameter architecture, where α and β weigh the contributions of the ZINB reconstruction loss and the spatial regularization loss relative to the core structural rectification loss (Lsasr). Fig. 6 depicts the ARI and NMI performance landscape across different parameter combinations. Experimental results indicate that the model achieves optimal performance when α = 1 and β = 1. This configuration provides the best trade-off between gene expression fidelity and spatial coherence and is adopted as the default.
5 Conclusion
In this paper, we proposed SASR, a method designed to resolve the reliability bottleneck of gene feature graphs in spatial transcriptomics. Compared with existing methods, SASR explicitly addresses the graph structural skewness induced by ubiquitous housekeeping genes and the topological fractures caused by HVG selection. We formulated a spotadaptive structural rectification strategy: the hyperspherical expansion constraint maximizes angular distances to disperse falsely aggregated spots, while the topological consistency constraint aligns latent embeddings with the local structures of the raw full-gene space. This synergy effectively generates a reliable graph topology. Extensive experiments substantiate that SASR significantly outperforms state-of-the-art methods, confirming its capability to rectify structural biases for accurate spatial clustering.
Acknowledgments
The work was supported in part by the National Natural Science Foundation of China under grants 62476258 and 62325604, and in part by the Interdisciplinary Research Program of HUST under grant 2025JCY3024, and in part by the Fundamental Research Funds for National Universities, China University of Geosciences (Wuhan) under grant 2025XLB83.
@inproceedings{ijcai2026p598,
  title     = {Spot-Adaptive Structural Rectification for Spatially Resolved Transcriptomics Data Clustering},
  author    = {Zhao, Huanjia and Deng, Shanghui and Li, Shunfan and Sun, Kun and Yan, Weiqing and Tang, Chang},
  booktitle = {Proceedings of the Thirty-Fifth International Joint Conference on
               Artificial Intelligence, {IJCAI-26}},
  publisher = {International Joint Conferences on Artificial Intelligence Organization},
  editor    = {Diego Calvanese},
  pages     = {5369--5377},
  year      = {2026},
  month     = {8},
  note      = {Main Track},
  doi       = {10.24963/ijcai.2026/598},
  url       = {https://doi.org/10.24963/ijcai.2026/598},
}
TY - CPAPER TI - Spot-Adaptive Structural Rectification for Spatially Resolved Transcriptomics Data Clustering AU - Zhao, Huanjia AU - Deng, Shanghui AU - Li, Shunfan AU - Sun, Kun AU - Yan, Weiqing AU - Tang, Chang T2 - Proceedings of the Thirty-Fifth International Joint Conference on Artificial Intelligence, IJCAI-26 PB - International Joint Conferences on Artificial Intelligence Organization PY - 2026 SP - 5369 EP - 5377 DO - 10.24963/ijcai.2026/598 UR - https://doi.org/10.24963/ijcai.2026/598 ER -Copied
Machine-readable versions of this paper, for tools and AI agents:





