
Realistic Cell Type Annotation and Discovery for Single-cell RNA-seq Data
Proceedings of the Thirty-Second International Joint Conference on Artificial Intelligence. Main Track. Pages 4967-4974.
https://doi.org/10.24963/ijcai.2023/552
Keywords
- Machine Learning: ML: Applications
- Multidisciplinary Topics and Applications: MDA: Bioinformatics
Abstract
The rapid development of single-cell RNA sequencing (scRNA-seq) technologies allows us to explore tissue heterogeneity at the cellular level. Cell type annotation plays an essential role in the substantial downstream analysis of scRNA-seq data. Existing methods usually classify the novel cell types in target data as an “unassigned” group and rarely discover the fine-grained cell type structure among them. Besides, these methods carry risks, such as susceptibility to batch effect between reference and target data, thus further compromising of inherent discrimination of target data. Considering these limitations, here we propose a new and practical task called realistic cell type annotation and discovery for scRNA-seq data. In this task, cells from seen cell types are given class labels, while cells from novel cell types are given cluster labels. To tackle this problem, we propose an end-to-end algorithm framework called scPOT from the perspective of optimal transport (OT). Specifically, we first design an OT-based prototypical representation learning paradigm to encourage both global discriminations of clusters and local consistency of cells to uncover the intrinsic structure of target data. Then we propose an unbalanced OT-based partial alignment strategy with statistical filling to detect the cells from the seen cell types across reference and target data. Notably, scPOT also introduces an easy yet effective solution to automatically estimate the overall cell type number in target data. Extensive results on our carefully designed evaluation benchmarks demonstrate the superiority of scPOT over various state-of-the-art clustering and annotation methods.
- [Brbić et al., 2020] Maria Brbić, Marinka Zitnik, Sheng Wang, Angela O Pisco, Russ B Altman, Spyros Darma- nis, and Jure Leskovec. Mars: discovering novel cell types across heterogeneous single-cell experiments. Na- ture methods, 17(12):1200-1206, 2020.
- [Brent, 2013] Richard P Brent. Algorithms for minimization without derivatives. Courier Corporation, 2013.
- [Cao et al., 2019] Zhi-Jie Cao, Lin Wei, Shen Lu, De-Chang Yang, and Ge Gao. Cell blast: searching large-scale scrna- seq databases via unbiased cell embedding. BioRxiv, page 587360, 2019.
- [Caron et al., 2020] Mathilde Caron, Ishan Misra, Julien Mairal, Priya Goyal, Piotr Bojanowski, and Armand Joulin. Unsupervised learning of visual features by con- trasting cluster assignments. Advances in Neural Informa- tion Processing Systems, 33:9912-9924, 2020.
- [Chen et al., 2020a] Liang Chen, Weinan Wang, Yuyao Zhai, and Minghua Deng. Deep soft k-means clustering with self-training for single-cell rna sequence data. NAR ge- nomics and bioinformatics, 2(2):lqaa039, 2020.
- [Chen et al., 2020b] Liang Chen, Yuyao Zhai, Qiuyan He, Weinan Wang, and Minghua Deng. Integrating deep su- pervised, self-supervised and unsupervised learning for single-cell rna-seq clustering and annotation. Genes, 11(7):792, 2020.
- [Chizat et al., 2018] Lenaic Chizat, Gabriel Peyré, Bernhard Schmitzer, and Franc ¸ois-Xavier Vialard. Scaling algo- rithms for unbalanced optimal transport problems. Math- ematics of Computation, 87(314):2563-2609, 2018.
- [Cuturi, 2013] Marco Cuturi. Sinkhorn distances: Light- speed computation of optimal transport. Advances in neu- ral information processing systems, 26, 2013.
- [Eraslan et al., 2019] Gökcen Eraslan, Lukas M. Simon, Maria Mircea, Nikola S. Mueller, and Fabian J. Theis. Single-cell rna-seq denoising using a deep count autoen- coder. Nature communications, (1):1-14, 2019.
- [He et al., 2020] Kaiming He, Haoqi Fan, Yuxin Wu, Sain- ing Xie, and Ross Girshick. Momentum contrast for unsu- pervised visual representation learning. In Proceedings of the IEEE/CVF conference on computer vision and pattern recognition, pages 9729-9738, 2020.
- [Hu et al., 2020] Jian Hu, Xiangjie Li, Gang Hu, Yafei Lyu, Katalin Susztak, and Mingyao Li. Iterative transfer learn- ing with neural network for clustering and cell type clas- sification in single-cell rna-seq analysis. Nature machine intelligence, 2(10):607-618, 2020.
- [Kimmel and Kelley, 2020] Jacob C Kimmel and David R Kelley. scnym: Semi-supervised adversarial neural net- works for single cell classification. bioRxiv, 2020.
- [Kiselev et al., 2019] Vladimir Yu Kiselev, Tallulah S An- drews, and Martin Hemberg. Challenges in unsupervised clustering of single-cell rna-seq data. Nature Reviews Ge- netics, 20(5):273-282, 2019.
- [Kuhn, 1955] Harold W Kuhn. The hungarian method for the assignment problem. Naval research logistics quarterly, 2(1-2):83-97, 1955.
- [Lähnemann et al., 2020] David Lähnemann, Johannes Köster, Ewa Szczurek, Davis J McCarthy, Stephanie C Hicks, Mark D Robinson, Catalina A Vallejos, Kieran R Campbell, Niko Beerenwinkel, Ahmed Mahfouz, et al. Eleven grand challenges in single-cell data science. Genome biology, 21(1):1-35, 2020.
- [Lakkis et al., 2021] Justin Lakkis, David Wang, Yuanchao Zhang, Gang Hu, Kui Wang, Huize Pan, Lyle Ungar, Muredach P Reilly, Xiangjie Li, and Mingyao Li. A joint deep learning model enables simultaneous batch effect correction, denoising, and clustering in single-cell tran- scriptomics. Genome research, 31(10):1753-1766, 2021.
- [Lotfollahi et al., 2022] Mohammad Lotfollahi, Mohsen Naghipourfar, Malte D Luecken, Matin Khajavi, Maren Büttner, Marco Wagenstetter, Žiga Avsec, Adam Gayoso, Nir Yosef, Marta Interlandi, et al. Mapping single-cell data to reference atlases by transfer learning. Nature Biotechnology, 40(1):121-130, 2022.
- [Luecken and Theis, 2019] Malte D Luecken and Fabian J Theis. Current best practices in single-cell rna-seq anal- ysis: a tutorial. Molecular systems biology, 15(6):e8746, 2019.
- [Satija et al., 2015] Rahul Satija, Jeffrey A Farrell, David Gennert, Alexander F Schier, and Aviv Regev. Spatial re- construction of single-cell gene expression data. Nature biotechnology, 33(5):495-502, 2015.
- [Shao et al., 2020] Xin Shao, Jie Liao, Xiaoyan Lu, Rui Xue, Ni Ai, and Xiaohui Fan. sccatch: automatic annotation on cell types of clusters from single-cell rna sequencing data. Iscience, 23(3):100882, 2020.
- [Villani, 2009] Cédric Villani. Optimal transport: old and new, volume 338. Springer, 2009.
- [Wan et al., 2022] Hui Wan, Liang Chen, and Minghua Deng. scname: neighborhood contrastive clustering with ancillary mask estimation for scrna-seq data. Bioinformat- ics, 38(6):1575-1583, 2022.
- [Wang et al., 2022] Hai-Yun Wang, Jian-Ping Zhao, Chun- Hou Zheng, and Yan-Sen Su. sccnc: a method based on capsule network for clustering scrna-seq data. Bioinfor- matics, 2022.
- [Xu et al., 2021] Chenling Xu, Romain Lopez, Edouard Mehlman, Jeffrey Regier, Michael I. Jordan, and Nir. Yosef. Probabilistic harmonization and annotation of single-cell transcriptomics data with deep generative mod- els. Molecular systems biology, (1):e9620, 2021.
- [Ziegenhain et al., 2017] Christoph Ziegenhain, Beate Vieth, Swati Parekh, Björn Reinius, Amy Guillaumet-Adkins, Martha Smets, Heinrich Leonhardt, Holger Heyn, Ines Hellmann, and Wolfgang Enard. Comparative analysis of single-cell rna sequencing methods. Molecular cell, 65(4):631-643, 2017.
References were extracted automatically from the PDF and may contain errors.
Full text extracted automatically from the PDF; figures, tables and equations may differ. The PDF is the version of record.
1 Introduction
Single-cell RNA sequencing (scRNA-seq) technologies allow us to measure gene expressions in millions of single cells and promise to provide high-resolution insights into the complex cellular ecosystem [Ziegenhain et al., 2017]. Cell annotation is the fundamental step in analyzing scRNA-seq data [Luecken and Theis, 2019]. In recent years, with more and more well-annotated scRNA-seq data becoming available, researchers turn to use neural networks to achieve automatic annotation of cell types [Cao et al., 2019]. Naturally, suppose Cr and Ct represent the label sets of reference and target data, respectively. Earlier developed methods are based on a close-set assumption, which can be expressed as Ct ⊆ Cr. However, this assumption is difficult to satisfy for data in the wild[Xu et al., 2021]. Therefore, to take into account a more realistic situation, the open-set scenario is introduced, that is, Cr ⊂ Ct, and several methods are proposed to settle this task, aiming to annotate cells with cell type labels in reference data or a unified "unassigned" label [Kimmel and Kelley, 2020].
Although the existing methods have achieved remarkable progress, they can not carry out further fine-grained analysis for them, which is not conducive to the subsequent downstream analysis [Brbi´c et al., 2020]. To address this need, we propose a more practical and challenging annotation task called realistic cell type annotation and discovery for scRNAseq data, whereby cells from novel cell types are given cluster labels instead of "unassigned" label and cells from seen cell types are given cell type label. One may argue that we can first use the annotation methods for the open-set scenario to find cells with "unassigned" label and then further cluster them into different groups. However, since the annotation results have a significant effect on the subsequent clustering process [Chen et al., 2020b], completely separating two processes is not conducive to problem-solving. Furthermore, we can also prove experimentally that the two-step approach only provides sub-optimal results.
However, settling this new task may face some challenges. First, the lack of label supervision for novel cell types will cause the model to be biased towards the seen cell types, thus further generating an imbalanced prediction state. Second, removing batch effects and other confounding noises, while maintaining biological signals of interest, is also essential but challenging for exploiting the clustering structure in target data [L¨ahnemann et al., 2020]. In this paper, we propose an end-to-end algorithm called scPOT based on a unified optimal transport (OT) framework to address these issues. For the cell type discovery, we introduce an OT-based prototypical selfsupervised learning paradigm to facilitate both global discrimination of clusters and local consistency of cells, which can avoid over-reliance on reference supervision and help recognize the whole cell types automatically. With regard to seen cell type annotation, we design an unbalanced OT-based partial alignment method to detect the common cells in the target data, which can uncover the intrinsic difference between reference and target data based on the statistical information of the assignment matrix. By leveraging the clustering accuracy on reference data, we propose a solution to estimate the number of cell types in target data, which is a challenging and poorly investigated problem in single-cell annotation. Lastly, to evaluate the performance of scPOT comprehensively, we choose various comparison baselines and build the intra-data and cross-data benchmarks on the basis of massive, highly imbalanced scRNA-seq data.
We highlight the main contribution as follows:
- We propose a new, practical, and challenging task called realistic cell type annotation and discovery in the singlecell annotation field. To solve this problem effectively, we further propose a novel method named scPOT.
- We introduce a unified OT framework based on a cellprototype alignment schedule to achieve seen cell type annotation and novel cell type clustering simultaneously.
- An easy yet effective solution is designed for the challenging problem of estimating the overall cell type number in target data.
- Comprehensive evaluation benchmarks are constructed to validate the practicality of scPOT, and deeper analyses show the effectiveness of its individual components.
2 RelatedWork
Single-Cell RNA-Seq Data Clustering. As an unsupervised learning branch, clustering is widely used for identifying cell types [Lakkis et al., 2021]. Early efforts are mostly based on traditional dimension reduction and hard clustering methods [Satija et al., 2015]. However, since the scRNA-seq data possess the characteristics of high dimension, sparseness, and complex nonlinear relationships, the traditional clustering methods might obtain unsatisfactory results. Recently, with the breakthrough of deep learning, several deep clustering methods have emerged to serve scRNAseq data. scziDesk clusters the cell population in the learned latent space by a soft self-training K-means algorithm [Chen et al., 2020a]. scNAME incorporates a mask estimation task and a neighborhood contrastive learning framework to cluster cells [Wan et al., 2022]. As a semi-supervised clustering method based on the capsule network, scCNC integrates domain knowledge into the clustering process [Wang et al., 2022]. However, although these methods can discover novel cell types in target data, they cannot recognize the seen cell types that previously existed in reference data.
Single-Cell RNA-Seq Data Annotation. The traditional cell annotation methods usually first cluster cells and then manually annotate these clusters to different cell types based on marker genes, which is time-consuming and subjective [Kiselev et al., 2019]. With the tremendous increase of wellannotated scRNA-seq datasets, more and more studies turn to exploring automatic annotation methods [Shao et al., 2020]. ItClust is a transfer learning-based method that takes advantage of cell-type-specific gene expression information learned from reference data [Hu et al., 2020]. MARS applies metalearning to encourage the same cell types to have similar features while those of different cell types are far apart [Brbi´c et al., 2020]. scNym is a gene expression knowledge integration framework that uses semi-supervised and adversarial learning techniques [Kimmel and Kelley, 2020]. scArches uses transfer learning and parameter optimization to enable reference building and contextualization of target data [Lotfollahi et al., 2022]. Overall, these methods can only roughly annotate cells from novel cell types with "unassigned" label, which is not conducive to subsequent downstream analysis.
3 Method
We first give some notations. In realistic cell type annotation and discovery task, we are given some labeled reference data Dr = {(xri , yr i )nr i=1 } and unlabeled target data Dt = {(xti )nt i=1 }, which can come from the same scRNA-seq dataset or different scRNA-seq datasets. The label sets of reference and target data are denoted as Cr and Ct, respectively. In our problem, we assume that Cr ⊂ Ct; furthermore, the seen label set is defined as Cs = Cr ∩ Ct, and the novel label set is defined as Cn = Ct\Cr. The goal is to assign either seen cell type labels or clustering labels to cells in the target data.
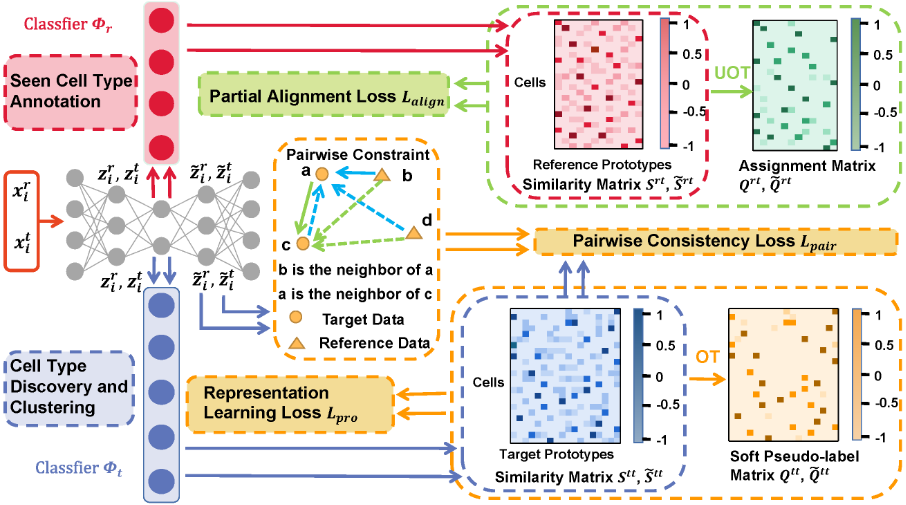
Considering the traits of scRNA-seq data, we assume that {xi}nr+nt i=1 follows a zero-inflated negative binomial distribution and use a denoising autoencoder model to reconstruct data [Eraslan et al., 2019]. Inspired by the recent progress in self-supervised learning [He et al., 2020], we use a data augmentation strategy to generate different views of gene expression, which can capture the correlations across genes better. The detailed information can be seen in the supplementary. In order to assign an annotation or clustering label for each cell, we attach two prototype-based classifiers Φr and Φt to the latent layer. Φr projects the l2 normalized embedding zi into one of the |Cr| seen cell types together with a similarity vector sri , where sri = V r zi and V r = [vr 1 , vr 2 , ..., v|Cr r |]T is the l2 normalized reference prototype matrix. Similarly, Φt maps zi to one of the |Cr ∪ Ct| clusters together with a similarity vector sti , where sti = V t zi and V t = [vt1 , vt2 , ..., vt |Cr∪Ct | ]T is the l2 normalized target prototype matrix. The value of |Cn| can be estimated and entered into the model as a prior. The specific estimation method will be introduced later. Since we also take the augmented data as input, its embedding representation and predictive probability can be written as ˜ zi and ˜ si, respectively. In the testing phase, we match each reference prototype with the nearest target prototype by the cosine similarity. Then for each target cell, we calculate the maximum component index of sri ∪sti and take it as the prediction label.
3.1 OT-Based Prototypical Representation Learning for Novel Cell Type Discovery
To exploit the cell type structure and facilitate the feature representation learning for the target data, we propose a prototypical self-supervised clustering technique from the perspective of OT [Villani, 2009], which solves a full mapping problem between target cells and target prototypes. Specifically, we briefly recall the well-known OT problem. Let Ωd = {µ : µT 1d = 1} denote a simplex set, where 1d refers to a d-dimensional vector of all one. Given two simplex distribution vectors α ∈ Ωm and β ∈ Ωn, we can define the transport polytope of α and β as follows,
The transport polytope A(α, β) can also be interpreted as a set of all possible joint probabilities of (F, G), where F and G are two d-dimensional random variables with marginal distribution α and β, respectively. When we have a similarity matrix M, the joint probability matrix Q∗ , also called as coupling matrix mapping α to β, can be quantified by optimizing the following maximization problem,
where ϵ > 0 and H(Q) = - ∑ij Qij logQij is the entropy regularization. The optimal Q∗ is shown to be unique with the form Q∗ = Diag(u) exp(M/ϵ)Diag(v), where u and v can be solved by sinkhorn-knopp algorithm [Cuturi, 2013].
Given B normalized target feature vectors Z t = [zt1 , zt2 , ..., z tB ]T , we are interested in mapping them to the target prototypes V t . We denote this mapping by Qtt = [qtt 1 , qtt 2 , ..., qtt B ]T , and optimize Qtt to maximize the similarity matrix Stt = [stt 1 , stt 2 , ..., sttB ]T between the target features and target prototypes by solving the following OT problem,
The constraint of marginal uniform distribution enforces that on average each prototype is selected at least B |Cr∪Ct| times in the batch. The solution Qtt satisfies the condition that the sum of each row equals to 1 |Cr∪Ct| strictly. To further obtain the prototype assignment distribution for each target cell, we need tomultiplyQtt by |Cr∪Ct|, i.e., Qtt ←Qtt ×|Cr∪Ct|, to ensure each row of Qtt is a probability vector. Similarly, for another augmented branch, we can also obtain the soft assignment matrix ˜Qtt . To encourage the separability of clusters and guarantee the discrimination of features, we propose a swapped prototypical representation learning loss as follows,
rameter. By replacing stt ik with ˜ stt ik , the ˜ ptt ik can be obtained as same way as ptt ik . We observe that a strong entropy regularization (i.e., using a high ϵ) in OT generally leads to a trivial solution where all cells collapse into a unique representation and are all assigned uniformly to all prototypes [Caron et al., 2020]. Hence, in practice, we keep ϵ low.
Note that Lpro does not involve the cells in the reference data and the local structure of the whole data cannot be captured. Therefore, we propose to encourage the prediction consistency of similar cells and utilize the pairwise constraint to group the cells from the same cell types. To achieve this, we rely on the ground-truth annotations from the reference data and pseudo-labels generated on the target data. Specifically, for the reference data, we already know which pairs should belong to the same cell types according to groundtruth labels. To obtain the pseudo-labels for the target data, we compute the cosine distance between all pairs of normalized feature embeddings in the reference and target batches. We then rank the computed distances and for each target cell generate the pseudo-label for its most similar neighbor. Given two mini-batch feature embeddings {zr i }Bi=1 ∪{zt j }Bj=1 , we denote its closest set as {z′i r }Bi=1 ∪ {z′j t }Bj=1 . Note that {z′i r }Bi=1 is always correct since it is generated using the ground-truth labels. Similarly, for the augmented branch {˜ zr i }Bi=1 ∪ {˜ zt j }Bj=1 , we also can obtain the corresponding closest set {˜ z′i r }Bi=1 ∪ {˜ z′j t }Bj=1 . Then our pairwise objective is defined as a modified binary cross-entropy loss,
where σ is the sigmoid function and ⟨.⟩ refers to the vector inner product operation. We update similarities and positive pairs in an online fashion and thus benefit from improved feature representation during training. Eventually, to encourage both global discrimination of clusters and local consistency of cells, we unify Lpro with Lpair as follows,
3.2 OT-Based Prototypical Partial Alignment for Seen Cell Type Annotation
For seen cell type classifier Φr, we can use the known label information of reference data to train it based on the standard cross-entropy loss. Given B reference cells, we have
where ϕ is the softmax function. Since the target data possess some novel cell types, we cannot match all target cells with reference prototypes and we should consider partial alignment to avoid misalignment between them. To extract the shared knowledge across data, we propose an unbalanced OTbased seen cell type annotation method, which solves a partial mapping problem between target cells and reference prototypes. Specifically, OT ϵ (M, α, β) is not suitable for the partial alignment problem, because its solution Q∗ satisfies the condition of A(α, β) strictly. So unbalanced OT is designed to relax the conservation of marginal constraints by allowing the system to use soft penalties, which can be formulated as,
where KL is the Kullback-Leibler Divergence. This optimization problem can be solved by the generalized sinkhornknopp algorithm [Chizat et al., 2018]. Given B normalized target features Z t = [zt1 , zt2 , ..., z tB ]T , to achieve mapping them to the reference prototypes V r , we can obtain the optimal assignment matrix Qrt by optimizing the following unbalanced OT objective,
where Srt = [srt 1 , srt 2 , ..., srt B ]T . Note that the target cells from novel cell types will be assigned with relatively low weights in Qrt . Based on this observation, we select target cells with top confidence as seen cell types by mining the statistical information of the assignment matrix Qrt .
We first normalize the assignment matrix, i.e., Qrt ← Qrt / ∑ Qrt . Then we generate scores based on the statistical property of Qrt , which depicts the geometrical relationship between target cells and reference prototypes. For i-th row of Qrt , it can be seen as a prediction vector of i-th target cell and we can obtain its pseudo-label ˆ yt i by argmax operation. And we assign it confidence score ξ rt i with the maximum value of i-th row in Qrt , i.e., ξ rt i = max({Qrt i1 , Qrt i2 , ..., Qrt i|Cr| }). A higher score ξ rt i implies that zt i is relatively closer to a source prototype than any other cells and is more likely from a seen cell type. Meanwhile, to select target cells with top confidence, we also evaluate the confidence score of j-th reference prototype with the sum of j-th column, i.e., ζ rt j = ∑Bi=1 Qrt ij . Analogously, a higher score ζ rt j means vr j is a more reliable reference prototype, which is assigned to target cells more frequently. Then the target cells from seen cell types can be detected by statistic values, i.e.,
where δt i = 1 indicates the i-th target cell is regarded as from the seen cell types with top confidence, which can be assigned with pseudo-label ˆ yt i . Similarly, the same procedure can be implemented on the augmented branch to obtain ˜ δt i and ˆ˜ yt i . Naturally, we can use the pseudo-labels of selected target cells to compute the swapped partial alignment loss below,
where ϕ is the softmax function. Combining Lce with Lalign, we give the training loss on the reference prototypes,
Overall loss. Together with the data denoising loss Lden (see supplementary), we give the overall training objective as
where λ and γ are two weight hyper-parameters.
3.3 Estimation of the |Ct| Value
Here, we propose a solution to the challenging and underinvestigated problem in cell annotation: estimating the cell type number |Ct| in target data. Almost all annotation methods assume that the number of |Ct| is prior. However, this assumption is unrealistic in the real world. This calls on the community to develop a method for estimating |Ct|. Our main idea derives from the information available in Dr. Specifically, we perform sphere k-means clustering on the whole dataset Dr ⋃ Dt and then evaluate clustering accuracy only on the reference data Dr. Let | ˆ Ct| represent the estimated value. If | ˆ Ct| > |Ct|, then ˆ Ct - Ct can be called the extra cell types, and all cells assigned to extra cell types are mispredicted. Similarly, if | ˆ Ct| < |Ct|, then Ct - ˆ Ct can be called the extra true cell types, and all cells with those cell types are predicted incorrectly. Based on this analysis, whether | ˆ Ct| is higher or lower than |Ct| will have a negative impact on the clustering accuracy on Dr. In other words, the clustering accuracy on Dr will be maximized when | ˆ Ct| = |Ct|. According to this intuition, we use AC = f(| ˆ Ct|, Dr) to measure the clustering accuracy on Dr, which we optimize with Brent's algorithm to find the optimal | ˆ Ct| [Brent, 2013].
4 Experiment
4.1 Setup
Dataset. Our experiments consist of intra-data annotation and cross-data annotation. For the former, we collect 10 datasets sequenced from different organisms. The cell numbers range from 6462 to 110704, and the cell type numbers vary from 9 to 45. Unless otherwise noted, we first divide all cell types into 50% seen and 50% novel. Then we select 50% samples in seen cell types as Dr and the rest as Dt. For the latter, we select 10 groups of datasets. Each group consists of a reference dataset and a target dataset, and the batch effect exists between them. The basic information of these datasets can be seen in the supplementary.
Baselines. Our task is to establish a new cell annotation setting for which no ready-to-use baselines exist. Thus, we compare scPOT with recently developed scRNA-seq clustering and annotation algorithms, including three clustering methods (scziDesk, scCNC, and scNAME) and four annotation methods (MARS, ItClust, scNym, and scArches). For clustering methods, only scCNC participates in training with both Dr and Dt, while the other two trains only on Dt. We report their clustering performance on seen and novel cell types. For annotation methods, we first use them to classify target cells into seen cell types and identify the "unassigned" group. Next, we apply k-means clustering on the "unassigned" group to obtain novel clusters. Detailed information on these baselines can be seen in the supplementary.
Evaluation Protocols. We report the classification accuracy on seen cell types and clustering accuracy on novel cell types for scPOT and annotation baselines while reporting clustering accuracy on both seen and novel cell types for clustering baselines. Specifically, to compute the clustering accuracy, we apply the Hungarian algorithm to solve the optimal assignment problem [Kuhn, 1955]. When reporting accuracy on all cell types, we solve the optimal assignment problem on both seen and novel cell types. The reported accuracies are the mean values of three runs.
Implementation Details. Our algorithm is implemented by PyTorch, and we conduct the experiments with 2 Tesla A100 GPUs. The two layers of the encoder are sized 512 and 256, respectively, and the decoder has the reverse structure of the encoder. The bottleneck layer has a size of 128. The training mini-batch size is set to 256, and the optimizer is Adam with a learning rate of 1e-4. The temperature τ is set to 0.1, and the loss weight parameters λ and γ are both set to 1.0. The parameters ϵ and κ in OT are set slightly differently in various datasets and the details can be seen in the supplementary. We first train the whole model using Lden loss with 600 epochs. Then, we apply the sphere k-means algorithm on target embeddings to obtain cluster centers as the initial values of target prototypes. The initialization of reference prototypes can be obtained by the mean values of reference embeddings based on ground-truth labels. Finally, we train the model with the overall loss Ltol until the predictions no longer change.
4.2 Results
Intra-data Annotation. To begin, we explore the performance of scPOT under the intra-data setting without batch effect. From the results in Tabel 1, we can conclude that scPOT consistently achieves stable and the best performance under three types of accuracy on most datasets. It is not worth surprising that scPOT gets such an excellent performance since the unified OT framework based on a cell-prototype alignment schedule can effectively realize label transferring of seen cell types and cell clustering of novel cell types by solving the optimal assignment problem. The results in Tabel 1 also fully show that the two-step strategy that first annotates cells of novel cell types with "unassigned" label and then further clusters them is not an appropriate solution to this new task. By comparison, although scNym can obtain relatively high annotation accuracy on seen cell types, and even higher than our method on individual datasets, it has a sharp drop in clustering accuracy on novel cell types. As an unsupervised annotation method, MARS allows for fine-grained analysis of novel cell types and has the ability to assign clustering labels for them. However, it can only provide sub-optimal results for both annotation and clustering accuracy. scCNC and ItClust are not excellent in both annotation and clustering accuracy, and ItClust even fails catastrophically in annotating seen cell types. As clustering methods, scziDesk and scNAME cannot provide satisfactory results for the reason that they do not utilize the information in reference datasets, which makes them less competitive. In summary, scPOT outperforms other competing methods under three kinds of accuracy in the intradata setting. This superior performance shows that scPOT achieves remarkable progress for this novel task.
Cross-Data Annotation. In this section, we turn to explore a more challenging setting, that is, the cross-data setting with batch effect. We compare scPOT with other seven competitive methods on ten groups of mixed datasets. As shown in Table 2, scPOT achieves consistently better results than other methods on most datasets, which demonstrates that scPOT can also deliver excellent performance for the crossdata situation. Moreover, compared with the intra-data setting, there is no significant decline in the performance of scPOT, indicating that scPOT could resist the effect of batch effect to some extent. scziDesk and scNAME are unsupervised clustering methods and do not use reference data, they do not have to deal with batch effects, but at the same time, they can not get the cell type knowledge from reference data. In comparison, since MARS and ItClust separate the learning process on reference data from the training process on target data, elevating susceptibility to batch effect, and in turn, leading to model overfitting and false cell type annotations.
| Cao | Hochane | Park | Quake 10x | Quake Smart-seq2 | |||||||||||
|---|---|---|---|---|---|---|---|---|---|---|---|---|---|---|---|
| seen | novel | overall | seen | novel | overall | seen | novel | overall | seen | novel | overall | seen | novel | overall | |
| scziDesk | 85.2 | 74.1 | 63.8 | 91.0 | 83.9 | 84.4 | 97.3 | 72.9 | 85.0 | 84.1 | 58.5 | 73.3 | 76.7 | 72.5 | 70.7 |
| scNAME | 79.1 | 78.5 | 75.1 | 91.0 | 85.7 | 84.3 | 56.6 | 79.5 | 73.4 | 82.2 | 62.0 | 69.8 | 76.5 | 61.2 | 63.5 |
| scCNC | 50.2 | 60.9 | 52.7 | 94.1 | 70.0 | 70.4 | 92.4 | 61.0 | 76.6 | 85.0 | 49.8 | 61.3 | 65.0 | 40.8 | 39.0 |
| MARS | 88.6 | 75.8 | 64.3 | 96.9 | 74.5 | 78.8 | 61.6 | 78.2 | 68.3 | 92.1 | 52.8 | 68.9 | 80.3 | 70.6 | 69.2 |
| ItClust | 14.5 | 62.3 | 56.6 | 33.1 | 49.5 | 45.3 | 76.3 | 42.6 | 62.4 | 70.5 | 47.3 | 52.3 | 32.7 | 55.5 | 49.4 |
| scNym | 99.2 | 69.4 | 66.2 | 98.9 | 49.8 | 46.0 | 99.8 | 48.9 | 45.2 | 98.4 | 52.8 | 60.8 | 96.9 | 59.2 | 56.4 |
| scArches | 73.4 | 46.5 | 52.2 | 82.6 | 91.5 | 89.3 | 86.6 | 36.8 | 65.7 | 88.3 | 56.6 | 69.1 | 72.3 | 54.7 | 57.2 |
| scPOT | 90.6 | 84.3 | 81.5 | 98.4 | 93.6 | 86.2 | 96.8 | 82.1 | 87.5 | 94.5 | 63.4 | 78.2 | 90.1 | 75.4 | 76.7 |
| Wagner | Zeisel | Zheng | Chen | Guo | |||||||||||
| seen | novel | overall | seen | novel | overall | seen | novel | overall | seen | novel | overall | seen | novel | overall | |
| scziDesk | 72.1 | 48.2 | 54.6 | 78.0 | 89.1 | 82.5 | 57.7 | 52.0 | 45.7 | 78.8 | 92.2 | 90.8 | 99.6 | 80.0 | 75.1 |
| scNAME | 74.4 | 48.4 | 54.8 | 93.4 | 88.1 | 84.3 | 57.7 | 52.0 | 45.7 | 79.8 | 92.1 | 91.1 | 99.8 | 76.4 | 72.0 |
| scCNC | 85.8 | 51.4 | 55.0 | 77.2 | 50.8 | 55.0 | 61.5 | 56.6 | 48.6 | 79.8 | 92.1 | 91.1 | 99.8 | 76.4 | 72.0 |
| MARS | 81.6 | 42.6 | 50.9 | 98.9 | 83.3 | 84.1 | 72.5 | 59.5 | 50.6 | 80.1 | 94.1 | 90.4 | 99.7 | 72.6 | 68.8 |
| ItClust | 18.5 | 32.2 | 36.4 | 52.7 | 57.3 | 54.1 | 20.7 | 50.9 | 43.8 | 20.8 | 82.5 | 72.2 | 19.5 | 74.7 | 67.8 |
| scNym | 96.5 | 42.3 | 44.2 | 99.6 | 64.6 | 62.7 | 98.8 | 56.5 | 51.4 | 97.4 | 77.7 | 72.2 | 99.8 | 60.4 | 56.8 |
| scArches | 58.1 | 35.9 | 41.7 | 78.1 | 60.0 | 63.3 | 60.4 | 72.9 | 68.4 | 74.4 | 85.6 | 82.9 | 61.0 | 78.9 | 74.8 |
| scPOT | 89.2 | 53.7 | 58.6 | 97.5 | 90.8 | 87.4 | 93.9 | 76.2 | 69.5 | 90.6 | 95.7 | 93.2 | 99.8 | 87.1 | 80.6 |
4.3 Ablation Study
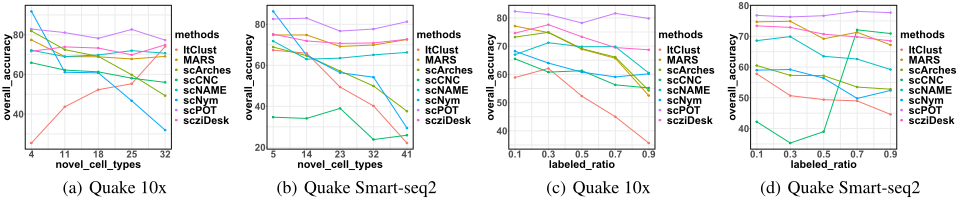
Robustness Analysis. Since the novel cell type number |Cn| determines the difficulty for methods to discover and cluster novel cells, it is imperative to explore the influence of the variation of |Cn| on the methods. We evaluate the performance of all eight methods on Quake 10x and Quake Smart-seq2 with 36 and 45 total cell type numbers, respectively. Here, |Cn| varies in the range of [4, 11, 18, 25, 32] for Quake 10x and [5, 14, 23, 32, 41] for Quake Smart-seq2. Figure 2(a) and Figure 2(b) are the line graphs that show the results intuitively. It is easy to see that the change of |Cn| has a huge effect on the overall accuracy of all methods and it is reasonable because |Cn| affects the specific gravity of different cell types and can therefore influence the performance of methods. From the Figure, we can conclude that no matter what value |Cn| takes, scPOT beats other methods with clear margins. Moreover, with the change of |Cn|, the overall accuracy of scPOT varies only slightly, suggesting the robustness of scPOT. On the contrary, other methods are affected by the variation of |Cn| to varying degrees. The overall accuracy of scNym, scArches and scCNC drops catastrophically with increasing |Cn|. It is noteworthy that the result for ItClust rises dramatically on Quake 10x and drops significantly on Quake Smart-seq2, which suggests its instability. Although the results of MARS, scziDesk and scNAME are relatively stable, they tend to provide sub-optimal results. Therefore, we can conclude that scPOT is robust for the variation of |Cn|.
Besides, since the ratio of labeled data determines how much information can be used for annotation and clustering, we explore its impact by conducting experiments on Quake 10x and Quake Smart-seq2 datasets. The ratio of labeled data varies in the range of [0.1, 0.3, 0.5, 0.7, 0.9], and Figure 2(c) and 2(d) describe the variation tendency overall accuracy of eight methods. We can find that scPOT still performs best, no matter what value the ratio of labeled data takes. However, the other seven methods all show an obvious downward trend. This result is in line with our speculation for the reason that these three methods are all to make the model learn the knowledge from the reference data first and then transfer the learned knowledge or model to the target data to make predictions, which is sensitive to the size of the reference dataset. In conclusion, this experiment provides intuitive evidence to confirm that scPOT can provide reliable and remarkable performance, even with a few labeled data.
Validity of the |Ct| Value Estimation Method. The estimated value of |Ct| determines the performance of methods for discovering novel cell types. Thus, it is imperative to conduct experiments to validate the validity of the |Ct| value estimation method. Specifically, Quake 10x and Quake Smartseq2 are used as our experimental data, whose total cell type numbers are 36 and 45, respectively. We study the case when |Ct| varies in the range of [-15,-10,-5, 0, 5, 10, 15] and "increment=0" means that the estimated value of |Ct| is equal to the true value. The results are shown in Table 3. For these two datasets, we can clearly see that the clustering accuracy gets the maximum value when the increment is 0, indicating the validity of our estimation method.
Effect of Lpro, Lpair and Lalign. Here, we carry out an ablation study on 10 real datasets to learn about the effect and performance gain of introducing Lpro,Lpair and Lalign in scPOT, respectively. The results are shown in Table 4. We can clearly see that removing Lpro results in the most significant effect on the overall accuracy, mainly because it plays a key role in the discovery and separation of novel cell types. It can also be seen that when the number of cell types in target data is relatively large, adding the local structure constraint Lpair has a greater effect on overall accuracy, in contrast, the effect of prototype-oriented partial alignment loss Lalign is more significant. Overall, we can conclude that the strategies we propose are of significant value to address this new task.
| Enge (R) Baron human (T) | Lawlor (R) Baron human (T) | Muraro (R) Baron human (T) | Xin (R) Baron human (T) | Vento 10x (R) Vento Smart-seq2 (T) | |||||||||||
|---|---|---|---|---|---|---|---|---|---|---|---|---|---|---|---|
| seen | novel | overall | seen | novel | overall | seen | novel | overall | seen | novel | overall | seen | novel | overall | |
| scziDesk | 81.6 | 81.5 | 81.6 | 81.3 | 80.3 | 81.2 | 81.6 | 81.5 | 81.6 | 75.1 | 84.2 | 81.3 | 81.7 | 79.0 | 81.5 |
| scNAME | 81.0 | 81.9 | 81.2 | 80.7 | 79.4 | 79.9 | 95.8 | 71.4 | 91.2 | 73.6 | 85.3 | 77.7 | 87.4 | 80.3 | 86.0 |
| scCNC | 47.6 | 38.5 | 38.8 | 54.0 | 43.9 | 40.9 | 75.0 | 40.8 | 61.1 | 46.6 | 54.7 | 36.5 | 92.1 | 63.4 | 84.8 |
| MARS | 90.3 | 86.2 | 79.8 | 80.9 | 90.7 | 80.3 | 79.5 | 82.3 | 80.0 | 93.6 | 78.0 | 88.6 | 71.3 | 78.6 | 70.3 |
| ItClust | 83.4 | 52.3 | 72.7 | 88.5 | 48.9 | 77.1 | 80.9 | 56.4 | 69.2 | 84.5 | 80.7 | 84.1 | 79.8 | 50.7 | 70.4 |
| scNym | 97.7 | 71.9 | 84.7 | 90.2 | 52.2 | 82.8 | 88.2 | 55.5 | 63.9 | 97.9 | 40.0 | 52.3 | 98.7 | 66.5 | 75.9 |
| scArches | 89.2 | 58.0 | 80.3 | 47.3 | 66.8 | 52.5 | 89.3 | 52.8 | 80.9 | 61.5 | 52.2 | 52.7 | 87.6 | 52.9 | 78.2 |
| scPOT | 92.5 | 84.7 | 87.2 | 93.8 | 86.4 | 88.7 | 94.5 | 85.9 | 92.4 | 94.3 | 87.6 | 90.8 | 96.5 | 82.2 | 90.6 |
| Vento Smart-seq2 (R) Vento 10x (T) | Plasschaert (R) Montoro 10x (T) | M Smart-seq2 (R) M 10x (T) | Haber largecell (R) Haber region (T) | Haber region (R) Haber largecell (T) | |||||||||||
| seen | novel | overall | seen | novel | overall | seen | novel | overall | seen | novel | overall | seen | novel | overall | |
| scziDesk | 88.4 | 98.4 | 90.9 | 67.9 | 74.6 | 68.3 | 94.0 | 89.3 | 91.2 | 43.9 | 60.9 | 53.0 | 85.3 | 80.8 | 71.0 |
| scNAME | 86.5 | 98.2 | 92.8 | 95.1 | 90.2 | 96.0 | 93.7 | 99.0 | 96.8 | 46.0 | 62.6 | 54.3 | 89.1 | 80.9 | 71.6 |
| scCNC | 83.4 | 47.1 | 43.7 | 79.7 | 73.1 | 73.0 | 92.4 | 65.5 | 76.2 | 62.7 | 69.4 | 55.9 | 75.7 | 50.4 | 51.6 |
| MARS | 94.5 | 78.6 | 83.8 | 88.6 | 94.5 | 89.1 | 81.5 | 97.5 | 86.9 | 57.1 | 75.1 | 68.2 | 83.8 | 64.1 | 67.1 |
| ItClust | 64.3 | 75.0 | 58.2 | 90.1 | 75.1 | 83.2 | 36.8 | 70.5 | 67.2 | 53.4 | 58.2 | 56.4 | 6.2 | 64.5 | 53.6 |
| scNym | 98.1 | 70.4 | 80.6 | 96.1 | 77.7 | 83.1 | 95.1 | 48.6 | 49.8 | 95.8 | 44.4 | 51.2 | 84.2 | 53.7 | 53.0 |
| scArches | 83.4 | 66.8 | 75.2 | 91.4 | 67.4 | 85.3 | 62.0 | 55.5 | 59.0 | 72.3 | 51.7 | 59.6 | 71.9 | 45.4 | 50.4 |
| scPOT | 96.8 | 98.9 | 97.3 | 95.8 | 92.3 | 96.5 | 94.6 | 99.2 | 97.7 | 83.4 | 92.5 | 88.1 | 86.9 | 82.6 | 80.0 |
| increment | -15 | -10 | -5 | 0 | 5 | 10 | 15 |
|---|---|---|---|---|---|---|---|
| Quake 10x | 87.5 | 91.2 | 93.3 | 94.1 | 93.6 | 92.4 | 90.6 |
| Quake Smart-seq2 | 78.3 | 83.6 | 89.4 | 90.8 | 90.2 | 88.9 | 87.1 |
5 Conclusion
In this article, we propose a new, practical, and challenging task called realistic cell type annotation and discovery in the single-cell field and design a unified OT framework called scPOT to address it. scPOT mainly consists of two main parts, which are an OT-based prototypical learning paradigm for the novel cell type discovery and an OT-based partial alignment strategy to realize seen label transferring. We also introduce a solution for the estimation problem of the total number of cell types in target data. To evaluate the algorithm's performance, we carefully construct comprehensive baselines and benchmarks. The results on massive real datasets verify the superiority and robustness of scGAD compared to several annotation and clustering methods.
| Methods | Cao | Hochane | Park | Q 10x | Q Smart-seq2 |
|---|---|---|---|---|---|
| scPOT w/o Lpro | 73.6 | 80.8 | 76.1 | 68.7 | 64.3 |
| scPOT w/o Lpair | 76.9 | 84.5 | 84.7 | 72.3 | 70.9 |
| scPOT w/o Lalign | 78.4 | 82.9 | 84.0 | 74.1 | 73.8 |
| scPOT (full) | 81.5 | 86.2 | 87.5 | 78.2 | 76.7 |
| Methods | Wagner | Zeisel | Zheng | Chen | Guo |
| scPOT w/o Lpro | 49.8 | 78.5 | 62.6 | 88.4 | 74.7 |
| scPOT w/o Lpair | 54.3 | 82.7 | 66.8 | 91.3 | 78.2 |
| scPOT w/o Lalign | 56.1 | 84.9 | 65.4 | 90.8 | 77.0 |
| scPOT (full) | 58.6 | 87.4 | 69.5 | 93.2 | 80.6 |
Contribution Statement
Yuyao Zhai and Liang Chen made the same contribution to this paper, and Minghua Deng is the corresponding author.
@inproceedings{ijcai2023p552,
  title     = {Realistic Cell Type Annotation and Discovery for Single-cell RNA-seq Data},
  author    = {Zhai, Yuyao and Chen, Liang and Deng, Minghua},
  booktitle = {Proceedings of the Thirty-Second International Joint Conference on
               Artificial Intelligence, {IJCAI-23}},
  publisher = {International Joint Conferences on Artificial Intelligence Organization},
  editor    = {Edith Elkind},
  pages     = {4967--4974},
  year      = {2023},
  month     = {8},
  note      = {Main Track},
  doi       = {10.24963/ijcai.2023/552},
  url       = {https://doi.org/10.24963/ijcai.2023/552},
}
TY - CPAPER TI - Realistic Cell Type Annotation and Discovery for Single-cell RNA-seq Data AU - Zhai, Yuyao AU - Chen, Liang AU - Deng, Minghua T2 - Proceedings of the Thirty-Second International Joint Conference on Artificial Intelligence, IJCAI-23 PB - International Joint Conferences on Artificial Intelligence Organization PY - 2023 SP - 4967 EP - 4974 DO - 10.24963/ijcai.2023/552 UR - https://doi.org/10.24963/ijcai.2023/552 ER -Copied
Machine-readable versions of this paper, for tools and AI agents:





