
An Anomaly Detection and Explainability Framework using Convolutional Autoencoders for Data Storage Systems
Proceedings of the Twenty-Ninth International Joint Conference on Artificial Intelligence. Demos. Pages 5228-5230.
https://doi.org/10.24963/ijcai.2020/752
Keywords
- Machine Learning: general
- Human-Computer Interactive Systems: general
Abstract
Anomaly detection in data storage systems is a challenging problem due to the high dimensional sequential data involved, and lack of labels.
The state of the art for automating anomaly detection in these systems typically relies on hand crafted rules and thresholds which mainly allow to distinguish between normal and abnormal behavior of each indicator in isolation.
In this work we present an end-to-end framework based on convolutional autoencoders which not only allows for anomaly detection on multivariate time series data, but also provides explainability. This is done by identifying similar historic anomalies and extracting the most influential indicators. These are then presented to relevant personnel such as system designers and architects, or to support engineers for further analysis.
We demonstrate the application of this framework along with an intuitive interactive web interface which was developed for data storage system anomaly detection. We discuss how this framework along with its explainability aspects enables support engineers to effectively tackle abnormal behaviors, all while allowing for crucial feedback.
- [Assaf et al., 2019] Roy Assaf, Ioana Giurgiu, Frank Bage- horn, and Anika Schumann. Mtex-cnn: Multivariate time series explanations for predictions with convolutional neu- ral networks. In 2019 IEEE International Conference on Data Mining (ICDM), pages 952-957. IEEE, 2019.
- [Bai et al., 2018] Shaojie Bai, J Zico Kolter, and Vladlen Koltun. An empirical evaluation of generic convolutional and recurrent networks for sequence modeling. arXiv preprint arXiv:1803.01271, 2018.
- [Fawaz et al., 2018] Hassan Ismail Fawaz, Germain Forestier, Jonathan Weber, Lhassane Idoumghar, and Pierre-Alain Muller. Deep learning for time series classification: a review. arXiv preprint arXiv:1809.04356, 2018.
- [Gilpin et al., 2018] Leilani H Gilpin, David Bau, Ben Z Yuan, Ayesha Bajwa, Michael Specter, and Lalana Kagal. Explaining explanations: An overview of interpretability of machine learning. In 2018 IEEE 5th International Con- ference on data science and advanced analytics (DSAA), pages 80-89. IEEE, 2018.
- [Kingma and Ba, 2014] Diederik P Kingma and Jimmy Ba. Adam: A method for stochastic optimization. arXiv preprint arXiv:1412.6980, 2014.
- [LeCun et al., 1995] Yann LeCun, Yoshua Bengio, et al. Convolutional networks for images, speech, and time se- ries. The handbook of brain theory and neural networks, 3361(10):1995, 1995.
- [Sakurada and Yairi, 2014] Mayu Sakurada and Takehisa Yairi. Anomaly detection using autoencoders with non- linear dimensionality reduction. In Proceedings of the MLSDA 2014 2nd Workshop on Machine Learning for Sensory Data Analysis, pages 4-11, 2014.
- [Yang et al., 2015] Jianbo Yang, Minh Nhut Nguyen, Phyo Phyo San, Xiao Li Li, and Shonali Krishnaswamy. Deep convolutional neural networks on multichannel time series for human activity recognition. In Twenty-Fourth International Joint Conference on Artificial Intelligence, 2015. IJCAI
- [Zheng et al., 2014] Yi Zheng, Qi Liu, Enhong Chen, Yong Ge, and J Leon Zhao. Time series classification using multi-channels deep convolutional neural networks. In In- ternational Conference on Web-Age Information Manage- ment, pages 298-310. Springer, 2014.
References were extracted automatically from the PDF and may contain errors.
Full text extracted automatically from the PDF; figures, tables and equations may differ. The PDF is the version of record.
1 Introduction
Storage systems are a crucial and ubiquitous part of computing infrastructures be it on premise or in the cloud. While failures of components like hard disks, etc. are typically easily detectable, changes in performance require more involved knowledge about the system. For example, systems can suffer from abnormally long response times which leads to loss in productivity and ultimately impact the client. The performance of a system is gauged by a set of key performance indicators, each of which measures a particular system characteristic. These indicators are made available via a data collection tool and are collected at system level. Example indicators are: Overall Back-end Response Time ms/op, Port Send I/O Rate ops/s, and Read Data Rate MiB/s.
The state of the art in the industry for automatically detecting performance anomalies usually relies on expert knowledge for setting rules and thresholds which mainly allow to distinguish between normal and abnormal behavior of each indicator in isolation. However, this presents many shortcomings, particularly ignoring the interactions between different indicators. Considering the multivariate time-series nature of the data, we tackle this problem using convolutional neural networks (CNNs) which have shown to be both effective [Fawaz et al., 2018; Zheng et al., 2014; Yang et al., 2015]; and superior to other methods [Bai et al., 2018] since they require less computational time and resources, and due to their ability to learn meaningful patterns from the data without the need for manual feature engineering. We do this using autoencoders which allow for unsupervised learning since labels are scarce in this domain. In this work, we demonstrate our framework for anomaly detection and explainability on multivariate time series data using convolutional autoencoders in storage systems. We show that this approach, which is coupled with explainability aspects, enables support engineers to more effectively tackle abnormal behaviors. And allows for feedback which is later used for improving the framework and building a rich anomaly signature database.
2 Anomaly Detection Framework
Here we describe our framework which is illustrated in Figure 1. The framework consists of three main parts: 1) The convolutional autoencoder, 2) the anomaly post-processing and explainability, and 3) the interactive web interface.
2.1 Model Architecture
We base our architecture design on the fact that labels are scarce, and the hypothesis that most storage system data reflect normal behavior.
Therefore, we use an autoencoder architecture with stacked 1D convolutional layers [LeCun et al., 1995]. The multivariate time series are handled by m× n kernels where n is the total number of indicators, and m the number of time steps considered by the kernels. These slide across the time axis with a stride s = 2 and their weights are optimized for all data samples which allows the network to learn associations between all indicators across time. This unsupervised learning approach aims to reconstruct the input data after significantly reducing dimensionality. This bottleneck along with the restricted capacity of the network force the network to only learn common patterns in order to optimize its l2 -norm loss. This is essential since common patterns are associated with normal behavior; therefore the network will have difficulty reconstructing novel and abnormal behavior [Sakurada and Yairi, 2014].
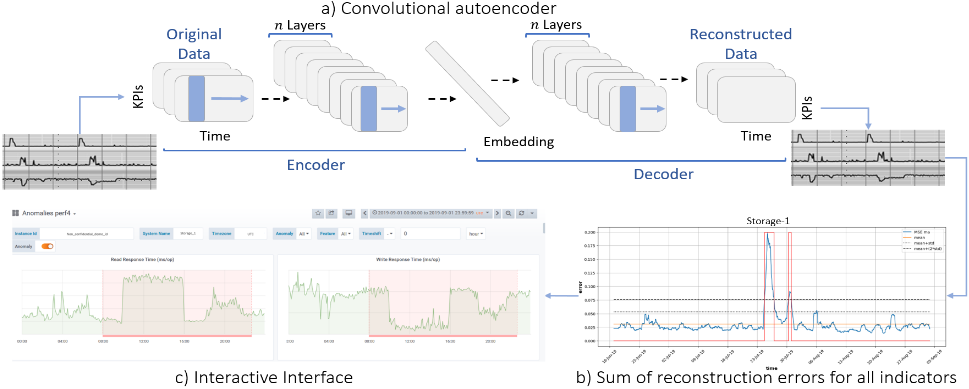
The architecture of the encoder network consists of three convolutional layers that use ReLU activation with 64, 128 and 256 filter maps and kernel size 8, 6 and 4 respectively. The decoder is symmetric to the encoder. The embedding dimension is chosen to be 256. We train the network for a maximum of 120 epochs and use the Adam optimizer [Kingma and Ba, 2014] with a learning rate set to 0.0001. We train a model for every system and do this for 1000s of systems. This is because different storage systems have different configurations and experience different workloads. These models are retrained either periodically or on demand, in order to consider the latest workload patterns, or to reflect patches or updates to the storage systems.
2.2 Post-Processing and Explainability
We use reconstruction-error based anomaly detection since the models have less accuracy reconstructing anomalous behavior. More importantly, we are interested in the relative error vs the absolute magnitude of the error. After the reconstruction errors are computed, we post-process these by first summing up the errors across all indicators per time step as e = ∑t ∑ni=1 ||xit - ˆxit ||2 , where xi is the time series of indicator i and t is the time step. Then, we apply a 1D convolution filter with equal weights, identical to a moving average as es = ∑t e[t:t+w] × v, where v is the filter of size w of identical values 1w . A larger w indicates more smoothing. This is done so that point anomalies are damped and allows us to focus on range anomalies. This is important since in data storage systems we are concerned with sustained performance anomalies.
Accordingly, a relative threshold is extracted following a k-sigma rule and is adjusted based on validation feedback. If the smoothed reconstruction error es exceeds this threshold it is considered an anomaly.
Once an anomaly is detected, we perform the explainability step. First, the reconstruction error can be traced back to each indicator. Then the indicators are sorted based on the cumulative error registered within the anomalous time period. This in turn allows us to compile a list of top-k most influential indicators that explain the model's decision. Second, we perform cosine similarity on the embedding space with historic anomalies. This allows us to identify the most similar anomalies and therefore explain the anomaly via association.
Placing our explainability work in perspective, typical explainability approaches for deep networks using time series data fit under explanations of deep network processing [Gilpin et al., 2018]. They make use of saliency maps for highlighting network attention such as in [Assaf et al., 2019; Yang et al., 2015]. These approaches either treat indicators in separation or require the usage of a particular network design which constrict the anomaly detection capability of our framework. Accordingly, the explainability approach described in this work fits under explanations of deep network representations, particularly under generated explanations [Gilpin et al., 2018]. This is because we designed our network with the aim of explaining anomalies by extracting the influence of the indicators, and by associating the anomalies to previous similar anomalies. Hence the use of the autoencoder architecture and the use of the reconstruction error paradigm.
2.3 Interactive Interface
A front-end is developed using Grafana as an interactive web interface for support engineers. This allows them to effortlessly lookup anomalies per storage system. These anomalies are visualized from start time to end as an overlay over key performance indicators such as response time, e.g. 1 c). Additional options are provided to display events, tickets or threshold-based alerts that might have occurred. This is done for the sake of completeness of having all the relative information easily accessible in one place, and more importantly because some support engineers might still be reliant on that additional information. Once an anomaly is selected, the list of top-k indicators are visualized, this is essential as going through all the indicators (> 200) would be infeasible and overwhelming. These explain the model's main reasons for flagging an anomaly. Also, similar historic anomalies can be displayed along with their closing actions. This allows for quicker analysis and leads to resolving anomalies in a shorter amount of time. The support engineers can further analyze the anomaly by either choosing to view other indicators, or by overlaying a lagged time series of that indicator e.g. 7 days, 1 month, etc. This is done for the sake of comparison and for distinguishing seasonal performance patterns. Notably, the interactive interface allows the support engineers to log details about the anomaly in a set of fields. Mainly the accuracy of the anomaly, i.e. if it was a true positive or false positive. They also have the ability to flag true negatives where they believe there was an anomaly, but none were detected. Importantly, the support engineers can augment their validations using a rating representing their certitude. Likewise, in the case of a true positive they can rate how much they think the list of top-k indicators were representative of the anomaly. Finally, this feedback is used for reducing false positives by improving the models and tuning the post-processing hyperparameters. It also helps building a rich anomaly signature database which in turn improves the explainability aspects of the framework.
3 Demonstration
We demonstrate the interactive interface using nonconfidential data and allow users to act as support engineers. Users can select different systems and display their corresponding anomalies. They can view the list of top-k indicators and the list of similar historic anomalies. The users can also perform manual analysis for validating these anomalies and then provide their validation and feedback. Finally, we demonstrate the deployment of the deep learning back-end, explaining the approach and walking through all the steps described in Sections 2.1 and 2.2.
@inproceedings{ijcai2020p752,
  title     = {An Anomaly Detection and Explainability Framework using Convolutional Autoencoders for Data Storage Systems},
  author    = {Assaf, Roy and Giurgiu, Ioana and Pfefferle, Jonas and Monney, Serge and Pozidis, Haris and Schumann, Anika},
  booktitle = {Proceedings of the Twenty-Ninth International Joint Conference on
               Artificial Intelligence, {IJCAI-20}},
  publisher = {International Joint Conferences on Artificial Intelligence Organization},
  editor    = {Christian Bessiere},
  pages     = {5228--5230},
  year      = {2020},
  month     = {7},
  note      = {Demos},
  doi       = {10.24963/ijcai.2020/752},
  url       = {https://doi.org/10.24963/ijcai.2020/752},
}
TY - CPAPER TI - An Anomaly Detection and Explainability Framework using Convolutional Autoencoders for Data Storage Systems AU - Assaf, Roy AU - Giurgiu, Ioana AU - Pfefferle, Jonas AU - Monney, Serge AU - Pozidis, Haris AU - Schumann, Anika T2 - Proceedings of the Twenty-Ninth International Joint Conference on Artificial Intelligence, IJCAI-20 PB - International Joint Conferences on Artificial Intelligence Organization PY - 2020 SP - 5228 EP - 5230 DO - 10.24963/ijcai.2020/752 UR - https://doi.org/10.24963/ijcai.2020/752 ER -Copied
Machine-readable versions of this paper, for tools and AI agents:





