
Graph Filter-based Multi-view Attributed Graph Clustering
Proceedings of the Thirtieth International Joint Conference on Artificial Intelligence. Main Track. Pages 2723-2729.
https://doi.org/10.24963/ijcai.2021/375
Keywords
- Data Mining: Clustering
- Machine Learning: Clustering
- Machine Learning: Unsupervised Learning
- Machine Learning: Multi-instance; Multi-label; Multi-view learning
Abstract
Graph clustering has become an important research topic due to the proliferation of graph data. However, existing methods suffer from two major drawbacks. On the one hand, most methods can not simultaneously exploit attribute and graph structure information. On the other hand, most methods are incapable of handling multi-view data which contain sets of different features and graphs. In this paper, we propose a novel Multi-view Attributed Graph Clustering (MvAGC) method, which is simple yet effective. Firstly, a graph filter is applied to features to obtain a smooth representation without the need of learning the parameters of neural networks. Secondly, a novel strategy is designed to select a few anchor points, so as to reduce the computation complexity. Thirdly, a new regularizer is developed to explore high-order neighborhood information. Our extensive experiments indicate that our method works surprisingly well with respect to state-of-the-art deep neural network methods. The source code is available at https://github.com/sckangz/MvAGC.
- [Cai and Chen, 2015] D. Cai and X. Chen. Large scale spectral clustering via landmark-based sparse represen- tation. IEEE Transactions on Cybernetics, 45(8):1669- 1680, 2015.
- [Cao et al., 2015] Shaosheng Cao, Wei Lu, and Qiongkai Xu. Grarep: Learning graph representations with global structural information. In CIKM, pages 891-900, 2015.
- [Chang and Blei, 2009] Jonathan Chang and David Blei. Re- lational topic models for document networks. In Artificial Intelligence and Statistics, pages 81-88, 2009.
- [Cheng et al., 2020] Jiafeng Cheng, Qianqian Wang, Zhiqiang Tao, Deyan Xie, and Quanxue Gao. Multi-view attribute graph convolution networks for clustering. In IJCAI, 2020. IJCAI
- [Errica et al., 2019] Federico Errica, Marco Podda, Davide Bacciu, and Alessio Micheli. A fair comparison of graph neural networks for graph classification. In ICLR, 2019.
- [Fan et al., 2020] Shaohua Fan, Xiao Wang, Chuan Shi, Emiao Lu, Ken Lin, and Bai Wang. One2multi graph au- toencoder for multi-view graph clustering. In WWW, pages 3070-3076, 2020.
- [Guo et al., 2018] Ting Guo, Shirui Pan, Xingquan Zhu, and Chengqi Zhang. Cfond: consensus factorization for co- clustering networked data. IEEE Transactions on Knowl- edge and Data Engineering, 31(4):706-719, 2018.
- [Kang et al., 2020a] Zhao Kang, Haiqi Pan, Steven C.H. Hoi, and Zenglin Xu. Robust graph learning from noisy data. IEEE Transactions on Cybernetics, 50(5):1833- 1843, 2020.
- [Kang et al., 2020b] Zhao Kang, Wangtao Zhou, Zhitong Zhao, Junming Shao, Meng Han, and Zenglin Xu. Large- scale multi-view subspace clustering in linear time. In AAAI, volume 34, pages 4412-4419, 2020.
- [Kang et al., 2021] Zhao Kang, Zhiping Lin, Xiaofeng Zhu, and Wenbo Xu. Structured graph learning for scalable sub- space clustering: From single-view to multi-view. IEEE Transactions on Cybernetics, 2021.
- [Kim et al., 2006] Su-Yeon Kim, Tae-Soo Jung, Eui-Ho Suh, and Hyun-Seok Hwang. Customer segmentation and strat- egy development based on customer lifetime value: A case study. Expert systems with applications, 31(1):101-107, 2006.
- [Kipf and Welling, 2016] Thomas N Kipf and Max Welling. Variational graph auto-encoders. arXiv preprint arXiv:1611.07308, 2016.
- [Liu et al., 2017] Weiyi Liu, Pin-Yu Chen, Sailung Yeung, Toyotaro Suzumura, and Lingli Chen. Principled mul- tilayer network embedding. In 2017 IEEE International Conference on Data Mining Workshops (ICDMW), pages 134-141. IEEE, 2017.
- [Ma et al., 2020] Zhengrui Ma, Zhao Kang, Guangchun Luo, Ling Tian, and Wenyu Chen. Towards clustering- friendly representations: Subspace clustering via graph fil- tering. In Proceedings of the 28th ACM International Con- ference on Multimedia, pages 3081-3089, 2020.
- [Mikolov et al., 2013] Tomas Mikolov, Ilya Sutskever, Kai Chen, Greg S Corrado, and Jeff Dean. Distributed rep- resentations of words and phrases and their composition- ality. In NIPS, pages 3111-3119, 2013.
- [Nie et al., 2017] Feiping Nie, Jing Li, Xuelong Li, et al. Self-weighted multiview clustering with multiple graphs. In IJCAI, pages 2564-2570, 2017. IJCAI
- [Pan et al., 2018] Shirui Pan, Ruiqi Hu, Guodong Long, Jing Jiang, Lina Yao, and Chengqi Zhang. Adversarially regu- larized graph autoencoder for graph embedding. In IJCAI, pages 2609-2615, 2018. IJCAI
- [Qu et al., 2017] Meng Qu, Jian Tang, Jingbo Shang, Xiang Ren, Ming Zhang, and Jiawei Han. An attention-based collaboration framework for multi-view network represen- tation learning. In CIKM, pages 1767-1776, 2017.
- [Salehi and Davulcu, 2020] A. Salehi and H. Davulcu. Graph attention auto-encoders. In 2020 IEEE 32nd Inter- national Conference on Tools with Artificial Intelligence (ICTAI), pages 989-996, 2020.
- [Schaeffer, 2007] Satu Elisa Schaeffer. Survey: Graph clus- tering. Computer Science Review, 1(1):27-64, 2007.
- [Shchur et al., 2018] Oleksandr Shchur, Maximilian Mumme, Aleksandar Bojchevski, and Stephan Günnemann. Pitfalls of graph neural network evalu- ation. In Relational Representation Learning Workshop, NeurIPS, 2018.
- [Shi et al., 2018] Yu Shi, Fangqiu Han, Xinwei He, Xinran He, Carl Yang, Jie Luo, and Jiawei Han. mvn2vec: Preser- vation and collaboration in multi-view network embed- ding. arXiv preprint arXiv:1801.06597, 2018.
- [Tang et al., 2015] Jian Tang, Meng Qu, Mingzhe Wang, Ming Zhang, Jun Yan, and Qiaozhu Mei. Line: Large- scale information network embedding. In WWW, page 1067-1077, 2015.
- [Wang et al., 2015] Meng Wang, Chaokun Wang, Jeffrey Xu Yu, and Jun Zhang. Community detection in social net- works: an in-depth benchmarking study with a procedure- oriented framework. VLDB, 8(10):998-1009, 2015.
- [Wang et al., 2017] Chun Wang, Shirui Pan, Guodong Long, Xingquan Zhu, and Jing Jiang. Mgae: Marginalized graph autoencoder for graph clustering. In CIKM, pages 889- 898, 2017.
- [Wang et al., 2019] Chun Wang, Shirui Pan, Ruiqi Hu, Guodong Long, Jing Jiang, and Chengqi Zhang. At- tributed graph clustering: a deep attentional embedding approach. In IJCAI, pages 3670-3676. AAAI Press, 2019. IJCAI
- [Xia et al., 2014] Rongkai Xia, Yan Pan, Lei Du, and Jian Yin. Robust multi-view spectral clustering via low-rank and sparse decomposition. In AAAI, 2014.
- [Xu et al., 2019] Keyulu Xu, Weihua Hu, Leskovec Jure, and Jegelka Stefanie. How powerful are graph neural net- works? In ICLR, 2019.
- [Zhang et al., 2018] Hongming Zhang, Liwei Qiu, Lingling Yi, and Yangqiu Song. Scalable multiplex network em- bedding. In IJCAI, volume 18, pages 3082-3088, 2018. IJCAI
- [Zhang et al., 2019] Xiaotong Zhang, Han Liu, Qimai Li, and Xiao-Ming Wu. Attributed graph clustering via adap- tive graph convolution. In IJCAI, pages 4327-4333. AAAI Press, 2019. IJCAI
- [Zhu et al., 2019] Qikui Zhu, Bo Du, and Pingkun Yan. Multi-hop convolutions on weighted graphs. arXiv preprint arXiv:1911.04978, 2019.
References were extracted automatically from the PDF and may contain errors.
Full text extracted automatically from the PDF; figures, tables and equations may differ. The PDF is the version of record.
1 Introduction
As the size and scope of graph data has grown, there has been a corresponding surge of interest in graph-based machine learning methods. Graph clustering, as a branch of unsupervised learning, is aiming at dividing the graph nodes into several disjoint groups, such that each group belongs to a class [Schaeffer, 2007]. Graph clustering has exhibited significant performance in community detection [Wang et al., 2015], group segmentation [Kim et al., 2006] and many others. In practice, real-world data tend to be complex, which include both node attributes and structural relationship between different vertexes. In order to exploit the rich information from the structure and features, [Pan et al., 2018; Wang et al., 2019] employ a graph embedding framework, [Guo et al., 2018] proposes a co-clustering technique, and [Chang and Blei, 2009] develops a relational topic method to solve this problem. However, they mainly focus on the sparse original graphs, which can not effectively leverage the underlying information. Besides, these methods are unable to deal with multi-view data.
∗Corresponding author
Nowadays, most graph data are typically multi-modal and multi-relational [Qu et al., 2017]. In other words, the nodes consist of several feature matrix and each node is interacting with others through multiple types of relationships. Taking academic network as an example, one graph view represents the co-paper relationship, while another graph describes the co-author relationship; authors themselves also have multiple features, such as research fields, citation and representative words. It is desirable to fully exploit the complementary information in different views.
Existing multi-view learning methods can be roughly classified into two categories. One type of methods integrate multiple graphs into a consensus graph and then adopt a singleview algorithm [Nie et al., 2017]. Another group of methods learn a sparse and compact representation via graph embedding techniques [Zhang et al., 2018; Liu et al., 2017; Shi et al., 2018], and then classical clustering methods are applied. However, they mainly concentrate on one type of information and ignore the other.
Recently, inspired by the success of graph neural networks (GNNs), two methods are purposely developed for multiview attributed graph clustering task. One2Multi [Fan et al., 2020] adopts maximum modularity strategy to select the most informative graph view, and then applies clustering technique to the embeddings of this view. By contrast, MAGCN [Cheng et al., 2020] tends to deal with data consisting of two sets of features and a single graph. As a result, they are only evaluated on either multiple graphs or two-view feature data. Thus, it is still not straightforward for them to deal with data consisting multiple sets of features and graphs. In fact, GNNs perform poorly when the graph is incomplete or noisy. In addition, GNNs lack interpretability and their performance could be inflated due to over-engineering [Errica et al., 2019].
To overcome the above drawbacks, we propose a novel clustering method for multi-view attributed graph data, which works surprisingly well. First, we use graph filtering rather than deep neural networks to obtain a good feature representation. Second, we design a node sampling strategy using the importance of nodes to construct an anchor matrix, based on which a smaller graph is learned for clustering. Third, we design a regularizer to flexibly explore the high-order neighborhood information hidden in original graphs. We hope this simple method will motivate people to investigate other alternatives facing the systematic use of deep learning methods.
Notations Define a non-directed graph as G = {V,E1, · · · ,EV ,X1 , · · · ,XV }, where V denotes the set of n nodes, evi,j ∈ Ev represents the relationship between node i and j in the v-th view, and Xv = {xv1 , · · · , xvn }⊤ ∈ Rn×dv denotes the attribute matrix in the v-th view. The structure information can be denoted by V adjacency matrices { ˜ Av }V v=1 , ˜ Av = {˜avij } ∈ Rn×n , ˜avij = 1 if there is an edge between node i and j and 0 otherwise. Based on degree matrix Dv, symmetrically normalized affinity matrix Av is defined as D- 12 v ( ˜ Av + I)D- 12 v and graph Laplacian is Lv = Dv -Av.
2 Methodology
For notation convenience, we first discuss in the context of single view scenario. Real-world signal is often smooth and the success of GNNs is mainly attributed to the effect of low-pass filtering [Xu et al., 2019]. Therefore, graph filtering from classical signal processing is an alternative way for representation learning [Ma et al., 2020]. By treating ddimensional data points as d graph signals, a k-order graph filter can be applied to data matrix X as:
where k is a non-negative integer. The resulting ¯X represents a smoothed representation. Clustering assumes that nearby nodes are more likely lying in the same cluster. Thus, ¯X will facilitate the subsequent clustering task.
Rather than directly applying ¯X for spectral clustering [Zhang et al., 2019], we utilize the self-expressiveness property of data [Kang et al., 2021], i.e., each data point can be expressed as a linear combination of others and combination coefficient assesses the similarity between any two points, to learn a similarity graph. This mitigates the bias introduced by hand-crafted similarity metric [Kang et al., 2020a]. Mathematically, this problem can be modeled as:
where α > 0 is a trade-off parameter and Z ∈ Rn×n is the similarity graph matrix. The first term measures the reconstruction error and the second term is a regularization term to avoid trivial solution, e.g., the nuclear norm, sparse ℓ1 norm. The shortcoming of Eq.(2) is that Z fails to explicitly encapsulate the original graph topology.
In this paper, we design a novel regularizer to further explore the structure information of A. A only characterizes the first-order neighborhood information and it is desirable to extract the neighborhood information at different orders. For example, a two-step random walk between two nodes depicts the second-order relation between them. The number of common neighbors determines the probability value. Similarly, a random walk from one node to another with P steps characterizes P-order proximity [Cao et al., 2015], which can be written as:
We then define f(A) by adding different orders of neighborhood information, i.e., f(A) = A + A2 + · · · + AP . The order P will be discussed in the experiment. It is reasonable to assume that the optimal Z is potentially a small shift from f(A). Then, (2) can be further formulated as:
Based on Z, spectral clustering can be applied to achieve final clustering results. However, its O(n3 ) computational complexity and memory usage impede the large-scale deployment.
To address the above challenge, instead of using all samples to reconstruct ¯X in (4), we only choose m(m ≪ n) representative points [Kang et al., 2020b], i.e., nodes that play an important role in the graph, whose attributes construct B = [b1, · · · , bm] ∈ Rd×m. In other words, B is a subset of ¯X. Correspondingly, we learn a smaller similarity graph S ∈ Rm×n , which characterizes the similarities between n nodes and m anchors. According to the indexes of anchors, we can extract the complex structure relationships between nodes and anchors from f(A), which is denoted by C ∈ Rm×n . Hence, our single view attributed graph clustering model becomes:
For multi-view data, all views share the same S to admit a unique cluster pattern. Nevertheless, different views contribute differently. Thus, we introduce a weighting mechanism to address this problem. Eventually, our proposed Multi-view Attributed Graph Clustering (MvAGC) model is formulated as:
where λv is the weight parameter for v-th view, w < 0 is a smooth parameter, Bv denotes the anchors of v-th view, and C v is extracted from f(Av).
2.1 Optimization Strategy
The variables in Eq.(6) are coupled, so we adopt the alternating optimization strategy to solve them.
Fix λv , Update S
When λv is fixed, we set the first-order derivative of Eq.(6) with respect to S to zero. It yields
Algorithm 1 MvAGC
Input: Node set V, adjacency matrix ˜ A1, · · · , ˜ AV , feature matrix X1 , · · · ,XV , parameters k, α, P, w, cluster number g.
Output: g partitions
- 1: Perform graph filtering as (1) and compute f(A).
- 2: Choose m anchors and denote their indexes as ind.
- 3: Use the ind to choose m rows from ¯Xv and f(Av ), which construct Bv and C v respectively.
- 4: while convergence condition does not meet do
- 5: Update matrix S in Eq.(7)
- 6: Update λv in Eq.(9)
- 7: end while
- 8: Normalize S by ˆ S = H- 12 S, where diagonal matrix H has entry Hii = ∑nj=1 Sij .
- 9: Compute the first g eigenvectors of ˆ S ˆ S⊤, represented by U. Correspondingly, its eigenvalues are denoted by Σ2 .
- 10: Compute V ⊤ = Σ-1U ⊤ ˆ S.
- 11: Apply K-means to V .
Fix S, Update λv
For convenience sake, we denote ‖ ¯Xv⊤ - Bv S‖2F + α‖S - C v ‖2F as j v . When S is fixed, our objective function becomes
The solution of λv can be easily obtained by setting its firstorder derivative to zero, which yields
After obtaining S, we can construct the similarity graph Z = S⊤S, based on which we can compute L and apply spectral clustering to obtain the eigenvector matrix W. Nevertheless, we could not afford to take O(n3 ) time and have to proceed with a different approach.
We first normalize S by defining ˆ S = H-1/2S, where diagonal matrix H is the row sum of S. Denote the singular value decomposition (SVD) of ˆ S as UΣV ⊤, where Σ = diag(σ1, · · · , σm) and 0 ≤ σm ≤ · · · ≤ σ2 ≤ σ1 are the singular values, U = [u1, · · · , um] ∈ Rm×m and V = [v1, · · · , vm] ∈ Rn×m are the left and right singular vectors. It can be shown that V are also the eigenvectors of Z, U are the eigenvectors of ˆ S ˆ S⊤, and σ2 i are the eigenvalues [Cai and Chen, 2015]. Thus, we can compute U based on ˆ S ˆ S⊤ with O(m3 ) time. V is easily obtained as V ⊤ = Σ-1U ⊤ ˆ S. Finally, we apply K-means on V to obtain the clustering results. The complete procedures of MvAGC is outlined in Algorithm 1.
2.2 Time Complexity
In Eq.(7), the inverse operation takes O(m3 ) and the other matrix operations in the v-th view take O(m2 (n + dv + 1) + mn(dv + 1)). For t iterations, it costs O(m3V t +
V can be achieved in O(m3 ) and O(m2n) respectively. The cost of the K-means is O(mngt1), where t1 denotes the iteration number. It can be seen that the time complexity is linear with respect to n.
2.3 Anchor Selecting Strategy
Classical anchor selection strategy mainly adopt K-means or random sampling. They treat each node equally, which is in contradiction with graph data. We choose anchors based on the importance of nodes and define q : V → R+ as the importance measure function. Inspired by word sampling method in NLP [Mikolov et al., 2013], we set the probability to pick each node i ∈ V as the first element of anchor set M as:
where γ > 0, which helps sharpening (γ > 1) or smoothing (γ < 1) the distribution. We then sample m-1 distinct nodes without replacement. More concretely, each remaining node i ∈ V\M is picked with a probability pi/ ∑j/∈M pj as the second anchor, and so on until |M| = m. The denominator is a normalization factor and ensures ∑j /∈M pj = 1 at each sampling step. In our experiments, we use the total degree of each node to depict its importance, which is simply the sum of connection number of each node in each view, i.e.,
which is very efficient.
3 Experiment
3.1 Datasets
To demonstrate the effectiveness of our method, we select five benchmark datasets to evaluate the performance. Among them, ACM, DBLP, and IMDB [Fan et al., 2020] consist of one feature matrix and multiple graphs. Amazon Photo and Amazon Computer [Shchur et al., 2018] consist of one feature matrix and one graph. Following [Cheng et al., 2020], we use Cartesian product to build the second feature matrix. Table 1 shows the details of above five datasets.
3.2 Experimental Setup
To have a comprehensive evaluation, we compare MvAGC with a number of representative methods, which vary from single view to multi-view, shallow to deep methods. In particular, LINE [Tang et al., 2015] and GAE [Kipf and Welling, 2016] are two classical single view method for graph processing. LINE-avg and GAE-avg simply average the node representations learned from each view. MNE [Zhang et al., 2018] and PMNE [Liu et al., 2017] are multi-view network embedding methods. RMSC [Xia et al., 2014] is a robust multiview spectral clustering based on Markov chain. PwMC and SwMC [Nie et al., 2017] introduce weighting mechanisms to cluster multi-view data. O2MAC and O2MA [Fan et al., 2020] are attributed multi-view graph clustering methods based on graph auto-encoder. MAGCN [Cheng et al., 2020] is a multi-view attributed graph convolution network.
| Dataset | ACM | DBLP | IMDB | Amazon Photo | Amazon Computer |
|---|---|---|---|---|---|
| Node # | 3025 | 4057 | 4780 | 7487 | 13381 |
| Feature # in each view | 1830 | 334 | 1232 | 745 | 767 |
| - | - | - | 7487 | 13381 | |
| Edge # in each view | co-paper (29,281) | co-author (11,113) | co-actor (98,010) | co-purchase(119043) | co-purchase(245778) |
| co-subject (2,210,761) | co-conf (5,000,495) | co-director (21,018) | - | - | |
| - | co-term (6,776,335) | - | - | - | |
| Cluster # | 3 | 4 | 3 | 8 | 10 |
| ACM | DBLP | IMDB | ||||||||||
|---|---|---|---|---|---|---|---|---|---|---|---|---|
| method | ACC | F1 | NMI | ARI | ACC | F1 | NMI | ARI | ACC | F1 | NMI | ARI |
| LINE | 0.6479 | 0.6594 | 0.3941 | 0.3433 | 0.8689 | 0.8546 | 0.6676 | 0.6988 | 0.4268 | 0.287 | 0.0031 | -0.009 |
| LINE-avg | 0.6479 | 0.6594 | 0.3941 | 0.3433 | 0.875 | 0.866 | 0.6681 | 0.7056 | 0.4719 | 0.2985 | 0.0063 | -0.009 |
| GAE | 0.8216 | 0.8225 | 0.4914 | 0.5444 | 0.8859 | 0.8743 | 0.6925 | 0.741 | 0.4298 | 0.4062 | 0.0402 | 0.0473 |
| GAE-avg | 0.699 | 0.7025 | 0.4771 | 0.4378 | 0.5558 | 0.5418 | 0.3072 | 0.2577 | 0.4442 | 0.4172 | 0.0413 | 0.0491 |
| MNE | 0.637 | 0.6479 | 0.2999 | 0.2486 | - | - | - | - | 0.3958 | 0.3316 | 0.0017 | 0.0008 |
| PMNE(n) | 0.6936 | 0.6955 | 0.4648 | 0.4302 | 0.7925 | 0.7966 | 0.5914 | 0.5265 | 0.4958 | 0.3906 | 0.0359 | 0.0366 |
| PMNE(r) | 0.6492 | 0.6618 | 0.4063 | 0.3453 | 0.3835 | 0.3688 | 0.0872 | 0.0689 | 0.4697 | 0.3183 | 0.0014 | 0.0115 |
| PMNE(c) | 0.6998 | 0.7003 | 0.4775 | 0.4431 | - | - | - | - | 0.4719 | 0.3882 | 0.0285 | 0.0284 |
| RMSC | 0.6315 | 0.5746 | 0.3973 | 0.3312 | 0.8994 | 0.8248 | 0.7111 | 0.7647 | 0.2702 | 0.3775 | 0.0054 | 0.0018 |
| PwMC | 0.4162 | 0.3783 | 0.0332 | 0.0395 | 0.3253 | 0.2808 | 0.019 | 0.0159 | 0.2453 | 0.3164 | 0.0023 | 0.0017 |
| SwMC | 0.3831 | 0.4709 | 0.0838 | 0.018 | 0.6538 | 0.5602 | 0.376 | 0.38 | 0.2671 | 0.3714 | 0.0056 | 0.0004 |
| O2MA | 0.888 | 0.8894 | 0.6515 | 0.6987 | 0.904 | 0.8976 | 0.7257 | 0.7705 | 0.4697 | 0.4229 | 0.0524 | 0.0753 |
| O2MAC | 0.9042 | 0.9053 | 0.6923 | 0.7394 | 0.9074 | 0.9013 | 0.7287 | 0.778 | 0.4502 | 0.4159 | 0.0421 | 0.0564 |
| MvAGC | 0.8975 | 0.8986 | 0.6735 | 0.7212 | 0.9277 | 0.9225 | 0.7727 | 0.8276 | 0.5633 | 0.3783 | 0.0371 | 0.0940 |
We adopt four widely used metrics: Accuracy(ACC), Normalized Mutual Information(NMI), F1-score(F1), Adjusted Rand Index(ARI). To have a fair comparison, we adopt the parameter settings in O2MAC [Fan et al., 2020] for other comparison methods on DBLP, IMDB and ACM. For Amazon Photo and Amazon Computer, we only compare with MAGCN, which has reported better performance than many others, including MGAE [Wang et al., 2017], ARVGAE [Pan et al., 2018], DAEGA [Wang et al., 2019], and GATE [Salehi and Davulcu, 2020]. For our MvAGC, we set f (A) = A+A2 and tune the parameters to obtain the best results.
3.3 Clustering Results
Tables 2 and 3 show the results. For most measures, our method outperforms baseline methods on DBLP, IMDB, Amazon Photo and Amazon Computer. For ACM, our method surpasses O2MA and is comparable to O2MAC. In particular, we have the following observations. First, applying single view method to multi-view data leads to poor performance. This validates the significance of developing multi-view method to fully exploit the complementary information. Second, MvAGC outperforms existing multiview methods, including MNE, PMNE, RMSC, PwMC and SwMC. Though they take all graphs into consideration, they fail to explore the attribute information. By contrast, MvAGC leverages both feature and graph structure information. Third, MvAGC beats MAGCN by a wide margin. This could be because our method adopts self-expressiveness to explore global structure and incorporates second-order information.
| DataBase | Info | Amazon Photo | Amazon Computer | ||||||
|---|---|---|---|---|---|---|---|---|---|
| Metric | ACC | F1 | NMI | ARI | ACC | F1 | NMI | ARI | |
| MAGCN-view1 | Graph, X1 | 0.3922 | 0.359 | 0.254 | 0.345 | 0.3496 | 0.353 | 0.174 | 0.1275 |
| MAGCN-view2 | Graph, X2 | 0.312 | 0.3369 | 0.1474 | 0.05 | - | - | - | - |
| MvAGC-view1 | Graph, X1 | 0.6249 | 0.5743 | 0.4941 | 0.4153 | 0.5039 | 0.5104 | 0.438 | 0.2943 |
| MvAGC-view2 | Graph, X2 | 0.6169 | 0.5743 | 0.4786 | 0.3421 | 0.4701 | 0.3754 | 0.3628 | 0.2729 |
| MAGCN | Graph, X1 ,X2 | 0.5167 | 0.4736 | 0.3897 | 0.2401 | - | - | - | - |
| MvAGC | Graph, X1 ,X2 | 0.6775 | 0.6397 | 0.5237 | 0.3968 | 0.5796 | 0.4117 | 0.3957 | 0.3224 |
| Method | ACMDBLP | IMDB | Amazon PhotoAmazon | Computer | |
|---|---|---|---|---|---|
| O2MAC | 524.8 | 5163.4 | 4555.24 | - | - |
| MAGCN | - | - | - | 3783.6 | - |
| MvAGC | 5.8 | 5.19 | 10.38 | 72.22 | 215.33 |
3.4 Time Comparison
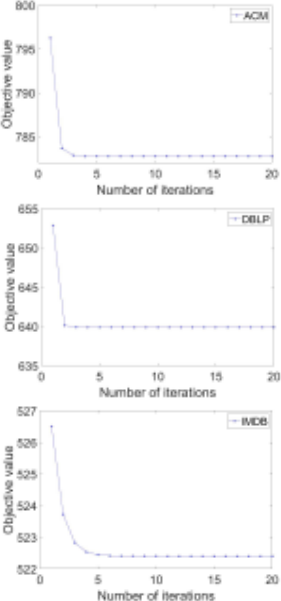
It is known that training deep neural networks is often timeconsuming. Therefore, we compare the running time of our method with the most competitive O2MAC and MAGCN methods in Table 4. All methods are conducted on the same machine with an Intel(R) Core(TM) i7-6800k 3.40GHZ CPU, an GeForce GTX 1080 Ti GPU and 32GB RAM. As expected, our method is orders of magnitude faster than competitors. MAGCN encounters an out-of-memory error on Amazon Computer, which demonstrates that our method is also memory efficient. The evolution of objective value on ACM, DBLP, IMDB is depicted in Fig.1. We can find that our method converges within 10 iterations, which also proves the efficiency of our method.
| Dataset | Input View | Method | ACC F1 | NMI | ARI |
|---|---|---|---|---|---|
| ACM | co-paper | AGC | 0.8342 0.833 | 0.5488 | 0.5741 |
| MvAGC | 0.8813 0.8733 | 0.4680 | 0.5799 | ||
| co-subject | AGC | 0.7044 0.68 | 0.4881 | 0.4516 | |
| MvAGC | 0.7276 0.6227 | 0.1287 | 0.1645 | ||
| DBLP | co-term | AGC | 0.5405 0.5345 | 0.2251 | 0.1785 |
| MvAGC | 0.7468 0.7140 | 0.1495 | 0.2344 | ||
| co-conf | AGC | 0.9006 0.8949 | 0.7134 | 0.7625 | |
| MvAGC | 0.9206 0.9098 | 0.6122 | 0.7037 | ||
| co-author | AGC | 0.6364 0.6406 | 0.3342 | 0.2771 | |
| MvAGC | 0.8932 0.8671 | 0.4553 | 0.5144 | ||
| IMDB | co-actor | AGC | 0.5403 0.2525 | 0.0009 | 0.0024 |
| MvAGC | 0.5416 0.4180 | 0.0235 | -0.0377 | ||
| co-director | AGC | 0.533 0.3044 | 0.006 | 0.026 | |
| MvAGC | 0.5736 0.4179 | 0.0271 | -0.0536 |
3.5 Parameter Analysis
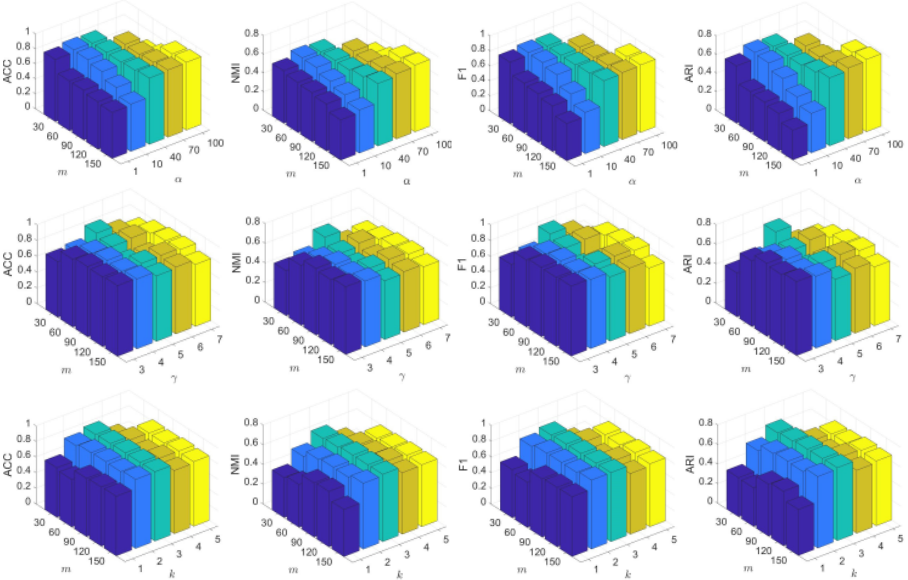
Compared with deep learning methods, our method only has several parameters to tune, including the balance parameter α, sampling parameter γ, filter order k, number of anchors m, weight parameter w. We found that w has little influence to the results, so we set -3 for all experiments. Taking DBLP for example, we show the results under different parameters in Fig.2. For each plot, we fix two parameters and vary the others. We find that a small m could result in sub-optimal performance, which is reasonable since too few anchors can not well represent the whole nodes. α is also data-specific since it seeks a balance between feature and structure information. Neither a small value nor a large one is appropriate. Besides, it is obvious that the performance is not sensitive to γ, thus we can fix it. Additionally, we can observe that k = 3 is good enough to ensure promising results. When k increases, the performance could decrease because a large k could cause over-smoothing and make the nodes difficult to distinguish.
4 Ablation Study
In this section, we conduct several experiments to examine the effectiveness of each component in our model, including the superiority of graph learning, the advantage of graph filtering, and the influence of high-order information.
- AGC [Zhang et al., 2019] is a recent single view attributed graph clustering method, which learns a good representation through graph filtering. However, it uses inner product to compute similarity for spectral clustering. To prove the superiority of our graph learning approach, we list the clustering results of AGC and MvAGC on each view in Table 5. It is clear that our method outperforms AGC in most cases and the improvement is significant. This indicates that our automatic approach will be more reliable and stable in practice. We also find that the performance on different views varies significantly. Therefore, each view contributes differently and a weighting mechanism is crucial to balance different views. Furthermore, the performance of MvAGC on each view is indeed inferior to that in Table 2. This validates the advantage of multi-view model.
- To see the effect of graph filtering, we replace ¯Xv⊤ with Xv⊤ in (6) and denote the model as Baseline. Comparing the results of Baseline in Table 6 with that of MvAGC in Table 2, we can see that MvAGC consistently outperforms the Baseline. This verifies the advantage of representation learning via graph filtering.
- To analyze the importance of high-order information, we test different orders of f(A), including f(A) = A, f(A) = A+A2 , f(A) = A+A2 +A3 . With respect to
first-order f(A), high-order neighborhood information improves by 29.53% on average in Table 6. By contrast, third-order f(A) deteriorates the performance a little bit on ACM and DBLP. This is perhaps caused by the way we compute high-order information. Computing it directly from affinity matrices could destroy the relationship between nodes and produce redundant information [Zhu et al., 2019]. At least, second-order information improve the performance.
| Dataset | Method | ACC | F1 | NMI | ARI |
|---|---|---|---|---|---|
| ACM | Baseline | 0.6674 | 0.6674 | 0.2424 | 0.2698 |
| f(A) = A | 0.8846 | 0.8860 | 0.6438 | 0.6910 | |
| f(A) = A+A2 | 0.8975 | 0.8986 | 0.6735 | 0.7212 | |
| f (A) = A + A2 + A3 | 0.8753 | 0.8769 | 0.6262 | 0.6686 | |
| DBLP | Baseline | 0.5639 | 0.5570 | 0.2513 | 0.1634 |
| f(A) = A | 0.9211 | 0.9163 | 0.7568 | 0.8109 | |
| f(A) = A+A2 | 0.9277 | 0.9225 | 0.7727 | 0.8276 | |
| f(A) = A+A2 +A3 | 0.9243 | 0.9196 | 0.7678 | 0.817 | |
| IMDB | Baseline | 0.5462 | 0.2367 | 0.0099 | 0.0004 |
| f(A) = A | 0.5608 | 0.3329 | 0.0273 | 0.0474 | |
| f(A) = A+A2 | 0.5633 | 0.3783 | 0.0371 | 0.0940 | |
| f (A) = A + A2 + A3 | 0.5746 | 0.4250 | 0.0647 | 0.1279 |
5 Conclusion
In this paper, we propose a novel graph filter-based multiview attributed graph clustering model. It is able to efficiently cluster large-scale multi-view attributed graph data. Our method employs the classical graph filtering to facilitate the subsequent graph learning and extracts high-order neighborhood information. The learned graph integrates both the attribute and structure information in a smart way. Comprehensive experimental results based on five graph benchmark datasets demonstrate state-of-the-art performance being achieved, which match or outperform other baselines, including the recent deep learning methods.
Acknowledgments
This work was supported in part by the Natural Science Foundation of China under Grant 61806045 and U19A2059; in part by the National Key Research and Development Program of China under Grant 2018AAA0100204 and 2018YFC0807500.
@inproceedings{ijcai2021p375,
  title     = {Graph Filter-based Multi-view Attributed Graph Clustering},
  author    = {Lin, Zhiping and Kang, Zhao},
  booktitle = {Proceedings of the Thirtieth International Joint Conference on
               Artificial Intelligence, {IJCAI-21}},
  publisher = {International Joint Conferences on Artificial Intelligence Organization},
  editor    = {Zhi-Hua Zhou},
  pages     = {2723--2729},
  year      = {2021},
  month     = {8},
  note      = {Main Track},
  doi       = {10.24963/ijcai.2021/375},
  url       = {https://doi.org/10.24963/ijcai.2021/375},
}
TY - CPAPER TI - Graph Filter-based Multi-view Attributed Graph Clustering AU - Lin, Zhiping AU - Kang, Zhao T2 - Proceedings of the Thirtieth International Joint Conference on Artificial Intelligence, IJCAI-21 PB - International Joint Conferences on Artificial Intelligence Organization PY - 2021 SP - 2723 EP - 2729 DO - 10.24963/ijcai.2021/375 UR - https://doi.org/10.24963/ijcai.2021/375 ER -Copied
Machine-readable versions of this paper, for tools and AI agents:





