
Unsupervised Deep Subgraph Anomaly Detection (Extended Abstract)
Proceedings of the Thirty-Second International Joint Conference on Artificial Intelligence. Sister Conferences Best Papers. Pages 6514-6518.
https://doi.org/10.24963/ijcai.2023/730
Keywords
- Sister Conferences Best Papers: Data Mining
Abstract
Effectively mining anomalous subgraphs in networks is crucial for various applications, including disease outbreak detection, financial fraud detection, and activity monitoring in social networks. However, identifying anomalous subgraphs poses significant challenges due to their complex topological structures, high-dimensional attributes, multiple notions of anomalies, and the vast subgraph space within a given graph. Classical shallow models rely on handcrafted anomaly measure functions, limiting their applicability when prior knowledge is unavailable. Deep learning-based methods have shown promise in detecting node-level, edge-level, and graph-level anomalies, but subgraph-level anomaly detection remains under-explored due to difficulties in subgraph representation learning, supervision, and end-to-end anomaly quantification. To address these challenges, this paper introduces a novel deep framework named Anomalous Subgraph Autoencoder (AS-GAE). AS-GAE leverages an unsupervised and weakly supervised approach to extract anomalous subgraphs. It incorporates a location-aware graph autoencoder to uncover anomalous areas based on reconstruction mismatches and introduces a supermodular graph scoring function module to assign meaningful anomaly scores to subgraphs within the identified anomalous areas. Extensive experiments on synthetic and real-world datasets demonstrate the effectiveness of our proposed method.
- [Ahmed et al., 2016] Mohiuddin Ahmed, Abdun Naser Mahmood, and Jiankun Hu. A survey of network anomaly detection techniques. Journal of Network and Computer Applications, 60:19-31, 2016.
- [Akoglu et al., 2015] Leman Akoglu, Hanghang Tong, and Danai Koutra. Graph based anomaly detection and de- scription: a survey. Data mining and knowledge discovery, 29(3):626-688, 2015.
- [Chandola et al., 2009] Varun Chandola, Arindam Banerjee, and Vipin Kumar. Anomaly detection: A survey. ACM computing surveys (CSUR), 41(3):1-58, 2009.
- [Chen et al., 2017] Feng Chen, Baojian Zhou, Adil Alim, and Liang Zhao. A generic framework for interesting subspace cluster detection in multi-attributed networks. In 2017 IEEE International Conference on Data Mining (ICDM), pages 41-50. IEEE, 2017.
- [Dolhansky and Bilmes, 2016] Brian W Dolhansky and Jeff A Bilmes. Deep submodular functions: Definitions and learning. Advances in Neural Information Processing Systems, 29, 2016.
- [Dou et al., 2020] Yingtong Dou, Zhiwei Liu, Li Sun, Yu- tong Deng, Hao Peng, and Philip S Yu. Enhancing graph neural network-based fraud detectors against camouflaged fraudsters. In Proceedings of the 29th ACM International Conference on Information & Knowledge Management, pages 315-324, 2020.
- [Gupta et al., 2014] Manish Gupta, Arun Mallya, Subhro Roy, Jason HD Cho, and Jiawei Han. Local learning for mining outlier subgraphs from network datasets. In Pro- ceedings of the 2014 SIAM International Conference on Data Mining. SIAM, 2014.
- [Ma et al., 2021] Xiaoxiao Ma, Jia Wu, Shan Xue, Jian Yang, Chuan Zhou, Quan Z Sheng, Hui Xiong, and Leman Akoglu. A comprehensive survey on graph anomaly detec- tion with deep learning. IEEE Transactions on Knowledge and Data Engineering, 2021.
- [Miller et al., 2010] Benjamin Miller, Nadya Bliss, and Patrick J Wolfe. Subgraph detection using eigenvector l1 norms. In Advances in Neural Information Processing Sys- tems, pages 1633-1641. Citeseer, 2010.
- [Peng et al., 2018] Zhen Peng, Minnan Luo, Jundong Li, Huan Liu, and Qinghua Zheng. Anomalous: A joint mod- eling approach for anomaly detection on attributed net- works. In IJCAI, pages 3513-3519, 2018. IJCAI
- [Ruff et al., 2018] Lukas Ruff, Robert Vandermeulen, Nico Goernitz, Lucas Deecke, Shoaib Ahmed Siddiqui, Alexan- der Binder, Emmanuel Müller, and Marius Kloft. Deep one-class classification. In International conference on machine learning. PMLR, 2018.
- [Sharpnack et al., 2013] James Sharpnack, Akshay Krishna- murthy, and Aarti Singh. Near-optimal anomaly detection in graphs using lovász extended scan statistic. In Proceed- ings of the 26th International Conference on Neural Infor- mation Processing Systems-Volume 2, pages 1959-1967, 2013.
- [Wang et al., 2021] Yanling Wang, Jing Zhang, Shasha Guo, Hongzhi Yin, Cuiping Li, and Hong Chen. Decoupling representation learning and classification for gnn-based anomaly detection. In Proceedings of the 44th Interna- tional ACM SIGIR Conference on Research and Develop- ment in Information Retrieval, 2021.
- [Wang et al., 2022] Shiyu Wang, Xiaojie Guo, and Liang Zhao. Deep generative model for periodic graphs. arXiv preprint arXiv:2201.11932, 2022.
- [Zhang and Zhao, 2021] Zheng Zhang and Liang Zhao. Rep- resentation learning on spatial networks. Advances in Neu- ral Information Processing Systems, 34, 2021.
- [Zhou and Paffenroth, 2017] Chong Zhou and Randy C Paf- fenroth. Anomaly detection with robust deep autoen- coders. In Proceedings of the 23rd ACM SIGKDD in- ternational conference on knowledge discovery and data mining, pages 665-674, 2017.
References were extracted automatically from the PDF and may contain errors.
Full text extracted automatically from the PDF; figures, tables and equations may differ. The PDF is the version of record.
1 Introduction
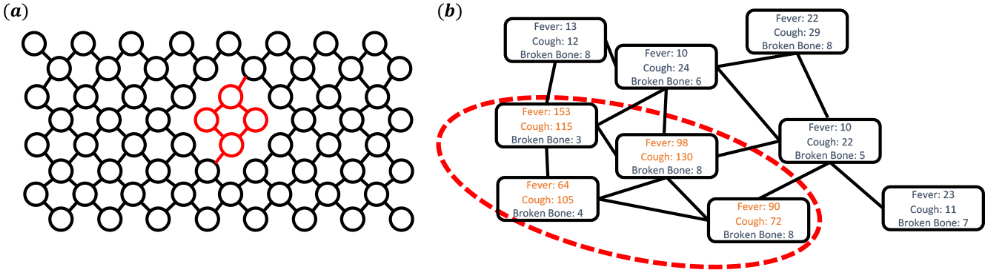
Network data is a popular type of data that describes the properties of discrete objects and their pairwise relationship. Given a network, one of the major tasks in the field of network data mining is the detection of anomalous subgraphs. A subgraph can be defined as an anomaly when its connectivity structure or attributive properties can be described as an outlier in the graph. For example, the significant difference in subgraph topological structure is one type of anomaly subgraph. As shown in Figure 1(a), in a regular lattice material network, one might expect the inserted impurity as an outlier because the topological structure is different from other areas in the graph. Similarly, infectious disease researchers may have an interest in discovering a new unknown infectious disease at the early stage of a disease outbreak (e.g. COVID-19) from the health surveillance network. In normal cases, the count of cases for different disease symptoms should follow a statistical distribution such as the Poisson distribution. As shown in Figure 1(b), a group of connected nodes with significant abnormal symptom attributes may indicate a potential disease outbreak is taking place.
∗ Full version of this paper was originally published at the 2022 IEEE International Conference on Data Mining (ICDM) and received the Best Paper Award.
Existing graph anomaly detection algorithms [Akoglu et al., 2015] can be categorized into traditional shallow methods [Gupta et al., 2014; Chen et al., 2017; Miller et al., 2010; Sharpnack et al., 2013] and deep learning-based method [Ruff et al., 2018; Zhou and Paffenroth, 2017; Peng et al., 2018; Zhang and Zhao, 2021; Wang et al., 2022; Dou et al., 2020; Wang et al., 2021]. Previous shallow approaches to detecting anomaly subgraphs have mainly focused on manually defining anomaly quantification metrics for subgraphs and developing methods to extract anomalous patterns based on the designed measures. Although the ideas behind these shallow methods are simple and intuitive, the shallow mechanisms are suffered from the limited capability of capturing non-linear properties to discriminate complex anomalies from graphs with high-dimensional features and irregular topological structures. More importantly, these methods require prior knowledge to determine the measurement function for detecting anomalies, which are usually unavailable due to the unknown nature of anomaly subgraph patterns in many practical applications [Chandola et al., 2009; Ahmed et al., 2016]. On the other hand, deep learning-based methods, which have received growing attention in recent years [Ma et al., 2021], can extract expressive representations of objects, such as nodes or graphs, to effectively distinguish abnormal and normal objects. Previous works have shown impressive progress in many graph anomaly detection tasks [Ma et al., 2021].
Despite the success in generalizing deep learning techniques to graph anomaly detection problems, most previous works only focus on detecting node- or edge-level anomalies. The task of anomaly subgraph mining has been largely underexplored and has just started to attract attention. However, there is no trivial way to simply apply these methods to accomplish the task of detecting anomalous subgraphs due to several unique challenges: (1) Difficulty in obtaining sufficient training labels in an end-to-end manner without intensive supervision. Deep learning approaches heavily rely on the training objectives to optimize model parameters. For anomalous subgraph detection, this necessitates sufficient training labels and appropriate loss function such that models can effectively discriminate the anomalous patterns. Unfortunately, the training labels are hard to sufficiently obtain due to the exponential possible subgraphs in a given graph, and designing proper objectives for detecting anomalous subgraphs is challenging because there is usually no prior knowledge about the anomalies. (2) Difficulty in preserving both geodesic distance and topological similarity among nodes for representing subgraph anomaly. Existing end-to-end works that consider node- or edge-level cannot be directly used for subgraph-level anomaly detection. For example, within the scope of a given anomaly subgraph, individual nodes or edges might be normal. It only turns out to be anomalous when considered as a group compared to other areas. Merely aggregating node- or edge-level anomaly scores can not reflect the subgraph abnormality. But how to jointly consider intra-subgraph structure and the subgraph's position to the whole graph, is indispensable yet very challenging. (3) Difficulty in quantifying the degree of being abnormal under arbitrary and unknown anomaly types. It is extremely hard to quantify the degree of abnormality for arbitrary patterns of attribute and topological structure of subgraph when a ground truth anomaly type is unknown. Previous shallow methods typically utilize a handcrafted measure function, which is limited by its low expressive power and generalizability to unseen anomalies. Also, existing methods learn the scoring function from scratch, which is usually subject to the exponentially growing search space and can easily lead to overfitting issues.
2 ProblemFormulation
We consider an attributed network as G = (V, E), where V = {v1, v2, . . . , vN} is a set of nodes that N = |V| denotes the number of nodes in the graph and E ⊆ V × V is the set of edges. We also let X ∈ RN×p denotes the node attribute matrix and A ∈ RN×N represents the adjacency matrix. Specifically, the attribute of node vi can be expressed as a p dimensional vector xi ∈ Rp . Aij = 1 denotes there is an edge connecting nodes vi and vj ∈ G, otherwise Aij = 0. A subgraph h of the given G is represented as H = (VH, EH) where VH ⊆ V is a subset of nodes and EH is the corresponding set of edges. XH,AH are the corresponding node attribute and adjacency matrices. With the preliminary notion of the attributed network, we formalize the anomalous subgraph detection problem as follows:
Problem 1. Anomalous subgraph detection. Given a graph G, the task of anomalous subgraph detection is to search for a subgraph H ⊆ G that is most different from the majority of graph, where the degree of being abnormal is quantified by a score function f.
3 Methodology
3.1 Candidate Anomaly Subgraphs Extraction by Location-Aware Graph Autoencoder
In order to correctly reveal the potential contextual anomaly areas, we design a location-aware graph autoencoder to incorporate the locational information of nodes in the network when performing message aggregation. To be specific, we first sample a set of C random anchor nodes VC = {v1, v2, . . . , vC} in the given graph G. Then the shortest distance from each node to anchors, which is denoted as S ∈ RN×C , is calculated and treated as additional node labels. Thus the global location of each node can be inferred from the shortest distances to all anchor nodes (relabeled nodes attributes). The modified location-aware graphautoencoder can capture the dependence properties among nodes when they are located in a close area of the graph.
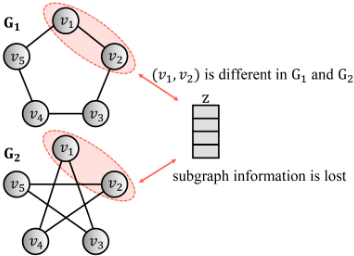
This module plays a critical role in correctly reconstructing the normal areas and uncovering anomalous areas.
Mathematically, given the input graph G, our proposed location-aware autoencoder first maps the adjacency matrix A, node attributes matrix X, and distances to anchors matrix S into the latent representation vectors z ∈ RN×D through location-aware encoder ϕ, where D is the dimension of latent representation and zi ∈ RD is the corresponding latent vector for the node vi. Formally, one convolutional operation of a location-aware encoder can be represented as:
where g(ℓ) , X(ℓ) and W (ℓ) is the graph convolution function, the latent embeddings of nodes, and a trainable weight matrix at layer ℓ, respectively. We take the attribute matrix X as the input of the first layer. Then, we reconstruct both node attributes matrix X′ and adjacency matrix A′ from extracted latent embeddings z by decoder φ.
The residual graph R can then be built upon the mismatch between the original graph G and the reconstructed graph φ(ϕ(G)). We first define the reconstruction error ri of one node vi as:
then the residual graph R is constructed as:
where ER is the corresponding set of edges to the set of nodes VR and τ is a threshold to filter out the nodes.
3.2 Quantifying Anomalous Scores of Subgraphs by Graph Supermodular Function
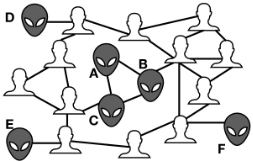
Given the extracted residual graph R from the original graph G by the reconstruction results of the location-aware graph autoencoder, the nodes VR in the residual graph can exhibit as a set of connected components {g|g ⊆ R} where each component g is an induced subgraph of the original graph G. Here a key question is how to evaluate the degree of abnormality of each extracted component in the residual graph. For example in Figure 3, in an online social network, it is more desirable to treat a subgraph of three connected potentially fraudulent users as more anomalous rather than three separate isolated users because they have abnormal neighbors. Therefore, when quantifying the anomaly of a given subgraph, its value needs to be no less than the sum of the anomalies of all its individual partitions. This indicates that the anomaly quantization function should be supermodular.
Given a graph G with a collection of N labeled nodes V = {v1, . . . , vN}, the set of all subgraphs can be represented as H = {H|H ⊆ G}. A graph scoring function f : H → R assigns a real value to any graph H ∈ H. Here suppose H is the subgraph that is induced by set of nodes VH. We also use H+{u} to denote the subgraph which is induced by the set of nodes VH ∪ {u} when {u} /∈ VH. We give the definition of a graph supermodular function as following:
Definition 1. For all Q, H ∈ H that VQ ⊆ VH ⊆ V\{u}, a graph function f(·) is said to be supermodular if and only if
A simplest example of supermodular function on graph can be given as f(G) = |V| + |E|, where |E| denotes the number of edges in graph G.
We then propose a novel deep graph supermodular neural network by extending the previous submodular deep learning model [Dolhansky and Bilmes, 2016]. Specifically, given an input graph G, one updating function of node vi by deep graph supermodular neural network at layer ℓ can be expressed as:
where σ(ℓ) is a non-negative non-decreasing convex function and w(ℓ) is a non-negative weight matrix. The whole deep graph supermodular neural network can be achieved by stacking L layers of updating operation in Equation 5 and a summation operation over all nodes.
| Background graph | Complete | ER random | WS small-world | BA scale-free | ||||
|---|---|---|---|---|---|---|---|---|
| Anomaly type | Dense | Chain | Dense | Chain | Dense | Chain | Dense | Chain |
| L1SUB | 0.557 | 0.533 | 0.861 | 0.511 | 0.521 | 0.486 | 0.963 | 0.503 |
| AMEN | 0.554 | 0.976 | 0.601 | 0.632 | 0.654 | 0.522 | 0.711 | 0.501 |
| DEEPFD | 0.505 | 0.495 | 0.974 | 0.947 | 0.497 | 0.488 | 0.973 | 0.947 |
| DOMINANT | 0.409 | 0.486 | 0.598 | 0.611 | 0.589 | 0.701 | 0.598 | 0.456 |
| DEEPSVDD | 0.953 | 1.000 | 0.489 | 1.000 | 1.000 | 1.000 | 0.475 | 0.981 |
| AS-GAE | 0.976 | 1.000 | 0.984 | 1.000 | 1.000 | 1.000 | 1.000 | 1.000 |
3.3 Unsupervised andWeakly Supervised Learning Objectives of AS-GAE
To optimize the parameters involved in the previously mentioned components location-aware graph autoencoder and supermodular graph scoring function without intense supervision, we first present the objective function of the proposed framework under an unsupervised learning manner. After the training process, the anomalous scores can be given by the function f(g), ∀g ⊆ R. Subgraphs with higher anomaly scores are considered to have a higher probability of being anomalies. The loss function of AS-GAE under an unsupervised setting can be described as
where R is the residual graph and f(·) is the supermodular scoring function. β and γ are two hyperparameters, and ∥·∥ is commonly chosen to be the ℓ2-norm.
4 Experimental Results
Structural Anomaly Synthetic Datasets. We first apply several existing commonly used graph generator models to generate the background graph. In this paper, we investigate four classic graph generators as background graph: (1) Erd¨osR´enyi (ER); (2) Watts-Strogatz (WS); (3) Barab´asi-Albert (BA); and (4) complete graphs. Then a small subgraph with a different structural property is inserted into the background graph as the ground truth anomaly subgraph. We extend previous works [Gupta et al., 2014; Chen et al., 2017] to insert two types of anomaly subgraphs: chain and dense graphs.
Real-World Datasets. To further evaluate the performance of our proposed method and comparison methods in realworld scenarios, nine public real-world attributed network datasets, including four citation network datasets, three social network datasets, one communication dataset, and one materials dataset, are utilized as benchmark datasets in our experiments. We provide a brief description of these realworld datasets as follows:
Effectiveness Results. We compare our proposed method AS-GAE with benchmark methods on both synthetic datasets and real-world datasets in an unsupervised learning manner. The comparison of AUC scores for the structural anomaly synthetic dataset is provided in Table 1, by combinations of different background graphs and inserted anomalous subgraphs.
| Dataset | Cora | Citeseer | Pubmed | OMDB | Blog | Flickr | ACM | Wiki | |
|---|---|---|---|---|---|---|---|---|---|
| Nodes | 1,005 | 2,708 | 3,327 | 19,717 | 1,124 | 5,196 | 7,575 | 16,484 | 8,227 |
| Edges | 25,571 | 5,429 | 4,732 | 44,338 | 17,522 | 171,743 | 239,738 | 71,980 | 744,652 |
| Features | 42 | 1,433 | 3,703 | 500 | 4 | 8,189 | 12,047 | 8,337 | 0 |
| Anomalies | 57 | 106 | 197 | 340 | 84 | 300 | 450 | 600 | 217 |
| L1SUB | 0.523 | 0.486 | 0.563 | 0.575 | 0.591 | 0.485 | 0.502 | 0.530 | 0.463 |
| AMEN | 0.603 | 0.626 | 0.645 | 0.773 | 0.768 | 0.534 | 0.605 | 0.621 | 0.442 |
| DEEPFD | 0.572 | 0.658 | 0.704 | 0.776 | 0.846 | 0.497 | 0.500 | 0.501 | 0.499 |
| DOMINANT | 0.674 | 0.752 | 0.832 | 0.840 | 0.618 | 0.781 | 0.749 | 0.748 | 0.487 |
| DEEPSVDD | 0.730 | 0.703 | 0.693 | 0.622 | 0.938 | 0.635 | 0.642 | 0.734 | 0.453 |
| AS-GAE | 0.753 | 0.829 | 0.795 | 0.925 | 0.980 | 0.784 | 0.764 | 0.751 | 0.561 |
(1) The results demonstrate the strength of our proposed method by consistently achieving the best results in all eight structure anomaly synthetic tasks, and eight out of nine realworld datasets. Specifically, our results outperformed the benchmark models by over 31.7% for structure anomaly synthetic datasets, and 16.1% for real-world datasets.
(2) Our proposed method shows a stronger detection performance compared to other deep learning methods. A possible reason is that our method takes advantage of the dependence relationships information within the context of the graph to acquire a more competitive performance.
(3) As shown in Table 1, in the structure anomaly synthetic datasets experiments, our proposed method consistently achieves superior anomaly detection performance with respect to different combinations of background graphs and anomaly subgraphs, which proves the robustness of our proposed method. In comparison, the DEEPFD method and DEEPSVDD method have significantly different performances on different background graphs. For example, the DEEPFD method shows strong detection performance when having a random graph or scale-free graph as a background graph, while the DEEPSVDD method has competitive performance when the background graph is a complete graph or small-world graph.
(4) It is also worth noting that the deep learning-based benchmark methods (DEEPFD, DOMINANT, DEEPSVDD, and AS-GAE) show a more competitive performance than the non-deep learning-based benchmark methods (L1SUB and AMEN), by over 15.6% on average for structure anomaly synthetic datasets, and 12.9% on average for real-world datasets, which arguably indicates that non-deep learning methods have limited capability to effectively discriminate anomalies from graphs with complex structures.
5 Conclusion
This paper focuses on the crucial problem of detecting anomalous subgraphs from a given network under unsupervised learning settings. The proposed framework deep Anomalous Subgraph Autoencoder (AS-GAE) effectively addresses the unique challenges in anomaly subgraph detection by utilizing a location-aware graph autoencoder module to uncover the relative anomalous areas, and then a supermodular graph anomalies quantification module is applied to assign a reasonable anomaly score for the subgraphs in the built residual graph according to the reconstruction results of the autoencoder. Extensive experimental results on both synthetic and real-world datasets demonstrate the outstanding detection power of our framework.
@inproceedings{ijcai2023p730,
  title     = {Unsupervised Deep Subgraph Anomaly Detection (Extended Abstract)},
  author    = {Zhang, Zheng and Zhao, Liang},
  booktitle = {Proceedings of the Thirty-Second International Joint Conference on
               Artificial Intelligence, {IJCAI-23}},
  publisher = {International Joint Conferences on Artificial Intelligence Organization},
  editor    = {Edith Elkind},
  pages     = {6514--6518},
  year      = {2023},
  month     = {8},
  note      = {Sister Conferences Best Papers},
  doi       = {10.24963/ijcai.2023/730},
  url       = {https://doi.org/10.24963/ijcai.2023/730},
}
TY - CPAPER TI - Unsupervised Deep Subgraph Anomaly Detection (Extended Abstract) AU - Zhang, Zheng AU - Zhao, Liang T2 - Proceedings of the Thirty-Second International Joint Conference on Artificial Intelligence, IJCAI-23 PB - International Joint Conferences on Artificial Intelligence Organization PY - 2023 SP - 6514 EP - 6518 DO - 10.24963/ijcai.2023/730 UR - https://doi.org/10.24963/ijcai.2023/730 ER -Copied
Machine-readable versions of this paper, for tools and AI agents:





