
Exploiting Multi-Label Correlation in Label Distribution Learning
Proceedings of the Thirty-Third International Joint Conference on Artificial Intelligence. Main Track. Pages 4326-4334.
https://doi.org/10.24963/ijcai.2024/478
Keywords
- Machine Learning: ML: Multi-label learning
- Machine Learning: ML: Classification
- Machine Learning: ML: Applications
Abstract
Label Distribution Learning (LDL) is a novel machine learning paradigm that assigns label distribution to each instance. Numerous LDL methods proposed to leverage label correlation in the learning process to solve the exponential-sized output space; among these, many exploited the low-rank structure of label distribution to capture label correlation. However, recent research has unveiled that label distribution matrices typically maintain full rank, posing a challenge to approaches relying on low-rank label correlation. Notably, low-rank label correlation finds widespread adoption in multi-label learning (MLL) literature due to the often low-rank nature of multi-label matrices. Inspired by that, we introduce an auxiliary MLL process within the LDL framework, focusing on capturing low-rank label correlation within this auxiliary MLL component rather than the LDL itself. By doing so, we adeptly exploited low-rank label correlation in our LDL methods. We conduct comprehensive experiments and demonstrate that our methods are superior to existing LDL methods. Besides, the ablation studies justify the advantages of exploiting low-rank label correlation in the auxiliary MLL.
- [Cai et al., 2010] Jian-Feng Cai, Emmanuel J Candès, and Zuowei Shen. A singular value thresholding algorithm for matrix completion. SIAM Journal on optimization, 20(4):1956-1982, 2010.
- [Candès et al., 2011] Emmanuel J Candès, Xiaodong Li, Yi Ma, and John Wright. Robust principal component analysis? Jounal of the ACM, 58(3):1-37, 2011.
- [Cha, 2007] Sung-Hyuk Cha. Comprehensive survey on distance/similarity measures between probability density functions. City, 1(2):1, 2007.
- [Demšar, 2006] Janez Demšar. Statistical comparisons of classifiers over multiple data sets. The Journal of Machine Learning Research, 7:1-30, 2006.
- [Eisen et al., 1998] Michael B Eisen, Paul T Spellman, Patrick O Brown, and David Botstein. Cluster analysis and display of genome-wide expression patterns. Proceed- ings of the National Academy of Sciences, 95(25):14863- 14868, 1998.
- [Fazel, 2002] Maryam Fazel. Matrix rank minimization with applications. PhD thesis, PhD thesis, Stanford University, 2002.
- [Gao et al., 2017] Bin-Bin Gao, Chao Xing, Chen-Wei Xie, Jianxin Wu, and Xin Geng. Deep label distribution learn- ing with label ambiguity. IEEE Transactions on Image Processing, 26(6):2825-2838, 2017.
- [Geng and Luo, 2014] Xin Geng and Longrun Luo. Multi- label ranking with inconsistent rankers. In Proceedings of the IEEE Conference on Computer Vision and Pattern Recognition, pages 3742-3747, 2014.
- [Geng and Xia, 2014] Xin Geng and Yu Xia. Head pose es- timation based on multivariate label distribution. In Pro- ceedings of the IEEE Conference on Computer Vision and Pattern Recognition, pages 1837-1842, 2014.
- [Geng, 2016] Xin Geng. Label distribution learning. IEEE Transactions on Knowledge and Data Engineering, 28(7):1734-1748, 2016.
- [Jia et al., 2019] Xiuyi Jia, Xiang Zheng, Weiwei Li, Changqing Zhang, and Zechao Li. Facial emotion distri- bution learning by exploiting low-rank label correlations locally. In 2019 IEEE/CVF Conference on Computer Vi- sion and Pattern Recognition (CVPR), pages 9833-9842, 2019.
- [Jia et al., 2021] Xiuyi Jia, Zechao Li, Xiang Zheng, Weiwei Li, and Sheng-Jun Huang. Label distribution learning with label correlations on local samples. IEEE Transactions on Knowledge and Data Engineering, 33(4):1619-1631, 2021.
- [Jing et al., 2015] Liping Jing, Liu Yang, Jian Yu, and Michael K Ng. Semi-supervised low-rank mapping learn- ing for multi-label classification. In Proceedings of the IEEE Conference on Computer Vision and Pattern Recog- nition, pages 1483-1491, 2015.
- [Le et al., 2023] Nhat Le, Khanh Nguyen, Quang Tran, Er- man Tjiputra, Bac Le, and Anh Nguyen. Uncertainty- aware label distribution learning for facial expression recognition. In Proceedings of the IEEE/CVF Winter Con- ference on Applications of Computer Vision, pages 6088- 6097, 2023.
- [Li and Deng, 2019] Shan Li and Weihong Deng. Blended emotion in-the-wild: Multi-label facial expression recog- nition using crowdsourced annotations and deep locality feature learning. International Journal of Computer Vi- sion, 127(6-7):884-906, 2019.
- [Liu et al., 2021] Weiwei Liu, Haobo Wang, Xiaobo Shen, and Ivor W Tsang. The emerging trends of multi-label learning. IEEE Transactions on Pattern Analysis and Ma- chine Intelligence, 44(11):7955-7974, 2021.
- [Lyons et al., 1998] Michael Lyons, Shigeru Akamatsu, Miyuki Kamachi, and Jiro Gyoba. Coding facial expres- sions with gabor wavelets. In Proceedings IEEE Interna- tional Conference on Automatic Face and Gesture Recog- nition, pages 200-205, 1998.
- [Ren and Geng, 2017] Yi Ren and Xin Geng. Sense beauty by label distribution learning. In Proceedings of Inter- national Joint Conference on Artificial Intelligence, pages 2648-2654, 2017. IJCAI
- [Ren et al., 2019] Tingting Ren, Xiuyi Jia, Weiwei Li, Lei Chen, and Zechao Li. Label distribution learning with label-specific features. In Proceedings of International Joint Conference on Artificial Intelligence, pages 3318- 3324, 2019. IJCAI
- [Shen et al., 2017] Wei Shen, Kai Zhao, Yilu Guo, and Alan L Yuille. Label distribution learning forests. In Pro- ceedings of Conference on Neural Information Processing Systems, pages 1-10, 2017.
- [Tan et al., 2023] Chao Tan, Sheng Chen, Xin Geng, and Genlin Ji. A label distribution manifold learning algo- rithm. Pattern Recognition, 135:109112, 2023.
- [Wang and Geng, 2019] Jing Wang and Xin Geng. Classifi- cation with label distribution learning. In Proceedings of International Joint Conference on Artificial Intelligence, pages 3712-2718, 2019. IJCAI
- [Wang and Geng, 2021] Jing Wang and Xin Geng. Label distribution learning machine. In Proceedings of Inter- national Conference on Machine Learning, pages 10749- 10759, 2021.
- [Wang and Geng, 2023] Jing Wang and Xin Geng. Label distribution learning by exploiting label distribution man- ifold. IEEE Transactions on Neural Networks and Learn- ing Systems, 34(2):839-852, 2023.
- [Wu et al., 2020] Guoqiang Wu, Ruobing Zheng, Yingjie Tian, and Dalian Liu. Joint ranking svm and binary rel- evance with robust low-rank learning for multi-label clas- sification. Neural Networks, 122:24-39, 2020.
- [Xu and Zhou, 2017] Miao Xu and Zhi-Hua Zhou. Incom- plete label distribution learning. In Proceedings of Inter- national Joint Conference on Artificial Intelligence, pages 3175-3181, 2017. IJCAI
- [Xu et al., 2016] Chang Xu, Dacheng Tao, and Chao Xu. Robust extreme multi-label learning. In Proceedings of the ACM SIGKDD International Conference on Knowl- edge Discovery and Data Mining, pages 1275-1284, 2016.
- [Xu et al., 2019] Ning Xu, Yun-Peng Liu, and Xin Geng. Label enhancement for label distribution learning. IEEE Transactions on Knowledge and Data Engineering, 33(4):1632-1643, 2019. IJCAI
- [Yin et al., 2006] Lijun Yin, Xiaozhou Wei, Yi Sun, Jun Wang, and Matthew J Rosato. A 3d facial expression database for facial behavior research. In Proceedings of International Conference on Automatic Face and Gesture Recognition, pages 211-216, 2006.
- [Yu et al., 2012] Jia-Feng Yu, Dong-Ke Jiang, Ke Xiao, Yun Jin, Ji-Hua Wang, and Xiao Sun. Discriminate the falsely predicted protein-coding genes in aeropyrum pernix k1 genome based on graphical representation. Match-Communications in Mathematical and Computer Chemistry, 67(3):845, 2012.
- [Yu et al., 2018] Guoxian Yu, Xia Chen, Carlotta Domeni- coni, Jun Wang, Zhao Li, Zili Zhang, and Xindong Wu. Feature-induced partial multi-label learning. In Proceed- ings of the IEEE International Conference on Data Min- ing, pages 1398-1403, 2018.
- [Zheng et al., 2018] Xiang Zheng, Xiuyi Jia, and Weiwei Li. Label distribution learning by exploiting sample correla- tions locally. In Proceedings of the AAAI Conference on Artificial Intelligence, volume 32, 2018.
- [Zhou et al., 2015] Ying Zhou, Hui Xue, and Xin Geng. Emotion distribution recognition from facial expressions. In Proceedings of the ACM International Conference on Multimedia, pages 1247-1250, 2015.
References were extracted automatically from the PDF and may contain errors.
Full text extracted automatically from the PDF; figures, tables and equations may differ. The PDF is the version of record.
1 Introduction
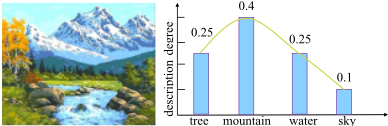
Label distribution learning (LDL) [Geng, 2016] is a novel learning paradigm that provides fine-grained label information for each instance. Unlike traditional learning paradigms, it introduces the label description degree [Geng, 2016] that is a real value and quantifies the relevance of one label to a specific instance. The label description degrees of all labels form a label distribution, which provides a comprehensive representation of label information. Fig.1 showcases an image from a natural-scene dataset [Geng and Luo, 2014]. The average ratings are rescaled to form a label distribution {0.25, 0.4, 0.25, 0.1}, effectively capturing the varying degrees of importance assigned to labels. LDL utilizes label description degrees to solve label ambiguity [Gao et al., 2017].
∗Corresponding authors.
LDL has an overwhelming output space, exponentially growing with the number of potential labels [Wang and Geng, 2023]. To address this, label correlation has emerged as a promising solution. Many LDL works have proposed to leverage label correlation in the learning processes. To name a few, [Xu and Zhou, 2017] captured the low-rank structure of the label distribution matrix to incorporate label correlation. [Jia et al., 2021] leveraged the low-rank assumption to capture label correlations shared by different groups of samples. They captured label correlations in a local context. Additionally, [Ren et al., 2019] utilized a low-rank matrix to capture global label correlation and further updated it based on different clusters to explore local label correlations. Label correlation helps improve the performance of these LDL methods.
The above LDL algorithms assumed that label distribution has a low-rank structure and relied on it to exploit label correlation. However, [Wang and Geng, 2023] has demonstrated that label distribution matrices are usually full-rank, which challenges the suitability of these approaches with low-rank assumptions. So, we may raise the following question: Is it possible to exploit the low-rank label correlation in LDL more efficiently?
Our work is mainly inspired by two observations. The first one is that low-rank has been extensively applied to multilabel learning (MLL) to capture label correlation [Jing et al., 2015; Liu et al., 2021; Wu et al., 2020; Xu et al., 2016; Yu et al., 2018] since MLL matrices are typically low-rank. The second one is that label distribution has rich supervision information and implicitly contains multi-label. To see that, for the example in Fig. 1, we can observe that the given label distribution contains implicit multi-labels of {tree, mountain, water}. Our basic idea is to introduce an auxiliary MLL process in LDL and then exploit the low-rank label correlation on the MLL part, for example, by assuming the MLL matrix is low-rank. That is, the low-rank assumption is added to the MLL part instead of the LDL part.
Following the strategy, we propose two novel LDL methods, TLRLDL and TKLRLDL, to exploit low-rank label correlation. First, we propose two methods to generate multilabel from label distribution. The first one utilizes a threshold to separate label distribution into multi-label, and the second one selects the top-k labels having the most significant label description degrees as the positive labels. Next, we simultaneously learn label distribution and the generated multi-label and capture the low-rank label correlation in the MLL process. We conduct extensive experiments to justify that the proposed methods outperform existing LDL approaches. Besides, the ablation studies validate the advantages of exploiting the low-rank label correlation in the auxiliary MLL process. To sum up, our significant contributions are as follows:
- As far as we know, this is the first work to introduce an auxiliary MLL process in LDL and exploit the MLL label correlation for LDL to relieve the unsuitability of low-rank label correlation of LDL.
- We exploit label correlation in LDL by capturing the low-rank structure in an auxiliary MLL process, which is more reasonable than directly exploiting the low-rank label correlation of LDL.
- We conduct extensive experiments to validate the advantages of our methods over existing LDL algorithms and the superiority of exploiting the low-rank label correlation in the auxiliary MLL process.
2 RelatedWork
2.1 Label Distribution Learning
As a novel learning paradigm, LDL introduces label distribution to capture the crucial degrees of labels, attracting much interest in machine learning. In this section, we provide a brief overview of the existing studies of LDL.
The existing LDL [Le et al., 2023; Tan et al., 2023] algorithms can be broadly classified into three categories. The first category involves transforming the LDL problem into a single-label learning problem by assigning weights to the training samples. Representative algorithms in this category include PT-SVM and PT-Bayes, which utilize SVM and Bayes classifiers to solve the transformed weighted singlelabel learning problems. The second category focuses on adapting traditional machine learning algorithms to handle the LDL problem. For instance, AA-kNN identifies the k nearest neighbors of an instance and predicts its label distribution by averaging the labels of these neighbors. AABP learns label distribution through the Back-Propagation (BP) algorithm. The third category includes specialized algorithms, such as IIS-LDL and BFGS-LDL, which primarily consider label distribution characteristics. However, these algorithms ignore label correlation.
2.2 Label Correlation in LDL
In recent years, researchers have recognized the challenge of the vast output space of LDL [Gao et al., 2017; Wang and Geng, 2019; Shen et al., 2017; Wang and Geng, 2021; Ren and Geng, 2017] and have developed various approaches to address this issue. These methods can be categorized into three types: (1) global label correlation, (2) local label correlation, and (3) both global and local label correlations. In the first category, [Zhou et al., 2015] introduced a weighted Jeffrey's divergence [Cha, 2007] to capture label correlation by assigning weights based on the Pearson correlation coefficient. [Xu and Zhou, 2017] incorporated the low-rank structure of label distribution by applying trace-norm regularization. In the second category, [Jia et al., 2019] utilized a local low-rank structure to capture the local label correlations implicitly. In the third category, [Ren et al., 2019] introduced LDL-LCLR, a method that leverages global and local label correlations. It utilizes a low-rank matrix to capture global label correlation and updates the matrix based on different clusters to explore local label correlation.
However, many of these works rely on the assumption of low-rank to exploit label correlation. As reported by [Wang and Geng, 2023], the label distribution matrix is generally full rank, which poses a challenge to those exploiting lowrank label correlation of LDL. Instead of directly exploiting the low-rank label correlation of LDL, this study introduces an auxiliary MLL. It exploits the low-rank label correlation on the MLL process, which can efficiently solve the problem mentioned above.
3 The ProposedMethods
Notations Let X = [x1, x2, . . . , xn] ∈ Rn×d be the feature matrix and Y = {y1, y2, . . . , ym} be the label space, where n, m, and d denote the numbers of instances, labels, and the dimension of features, respectively. The training set of the LDL is represented as T = {(x1, d1) , (x2, d2) , . . . , (xn, dn)}, where di = [dy1 xi , dy2 xi , . . . , dym xi ] is the label distribution of the ith sample xi. dyxi is the label description degree of y to xi, which satisfies dyxi ∈ [0, 1] and ∑y dyx = 1. The label distribution matrix is denoted as D = [d1, d2, . . . , dn] ∈ Rm×n . LDL aims to learn a mapping function from T and predict the label distribution for unseen instances.
3.1 Transforming Label Distribution to Multi-Label
This subsection will introduce two methods for transforming label distribution into multi-label. The first is threshold-based degradation, and the second is top-k degradation. Next, we provide details of these two methods.
Threshold-Based Multi-Label Generation
To convert label distribution into multi-label, we simulate users' labelling process when assigning labels to images or adding keywords to texts. Users continue adding the most relevant labels until they perceive the labelling is sufficiently comprehensive [Xu et al., 2019]. Based on that, we can derive multi-label from label distribution through this iterative labelling procedure. The process is outlined as follows:
- For each instance x, find the label yj with the highest description degree dyj x and add it to relevant label set.
- Calculate the sum of the description degrees of all the currently relevant labels H = ∑yj∈Y + dyj x , where Y + is the set of the currently relevant labels.
- If H is less than a predefined threshold T, continue finding the label with the highest description degree from the labels not included in Y, and add it to Y. Repeat this process until H > T .
Following this process, we can generate multi-label from label distribution that mimics how users label data.
Top-k Based Multi-Label Generation
Specifically, for any instance xi, we first sort the label description degrees in descending order. Then, we select the top-k labels with the highest label description degrees as relevant labels and assign the remaining labels as irrelevant labels. The top-k labels with the highest label description degrees are considered relevant for each instance, while the rest are deemed irrelevant.
3.2 AuxiliaryMLL and Label Correlation
Initially, we employ the least square method to learn label distribution and minimize the F -norm loss between the groundtruth label distribution and prediction, which can be formalized as the following:
where W ∈ Rm×d is the parameter matrix, ∥ · ∥F represents the Frobenius norm, and λ is a regularization parameter. Next, we establish the mapping relationship between label distribution and multi-label generated in the previous section. This linear mapping is formulated as follows:
where L ∈ Rm×n is the ML matrix, and O ∈ Rn×n is the transformation matrix. Nonlinear mapping is left for future work. Accordingly, we utilize the low-rank label correlation. However, given the full-rank nature of the label distribution matrix, assuming a low-rank structure does not suit LDL. To address that, we encourage the low-rank structure of the MLL process, which has been widely accepted in MLL literature. That is, the predicted ML matrix is assumed to be low-rank, which further casts Eq. (2) as:
where Rank(A) represents the rank of A, and α is a balance parameters. By jointly optimizing Problem (1) and Problem (3), we obtain the final formulation as follows:
Rank(·) is difficult to solve due to the discrete nature of the rank function. Fortunately, as suggested by [Cand`es et al., 2011], the nuclear-norm [Fazel, 2002] is a good surrogate for the rank function. Replacing the rank function with the nuclear norm, we obtain the next optimization problem:
The method learning multi-label by threshold is called TLRLDL, and the other one learning multi-label from top-k is called TKLRLDL.
3.3 Optimization
We utilize ADMM to address the problem (5), which is proficient in managing equality constraints. First, we introduce an auxiliary variable G ∈ Rm×n and rewrite Eq. (5) as
We introduce the augmented Lagrangian function for Eq. (6)
where µ is a positive penalty parameter, and Γ1 ∈ Rm×n denotes the Lagrangian multipliers. It can be solved by alternately optimizing three sub-problems as follows. The whole process is summarized in Algorithm 1.
Solving G-Subproblem
The subproblem w.r.t. G is
It is a nuclear norm minimization problem and has a closedform solution [Cai et al., 2010]:
where T = WX⊤O+ Γ1 µ , and S(·) is single value thresholding operator. It first performs singular value decomposition on WX⊤O + Γ1 µ = UˆΣV⊤, and then gives the solution as UˆΣV⊤, where ˆΣii = max (0, Σii - α/µ).
Solving W-Subproblem
The subproblem w.r.t. W is
which is a quadratic optimization problem. The optimal solution is obtained by setting the derivative to zero and equals
Solving O-Subproblem
The subproblem w.r.t. O is
which is a quadratic optimization problem. The optimal solution is obtained by setting the derivative to zero and equals
Updating Multipliers and Penalty Parameter
Finally, the Lagrange multiplier matrix and penalty parameter are updated based on following rules:
where µmax is the maximum value of µ.
Algorithm 1 The pseudo-code for TLRLDL and TKLRLDL
Input: training set T, parameters α, λ, and text data x∗ . Output: Predict the label distribution of x∗ .
- 1: Transforming label distribution matrix into multi-label matrix according to the method in the preceding section;
- 2: InitializeW, O, G, Γ1, and µ;
- 3: t=1;
- 4: repeat
- 5: Update G according to Eq. (7);
- 6: UpdateWaccording to Eq. (8);
- 7: Update O according to Eq. (10);
- 8: Update Γ1 and µ according to Eq. (11);
- 9: t=t+1;
- 10: until stopping criterion is satisfied
- 11: return the label distribution d∗ =W(x∗ ).
4 Experiments
4.1 Experimental Configuration
Experimental Datasets: The experiments are conducted on 16 real-world datasets with label distribution. The key characteristics of these datasets are summarized in Table 1. Geng collects the first 12 datasets [Geng, 2016]. Among these, the first eight (from Spoem to Alpha) are from the clustering analysis of genome-wide expression in Yeast Saccharomyces cerevisiae [Eisen et al., 1998]. The SJAFFE is collected from JAFFE [Lyons et al., 1998], and the SBU 3DFE is obtained from BU 3DFE [Yin et al., 2006]. The Gene is obtained from the research on the relationship between genes and diseases [Yu et al., 2012]. The Scene consists of multi-label images, where the label distributions are transformed from rankings [Geng and Xia, 2014]. Besides, the SCUT-FBP, M2B, and fbp5500 are about facial beauty perception [Ren and Geng, 2017]. The last one, RAF-ML is a facial expression dataset
| ID | Data sets | #Examples | #Features | #Labels |
|---|---|---|---|---|
| 1 | Spoem | 2465 | 24 | 2 |
| 2 | Spo5 | 2465 | 24 | 3 |
| 3 | Heat | 2465 | 24 | 6 |
| 4 | Elu | 2465 | 24 | 14 |
| 5 | Dtt | 2465 | 24 | 4 |
| 6 | Cold | 2465 | 24 | 4 |
| 7 | Cdc | 2465 | 24 | 15 |
| 8 | Alpha | 2465 | 24 | 18 |
| 9 | SJAFFE | 213 | 243 | 6 |
| 10 | SBU-3DFE | 2500 | 243 | 6 |
| 11 | Gene | 17892 | 36 | 68 |
| 12 | Scene | 2000 | 294 | 9 |
| 13 | SCUT-FBP | 1500 | 300 | 5 |
| 14 | M2B | 1240 | 250 | 5 |
| 15 | fbp5500 | 5500 | 512 | 5 |
| 16 | RAF-ML | 4908 | 200 | 6 |
[Li and Deng, 2019] with six-dimension expression distribution.
Evaluation Metrics: We adopt six metrics to evaluate the performance of LDL methods, including Chebyshev (↓), Clark (↓), Kullback-Leibler (KL) (↓), Canberra (↓), Intersection (↑), and Cosine (↑) [Geng, 2016]. Here, ↓ indicates that smaller values are better, and ↑ indicates that larger values are better.
Comparing Methods: We compare the proposed methods with seven LDL methods, including IIS-LDL, LDLLDM, EDL-LRL, IncomLDL, Adam-LDL-SCL, LCLR, and LDLLC, which are briefly introduced as follows:
- IIS-LDL [Geng, 2016]: It utilizes the maximum entropy model and KL divergence to learn the label distribution and does not consider label correlation.
- LDLLDM [Wang and Geng, 2023]: It learns the global and local label distribution manifolds to exploit label correlations and can handle incomplete label distribution learning.
- EDL-LRL [Jia et al., 2019]: It captures the low-rank structure locally when learning the label distribution to exploit local label correlations.
- IncomLDL [Xu and Zhou, 2017]: It utilizes trace-norm regularization and the alternating direction multiplier to exploit low-rank label correlation.
- Adam-LDL-SCL [Jia et al., 2021]: It incorporates local label correlation by encoding it as additional features and simultaneously learns the label distribution and label correlation encoding.
- LCLR [Ren et al., 2019]: It first models global label correlation using a low-rank matrix and then updates the matrix on clusters of samples to consider local label correlation.
- LDLLC [Zheng et al., 2018]: LDLLC leverages local label correlation to ensure that prediction distributions between similar instances are as close as possible.
The parameters of the methods are as follows. The suggested parameters are used for IIS-LLD, EDL-LRL, LDLLC, and LDL-LCLR. For LDLLDM, λ1, λ2, and λ3 are tuned from {10-3 , . . . , 103}, and g is tuned from 1 to 14. For IncomLDL, λ is selected from the range {2-10 , . . . , 210}, and ρ = 1. For Adam-LDL-SCL, λ1, λ2, and λ3 are tuned from the set {10-3 , . . . , 103}, and m is tuned from 0 to 14. For TLRLDL and TKLRLDL, α, λ are tuned from {0.005, 0.01, 0.05, 0.1, 0.5, 1, 10}, T is selected from 0.1 to 0.5, and k is tuned from 0 to m. We run each method for ten-fold cross-validation.
4.2 Results and Discussion
Table 2 presents the experimental results (mean±std) of the LDL algorithms on all datasets in terms of Clark, KL, and Cosine (due to limited space, the results in terms of other metrics are reported in the supplementary material 1 ), with the best results highlighted in boldface. Moreover, the last row summarizes the top-one times of each method.
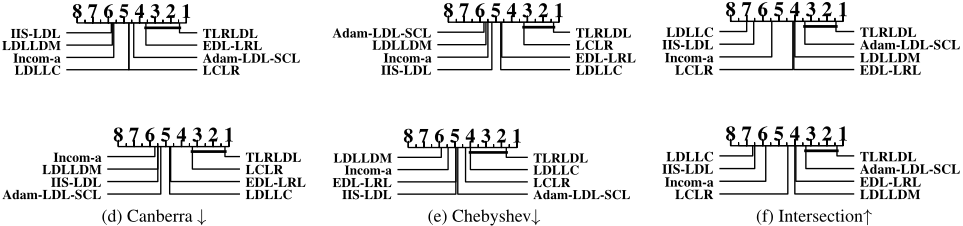
First, we conduct the Friedman test [Demˇsar, 2006] to study the comparative performance of all methods. Table 3 shows the Friedman statistics for each metric and the critical value. At a confidence level of 0.05, the null hypothesis that all algorithms achieve equal performance is rejected. Next, we apply a posthoc test, i.e., the Bonferroni-Dunn test [Demˇsar, 2006], to compare the relative performance of TLRLDL against the other algorithms with it as the control algorithm 2 . One algorithm is deemed to achieve significantly different performance from TLRLDL if its average rank differs from that of TLRLDL by at least one critical difference (CD) [Demˇsar, 2006]. Figure 2 illustrates the CD diagrams for each measure. If the average rank of a comparing algorithm is within one CD to that of TLRLDL, they are connected with a thick line; otherwise, it is considered to have a significantly different performance from TLRLDL.
According to Table 2, TLRLDL demonstrates remarkable performance; ranking first in 70.83% (34 out of 48) of the cases and achieving the best mean performance across all metrics. TLRLDL and TKLRLDL reach the top position in 85.4% (41 out of 48) of the evaluations, underscoring the methods' effectiveness. Additionally, observations from Figure 2 include:
- TLRLDL significantly outperforms IIS-LLD across all metrics due to its utilization of label correlation, underscoring its importance for LDL.
- TLRLDL shows superior performance over IncomLDL, ED-LRL, and LCLR, suggesting the potential limitation of low-rank label correlation in LDL. However, TLRLDL's application of low-rank label correlation in the auxiliary MLL process appears to be more appropriate and effective for LDL.
- In contrast toLDLLC, LDLLDM, andAdam-LDL-SCL, TLRLDL's success further supports the competitiveness of employing low-rank label correlation within the auxiliary MLL process as a strategy for LDL.
1 https://github.com/users/zhiqiang-kou/projects/1
2 The test results with TKLRLDL as the control algorithm are presented in the supplementary material
In summary, the experimental results substantiate the competitive performance of the proposed algorithms.
4.3 Ablation Study
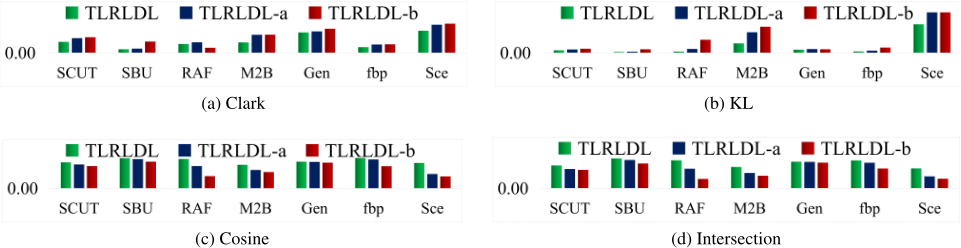
Next, we study the advantages of exploiting the low-rank label correlation on the auxiliary MLL. First, we derive TLRLDL-a by
Second, we derive TLRLDL-b by keeping Eq.'s first and fourth items (5). TLRLDL-a exploits low-rank label correlation on LDL, and TLRLDL-b ignores label correlation. We then compare TLRLDL with TLRLDL-a and TLRLDL-b.
Figure 3 presents the comparison results regarding Clark, KL, Cosine, and Intersection. Further, we conduct the Wilcoxon signed-rank tests [Demˇsar, 2006] for TLRLDL against TLRLDL-a and TLRLDL-b and report the results of the tests in Table 4. According to Figure 3 and Table 4, TLRLDL and TLRLDL-a have better performance than TLRLDL-b. TLRLDL-b ignores label correlation, while TLRLDL and TLRLDL-a consider label correlation, which improves their performance. This observation further justifies the importance of label correlation for LDL. Besides, TLRLDL statistically outperforms TLRLDL-a. Since the difference between TLRLDL and TLRLDL-a lies in that the former (respective the latter) exploits low-rank label correlation on MLL (respective LDL), this observation clearly justifies the benefits of exploiting low-rank label correlation on the auxiliary MLL. To summarize, exploiting the low-rank multi-label correlation is more suitable for LDL.
4.4 Parameter Sensitivity Analysis
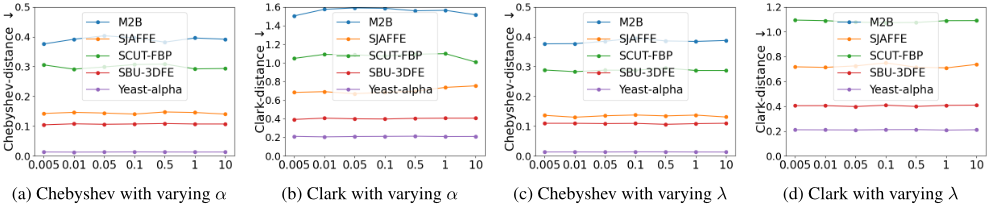
TLRLDL has two trade-off parameters, including α and λ. Next, we analyze the sensitivity of them. First, we run TLRLDL with α varying from the candidate set {0.005, 0.01, 0.05, 0.1, 0.5, 1, 10} and report its performance on SCUT-FBP, M2B, SJAFFE, SBU 3DFE, and Alpha in Figure 4. As seen from Figure 4, TLRLDL shows robustness w.r.t. α. As a result, we can set α to 0.1 to get a satisfying performance. Likewise, we also run TLRLDL with λ ranging from the same candidate set and present its performance in Figure 4. As shown in Figure 4, TLRLDL is robust w.r.t. λ. Therefore, we may expect satisfying performance for λ = 0.1.
5 Conclusion
LDL has an exponential-size output space-with a size of Rm-which may decrease the performance of existing algorithms. To solve that, many LDL studies have proposed to exploit label correlation. Among these, some have suggested using low-rank label correlation of label distribution, which may not hold as disclosed by [Wang and Geng, 2023] because LDL matrices are typically full-rank. Addressing this, we've implemented an auxiliary MLL process within LDL, utilizing low-rank label correlation there, enhancing our methods' performance over current LDL approaches. Our results and further studies confirm the benefits of this low-rank exploitation. Future work will continue exploring this innovative direction, focusing on local low-rank label correlations.
| Metric | TLRLDL | TKLRLDL | IncomLDL | IIS-LDL | EDL-LRL | Adam-LDL-SCL | LCLR | LDLLC | LDLLDM | |
|---|---|---|---|---|---|---|---|---|---|---|
| Spo | Clark | 0.1238±.0038 | 0.1237±.0197 | 0.1314±.0028 | 0.1337±.0014 | 0.1291±.0000 | 0.1295±.0000 | 0.1302±.0001 | 0.1305±.0014 | 0.1301±.0303 |
| KL | 0.0264±.0311 | 0.0249±.0032 | 0.0288±.1709 | 0.0273±.0011 | 0.0317±.0000 | 0.0318±.0000 | 0.0246±.0001 | 0.0254±.0007 | 0.0264±.0061 | |
| Cosine | 0.9794±.0007 | 0.9801±.0028 | 0.9769±.0239 | 0.9773±.0005 | 0.9789±.0000 | 0.9789±.0000 | 0.9783±.0003 | 0.9785±.0005 | 0.9772±.0071 | |
| Clark | 0.1769±.0810 | 0.1803±.0139 | 0.2027±.0046 | 0.1896±.0025 | 0.1853±.0000 | 0.1843±.0000 | 0.1893±.0007 | 0.1908±.0003 | 0.1860±.0390 | |
| Spo5 KL | 0.0292±.0343 | 0.0304±.0408 | 0.0376±.0148 | 0.0336±.0008 | 0.0362±.0000 | 0.0356±.0000 | 0.0309±.0000 | 0.0314±.0000 | 0.0298±.0336 | |
| Cosine | 0.9759±.0213 | 0.9749±.0296 | 0.9700±.0520 | 0.9722±.0007 | 0.9738±.0000 | 0.9741±.0000 | 0.9725±.0001 | 0.9722±.0000 | 0.9737±.0301 | |
| Clark | 0.1790±.0096 | 0.1809±.0056 | 0.1940±.0768 | 0.1998±.0014 | 0.1831±.0000 | 0.1826±.0000 | 0.1874±.0032 | 0.2717±.0064 | 0.1848±.0040 | |
| Hea KL | 0.0122±.0279 | 0.0128±.0005 | 0.0146±.0141 | 0.0155±.0002 | 0.0153±.0000 | 0.0153±.0000 | 0.0130±.0003 | 0.0302±.0020 | 0.0131±.0002 | |
| Cosine | 0.9884±.0005 | 0.9882±.0005 | 0.9865±.0102 | 0.9855±.0002 | 0.9879±.0000 | 0.9880±.0000 | 0.9878±.0002 | 0.9695±.0022 | 0.9875±.0003 | |
| Clark | 0.2028±.0024 | 0.2000±.0103 | 0.2325±.0612 | 0.2395±.0022 | 0.1998±.0000 | 0.1989±.0000 | 0.2032±.0028 | 0.4114±.0089 | 0.2010±.0011 | |
| Elu KL | 0.0062±.0706 | 0.0063±.0138 | 0.0066±.0123 | 0.0091±.0002 | 0.0073±.0000 | 0.0072±.0000 | 0.0064±.0001 | 0.0296±.0011 | 0.0063±.0003 | |
| Cosine | 0.9941±.0010 | 0.9940±.0077 | 0.9918±.0049 | 0.9911±.0002 | 0.9940±.0000 | 0.9940±.0000 | 0.9938±.0001 | 0.9667±.0013 | 0.9940±.0005 | |
| Clark | 0.2142±.0719 | 0.2094±.0127 | 0.2243±.0016 | 0.2537±.0026 | 0.2168±.0000 | 0.2161±.0000 | 0.2172±.0021 | 0.4259±.0013 | 0.2147±.0309 | |
| Cdc KL | 0.0073±.0061 | 0.0070±.0017 | 0.0080±.0765 | 0.0099±.0002 | 0.0082±.0000 | 0.0082±.0000 | 0.0072±.0002 | 0.0291±.0001 | 0.0068±.0338 | |
| Cosine | 0.9935±.0263 | 0.9934±.0016 | 0.9926±.0300 | 0.9905±.0002 | 0.9933±.0000 | 0.9933±.0000 | 0.9932±.0002 | 0.9680±.0003 | 0.9934±.0463 | |
| Clark | 0.0946±.0175 | 0.0975±.0013 | 0.1039±.0188 | 0.1162±.0009 | 0.0993±.0000 | 0.0986±.0000 | 0.0971±.0006 | 0.1738±.0011 | 0.0959±.0003 | |
| Dtt KL | 0.0060±.0076 | 0.0062±.0008 | 0.0066±.0765 | 0.0088±.0002 | 0.0098±.0000 | 0.0098±.0000 | 0.0059±.0000 | 0.0223±.0005 | 0.0059±.0012 | |
| Cosine | 0.9945±.0132 | 0.9942±.0013 | 0.9933±.0300 | 0.9916±.0001 | 0.9940±.0000 | 0.9940±.0000 | 0.9943±.0000 | 0.9783±.0004 | 0.9944±.0584 | |
| Clark | 0.2072±.0042 | 0.2079±.0314 | 0.2156±.0775 | 0.2585±.0015 | 0.2107±.0000 | 0.2103±.0000 | 0.2085±.0012 | 0.4501±.0019 | 0.2116±.0236 | |
| Alp KL | 0.0052±.0016 | 0.0054±.0060 | 0.0058±.0232 | 0.0084±.0001 | 0.0063±.0000 | 0.0063±.0000 | 0.0054±.0001 | 0.0267±.0002 | 0.0055±.0857 | |
| Cosine | 0.9948±.0015 | 0.9947±.0069 | 0.9943±.0052 | 0.9916±.0001 | 0.9946±.0000 | 0.9946±.0000 | 0.9947±.0001 | 0.9700±.0001 | 0.9946±.0362 | |
| Clark | 0.1378±.0014 | 0.1390±.0731 | 0.1463±.0338 | 0.1568±.0014 | 0.1403±.0000 | 0.1398±.0000 | 0.1416±.0042 | 0.1512±.0040 | 0.1363±.0190 | |
| Col KL | 0.0118±.0042 | 0.0124±.0565 | 0.0139±.0056 | 0.0153±.0002 | 0.0162±.0000 | 0.0162±.0000 | 0.0128±.0009 | 0.0140±.0006 | 0.0116±.0154 | |
| Cosine | 0.9892±.0061 | 0.9886±.0357 | 0.9873±.0047 | 0.9855±.0003 | 0.9885±.0000 | 0.9885±.0000 | 0.9880±.0008 | 0.9866±.0005 | 0.9889±.0390 | |
| Clark | 0.3602±.0042 | 0.3657±.0099 | 0.4567±.0061 | 0.4516±.0181 | 0.4232±.0002 | 1.3730±.9671 | 0.4049±.0082 | 0.4369±.0034 | 0.4153±.0010 | |
| SJA KL | 0.0480±.0016 | 0.0518±.0277 | 0.0659±.0202 | 0.0790±.0053 | 0.0692±.0000 | 1.0106±.9024 | 0.0663±.0000 | 0.0791±.0019 | 0.0668±.0009 | |
| Cosine | 0.9558±.0015 | 0.9509±.0528 | 0.9321±.0187 | 0.9208±.0062 | 0.9319±.0000 | 0.6503±.0850 | 0.9372±.0000 | 0.9245±.0019 | 0.9363±.0125 | |
| Clark | 1.0793±.0061 | 1.4568±.0000 | 1.5459±.0016 | 1.5007±.0064 | 1.5146±.0000 | 1.4654±.0000 | 1.3859±.0062 | 2.6438±.0000 | 1.3978±.0009 | |
| SCU KL | 0.1779±.0015 | 0.1503±.0528 | 2.6539±.0221 | 0.1824±.0170 | 9.2314±.0504 | 7.4655±.0041 | 0.4248±.0047 | 16.040±.1750 | 0.3997±.0009 | |
| Cosine | 0.8208±.0028 | 0.7436±.0202 | 0.6108±.0689 | 0.6627±.0028 | 0.6477±.0000 | 0.7436±.0000 | 0.8126±.0011 | 0.5144±.0002 | 0.8375±.0002 | |
| Clark | 0.3455±.0043 | 0.3520±.0016 | 0.3692±.0011 | 0.4217±.0029 | 0.4061±.0000 | 0.3718±.0000 | 0.3956±.0039 | 0.4172±.0003 | 0.4056±.0071 | |
| SBU KL | 0.0502±.0857 | 0.0552±.0765 | 0.0619±.0036 | 0.0776±.0009 | 0.0726±.0000 | 0.0604±.0000 | 0.2008±.0026 | 0.0845±.0002 | 0.0791±.0370 | |
| Cosine | 0.9474±.0012 | 0.9449±.0300 | 0.9410±.0013 | 0.9177±.0011 | 0.9232±.0000 | 0.9367±.0000 | 0.9267±.0011 | 0.9180±.0002 | 0.9226±.0010 | |
| Clark | 0.8652±.0082 | 1.4327±.0528 | 1.5597±.0234 | 1.5581±.0086 | 1.4495±.0003 | 1.4585±.0000 | 1.5962±.0138 | 1.6210±.0034 | 1.4151±.0016 | |
| RAF KL | 0.0864±1.8674 | 0.2086±.0187 | 6.4358±.0090 | 3.5105±.0654 | 2.2182±.0013 | 5.6995±.0000 | 13.7926±1.8887 | 0.7347±.0001 | 0.2699±.0109 | |
| Cosine | 0.9252±.0034 | 0.9234±.0115 | 0.5631±.0101 | 0.7351±.0020 | 0.9198±.0000 | 0.8706±.0000 | 0.7968±.0047 | 0.6453±.0007 | 0.8976±.0002 | |
| Clark | 1.0224±.0009 | 1.5160±.0023 | 1.4832±.0878 | 1.2282±.0070 | 1.6770±.0046 | 1.2093±.0000 | 1.6902±.1999 | 1.6791±.0002 | 1.5538±.0029 | |
| M2B KL | 0.6972±.0108 | 0.7786±.0109 | 0.8180±.0301 | 0.8572±.0354 | 0.8632±.0044 | 0.8128±.0000 | 0.9528±.5826 | 0.9051±.0000 | 0.7556±.0083 | |
| Cosine | 0.7431±.0004 | 0.7786±.0070 | 0.7583±.0308 | 0.7588±.0122 | 0.7423±.0006 | 0.7639±.0000 | 0.5786±.0325 | 0.6039±.0000 | 0.6953±.0054 | |
| Gen | Clark | 2.0077±.0041 | 2.1086±.0036 | 2.1110±.0040 | 2.1734±.0269 | 2.1102±.0000 | 2.1144±.0000 | 2.0677±.0172 | 2.1162±.0009 | 2.1374±.0036 |
| KL | 0.2224±.0096 | 0.2236±.0091 | 0.2372±.0002 | 0.2380±.0069 | 0.2258±.0000 | 0.2256±.0000 | 0.3618±.0026 | 0.2374±.0054 | 0.2455±.0069 | |
| Cosine Clark | 0.8387±.0028 0.5510±.0036 | 0.8376±.0038 | 0.8342±.0003 1.2938±.0011 | 0.8274±.0036 1.5065±.0023 | 0.8347±.0000 1.6994±.0001 | 1.2755±.0000 | 0.8338±.0027 1.8756±.0857 | 0.8290±.0021 1.2747±.0122 | ||
| 0.6288±.0155 | 0.2017±.0003 | 0.8345±.0000 | 0.8374±.0018 | 1.7692±.4081 | ||||||
| fbp KL | 0.0904±.0091 | 0.0800±.0068 | 4.2207±.0332 | 1.3803±.0029 | 0.7725±.0001 | 1.4102±.1809 0.4208±.4110 | 0.1149±.0047 | |||
| Cosine | 0.9567±.0038 | 0.9500±.0047 | 0.9412±.0005 | 0.6572±.0017 | 0.7943±.0000 | 0.9521±.0000 | 0.8527±.0051 | 0.8242±.0123 | 0.9528±.0056 | |
| Sce | Clark | 2.1786±.0108 | 2.4959±.0061 | 2.4765±.0303 | 2.4685±.0135 | 2.4348±.0000 | 2.4665±.0000 | 2.4230±.0025 | 2.4784±.0007 | 2.6316±.0000 |
| KL Cosine | 2.1128±.0061 0.7989±.0016 | 2.2857±.0015 0.8346±.0008 | 0.2378±.0061 0.7297±.0071 | 3.0463±.0490 0.6614±.0044 | 2.3857±.0002 0.7273±.0000 | 2.7001±.0000 0.7163±.0000 | 0.8287±.0227 0.7290±.0042 | 1.0243±.0027 0.6446±.0001 | 4.4471±.0000 0.3603±.0000 | |
| top-1 times | 34 | 7 | 1 | 0 | 0 | 0 | 2 | 0 | 4 | |
| Critical Value (α = 0.05) | Evaluation metric | Chebyshev | Clark | Canberra | KL | Cosine | Intersection |
| 2.8500 | Friedman Statistics FF | 28.0098 | 44.9412 | 46.3235 | 38.0000 | 45.7059 | 44.0158 |
| TLRLDL vs. | Chebyshev↓ | Clark↓ | Canberra↓ | KL↓ | Cosine↑ | Intersection ↑ |
|---|---|---|---|---|---|---|
| TLRLDL-a | win[4.37e-04] | win[4.38e-04] | win [4.37e-04] | win[4.46e-03] | win[4.38e-04] | win[4.38e-04] |
| TLRLDL-b | win[4.38e-04] | win [3.20e-03] | win[1.61e-03] | win[4.38e-04] | win [4.38e-04] | win[4.38e-04] |
Acknowledgements
This work was supported by the National Natural Science Foundation of China (62125602, 62076063, 62106044, 62306073), the Natural Science Foundation of Jiangsu Province (BK20210221, BK20230832), the China Postdoctoral Science Foundation (2022M720028), the ZhiShan Youth Scholar Program from Southeast University (2242022R40015), and the Jiangsu Funding Program for Excellent Postdoctoral Talent (2022ZB121).
Contribution Statement
Zhiqiang Kou and Jing Wang contributed equally to this work.
@inproceedings{ijcai2024p478,
  title     = {Exploiting Multi-Label Correlation in Label Distribution Learning},
  author    = {Kou, Zhiqiang and Wang, Jing and Tang, Jiawei and Jia, Yuheng and Shi, Boyu and Geng, Xin},
  booktitle = {Proceedings of the Thirty-Third International Joint Conference on
               Artificial Intelligence, {IJCAI-24}},
  publisher = {International Joint Conferences on Artificial Intelligence Organization},
  editor    = {Kate Larson},
  pages     = {4326--4334},
  year      = {2024},
  month     = {8},
  note      = {Main Track},
  doi       = {10.24963/ijcai.2024/478},
  url       = {https://doi.org/10.24963/ijcai.2024/478},
}
TY - CPAPER TI - Exploiting Multi-Label Correlation in Label Distribution Learning AU - Kou, Zhiqiang AU - Wang, Jing AU - Tang, Jiawei AU - Jia, Yuheng AU - Shi, Boyu AU - Geng, Xin T2 - Proceedings of the Thirty-Third International Joint Conference on Artificial Intelligence, IJCAI-24 PB - International Joint Conferences on Artificial Intelligence Organization PY - 2024 SP - 4326 EP - 4334 DO - 10.24963/ijcai.2024/478 UR - https://doi.org/10.24963/ijcai.2024/478 ER -Copied
Machine-readable versions of this paper, for tools and AI agents:





