
Guide to Numerical Experiments on Elections in Computational Social Choice
Proceedings of the Thirty-Third International Joint Conference on Artificial Intelligence. Survey Track. Pages 7962-7970.
https://doi.org/10.24963/ijcai.2024/881
Keywords
- Game Theory and Economic Paradigms: GTEP: Computational social choice
Abstract
We analyze how numerical experiments regarding elections were conducted within computational social choice literature (focusing on papers published in the IJCAI, AAAI, and AAMAS conferences). We analyze the sizes of the studied elections and the methods of generating preference data, thereby making previously hidden standards and practices explicit. In particular, we survey a number of statistical cultures for generating elections and their commonly used parameters.
- [Bachrach et al., 2016] Y. Bachrach, O. Lev, Y. Lewenberg, and Y. Zick. Misrepresentation in district voting. In Pro- ceedings of IJCAI-2016, pages 81-87, 2016.
- [Berg, 1985] S. Berg. Paradox of voting under an urn model: The effect of homogeneity. Public Choice, 47(2):377-387, 1985.
- [Black, 1958] D. Black. The Theory of Committees and Elec- tions. Cambridge University Press, 1958.
- [Bloembergen et al., 2019] D. Bloembergen, D. Grossi, and M. Lackner. On rational delegations in liquid democracy. In Proceedings of AAAI-2019, pages 1796-1803, 2019.
- [Boehmer and Schaar, 2023] N. Boehmer and N. Schaar. Collecting, classifying, analyzing, and using real-world ranking data. In Proceedings of AAMAS-2023, pages 1706-1715, 2023.
- [Boehmer et al., 2021] N. Boehmer, R. Bredereck, P. Fal- iszewski, R. Niedermeier, and S. Szufa. Putting a compass on the map of elections. In Proceedings of IJCAI-2021, pages 59-65, 2021. IJCAI
- [Boehmer et al., 2022] N. Boehmer, R. Bredereck, E. Elkind, P. Faliszewski, and S. Szufa. Expected frequency matrices of elections: Computation, geometry, and preference learning. In Proceedings of NeurIPS-2022, 2022.
- [Boehmer et al., 2023a] N. Boehmer, J.-Y. Cai, P. Fal- iszewski, A. Z. Fan, Ł. Janeczko, A. Kaczmarczyk, and T. W ąs. Properties of position matrices and their elections. In Proceedings of AAAI-2023, pages 5507-5514, 2023.
- [Boehmer et al., 2023b] N. Boehmer, P. Faliszewski, and S. Kraiczy. Properties of the Mallows model depending on the number of alternatives: A warning for an experimen- talist. In Proceedings of ICML-2023, pages 2689-2711.
- PMLR, 2023.
- [Boehmer et al., 2024] N. Boehmer, P. Faliszewski, Ł. Janeczko, A. Kaczmarczyk, G. Lisowski, G. Pierczyński, S. Rey, D. Stolicki, S. Szufa, and T. W ąs. Guide to nu- merical experiments on elections in computational social choice. Technical Report arXiv:2402.11765, arXiv.org, 2024.
- [Boehmer, 2023] N. Boehmer. Application-oriented collec- tive decision making: Experimental toolbox and dynamic environments. PhD thesis, Technical University of Berlin, Germany, 2023.
- [Borodin et al., 2018] A. Borodin, O. Lev, N. Shah, and T. Strangway. Big city vs. the great outdoors: Voter distri- bution and how it affects gerrymandering. In Proceedings of IJCAI-2018, pages 98-104, 2018. IJCAI
- [Brandt et al., 2016] F. Brandt, V. Conitzer, U. Endriss, J. Lang, and A. Procaccia, editors. Handbook of Computa- tional Social Choice. Cambridge University Press, 2016.
- [Colley et al., 2023] R. Colley, T. Delemazure, and H. Gilbert. Measuring a priori voting power in liq- uid democracy. In Proceedings of IJCAI-2023, pages 2607-2615, 2023. IJCAI
- [Conitzer, 2009] V. Conitzer. Eliciting single-peaked pref- erences using comparison queries. Journal of Artificial Intelligence Research, 35:161-191, 2009.
- [Doucette and Cohen, 2017] J. Doucette and R. Cohen. A re- stricted markov tree model for inference and generation in social choice with incomplete preferences. In Proceedings of AAMAS-2017, pages 893-901, 2017.
- [Eggenberger and Pólya, 1923] F. Eggenberger and G. Pólya. Über die statistik verketteter vorgänge. ZAMM-Journal of Applied Mathematics and Mechan- ics/Zeitschrift für Angewandte Mathematik und Mechanik, 3(4):279-289, 1923.
- [Egecioglu and Giritligil, 2013] Ö. Egecioglu and A. Gir- itligil. The impartial, anonymous, and neutral culture model: A probability model for sampling public pref- erence structures. Journal of Mathematical Sociology, 37(4):203-222, 2013.
- [Faliszewski et al., 2017] P. Faliszewski, P. Skowron, A. Slinko, and N. Talmon. Multiwinner voting: A new challenge for social choice theory. In U. Endriss, editor, Trends in Computational Social Choice. AI Access Foundation, 2017.
- [Faliszewski et al., 2019] P. Faliszewski, P. Skowron, A. Slinko, S. Szufa, and N. Talmon. How similar are two elections? In Proceedings of AAAI-2019, pages 1909-1916, 2019.
- [Faliszewski et al., 2023a] P. Faliszewski, J. Flis, D. Peters, G. Pierczynski, P. Skowron, D. Stolicki, S. Szufa, and N. Talmon. Participatory budgeting: Data, tools and anal- ysis. In Proceedings of IJCAI-2023, pages 2667-2674, 2023. IJCAI
- [Faliszewski et al., 2023b] P. Faliszewski, A. Kaczmarczyk, K. Sornat, S. Szufa, and T. W ąs. Diversity, agreement, and polarization in elections. In Proceedings of IJCAI-2023, pages 2684-2692, 2023. IJCAI
- [Fishburn and Gehrlein, 1978] P. Fishburn and W. Gehrlein. Condorcet paradox and anonymous preference profiles. Public Choice, 26:1-18, 1978.
- [Guilbaud, 1952] G. Guilbaud. Les théories de l'intéret genéral et le problémelogique de l'agrégation. Economie Appliquée, 5:501-584, 1952.
- [Inada, 1964] K. Inada. A note on the simple majority deci- sion rule. Econometrica, 32(32):525-531, 1964.
- [Inada, 1969] K. Inada. The simple majority decision rule. Econometrica, 37(3):490-506, 1969.
- [Karpov, 2019] Alexander Karpov. On the number of group- separable preference profiles. Group Decision and Nego- tiation, 28(3):501-517, 2019.
- [Kruskal, 1964] J. Kruskal. Multidimensional scaling by op- timizing goodness of fit to a nonmetric hypothesis. Psy- chometrika, 29(1):1-27, 1964.
- [Kuga and Nagatani, 1974] K. Kuga and H. Nagatani. Voter antagonism and the paradox of voting. Econometrica, 42(6):1045-1067, 1974.
- [Lackner and Skowron, 2023] M. Lackner and P. Skowron. Multi-Winner Voting with Approval Preferences. Springer, 2023.
- [Lang and Xia, 2016] J. Lang and L. Xia. Voting in combi- natorial domains. In F. Brandt, V. Conitzer, U. Endriss, J. Lang, and A. D. Procaccia, editors, Handbook of Com- putational Social Choice, chapter 9, pages 197-222.
- [Mallows, 1957] C. Mallows. Non-null ranking models. Bio- metrica, 44:114-130, 1957.
- [Mattei and Walsh, 2013] N. Mattei and T. Walsh. Preflib: A library for preferences. In Proceedings of ADT-2013, pages 259-270, 2013.
- [McCabe-Dansted and Slinko, 2006] J. McCabe-Dansted and A. Slinko. Exploratory analysis of similarities between social choice rules. Group Decision and Negotiation, 15:77-107, 2006.
- [Mirrlees, 1971] J. Mirrlees. An exploration in the theory of optimal income taxation. Review of Economic Studies, 38:175-208, 1971.
- [Peters and Lackner, 2020] D. Peters and M. Lackner. Pref- erences single-peaked on a circle. Journal of Artificial In- telligence Research, 68:463-502, 2020.
- [Peters et al., 2021] D. Peters, G. Pierczynski, N. Shah, and P. Skowron. Market-based explanations of collective de- cisions. In Proceedings of AAAI-2021, pages 5656-5663. AAAI Press, 2021.
- [Rey and Maly, 2023] S. Rey and J. Maly. The (compu- tational) social choice take on indivisible participatory budgeting. Technical Report arXiv.2303.00621 [cs.GT], arXiv.org, 2023.
- [Roberts, 1977] K. Roberts. Voting over income tax sched- ules. Journal of Public Economics, 8(3):329-340, 1977.
- [Szufa et al., 2020] S. Szufa, P. Faliszewski, P. Skowron, A. Slinko, and N. Talmon. Drawing a map of elections in the space of statistical cultures. In Proceedings of AAMAS- 2020, pages 1341-1349, 2020.
- [Szufa et al., 2022] S. Szufa, P. Faliszewski, L. Janeczko, M. Lackner, A. Slinko, K. Sornat, and N. Talmon. How to sample approval elections? In Proceedings of IJCAI- 2022, pages 496-502, 2022. IJCAI
- [Walsh, 2015] T. Walsh. Generating single peaked votes. Technical Report arXiv:1503.02766 [cs.GT], arXiv.org, March 2015.
- [Wilder and Vorobeychik, 2019] B. Wilder and Y. Vorobey- chik. Defending elections against malicious spread of mis- information. In Proceedings of AAAI-2019, pages 2213- 2220, 2019.
References were extracted automatically from the PDF and may contain errors.
Full text extracted automatically from the PDF; figures, tables and equations may differ. The PDF is the version of record.
1 Introduction
Computational social choice is an interdisciplinary area that draws on artificial intelligence, computer science theory, economics, operations research, logic, social sciences, and many other fields [Brandt et al., 2016]. Its main goal is algorithmic analysis of collective decision making processes, but over time noncomputational approaches, such as the axiomatic method or game-theoretic considerations, have also become popular and are pursued equally vigorously. Up to a few years ago, results in computational social choice were largely theoretical and only recently numerical experiments-not to mention actual empirical studies-have received more notable attention. In this survey, our goal is to encourage further experimental studies on elections and voting, a prominent subarea of computational social choice, by presenting a Guide. Our Guide has two main components:
- On the one hand, the Guide surveys how experiments were performed so far, what election sizes were considered, how data was obtained, and what parameters were considered. Such information is helpful when planning one's own experiments, e.g., to stay in sync with the literature. In this sense, the paper is akin to a tourist guide, which shows the richness of the landscape that one would see, e.g., upon visiting a city.
- On the other hand, we want to point out good practices and make recommendations as to how experiments should be run. While each experiment is different and
requires specific considerations, there are also general rules of thumb that one might want to follow (such as using at least several data sources, which in the past has often been neglected). In this sense, our guide takes a role of a "how to" document, giving advice.
To achieve these goals, we have gone over all papers published in the AAAI, IJCAI, and AAMAS conference series between 2010 and 2023 and collected those that discuss elections and voting (or some very similar structures; see Section 2 for details on the collection process).
For each of the collected papers, we have analyzed how the authors obtained preference data for their experiments, which statistical cultures (i.e., models of generating synthetic data) they used and with which parameters, and what election sizes they considered. A large part of the survey is discussing the conclusions from this analysis. This includes providing general statistics (such as the number of papers that include experiments in various years, or the number of data sources used by the papers) and an overview of popular statistical cultures. We contrast these observations with the map of elections, as introduced by Szufa et al. [2020] and Boehmer et al. [2021], which shows relations between various statistical cultures and real-life data sets, as well as with the microscope of Faliszewski et al. [2023b], which visualizes specific elections (and, effectively, specific synthetic models). We use these tools to give some advice as to which statistical models are possibly more appealing than others.
We complement our work by providing Python implementations of the most popular models for sampling approval and ordinal elections https://github.com/COMSOC-Community/ prefsampling and a website with access to our database of papers https://guide.cbip.matinf.uj.edu.pl/. Due to limited space, we mostly focus on ordinal elections.
2 Collecting Data
We have collected all papers that were published in the AAAI, IJCAI, and AAMAS conference series between 2010 and 2023 (in case of IJCAI we have also collected the papers from 2009). For the Guide, we selected papers that contained numerical experiments on elections (or very related structures).
By an election, we mean a pair E = (C, V ), where C = {c1, . . . , cm} is a set of candidates and V = (v1, . . . , vn) is a sequence of voters that express preferences over these candidates. In an ordinal election each voter vi has a preference order, i.e., a strict ranking ≻vi of the candidates, from the one that vi likes most to the one that he or she likes least. In an approval election, each voter vi has a set A(vi) ⊆ C of candidates that he or she approves. Occasionally, authors consider preferences in the form of either weak or partial orders, or, for example, expressed over some combinatorial domain (e.g., see the literature on CP-nets [Lang and Xia, 2016]). We include papers that study such elections as well.
We restrict our attention to papers that include elections with at least three candidates. Indeed, two-candidate elections are very different from those with at least three. 1 As a consequence, we do not include numerous papers that study, e.g., a setting where two parties compete (as, e.g., the work of Borodin et al. [2018]) or which are motivated by presidential elections with two candidates (as, e.g., the paper of Wilder and Vorobeychik [2019]), or which focus on liquid democracy and voting over two options (as examples, see the works of Colley et al. [2023] and Bloembergen et al. [2019]).
Occasionally we ran into gray areas and bent (or not) our rules on an individual basis. 2 We hope that most readers would agree with most of our choices. We list and cite all the 163 papers that we included in the Guide, together with meta-data about their experiments, in the full version of the paper [Boehmer et al., 2024].
Collecting Papers. We have downloaded the papers from the respective conferences in September 2023, using the links from the DBLP website. 3 This way we included all tracks of the conferences, including, e.g., demo or doctoral consortium papers, etc. We skipped 34 papers, whose links were missing or were corrupted and which could not be downloaded manually from any official source. Then, we performed an automated screening to select a long list of papers that might contain experimental studies of elections. Specifically, for each paper we checked whether it included keywords related to elections and experiments (the keywords were election, vote, and ballot for elections, and experiment, simulation, and empirical for the experiments; to pass the screening, a paper had to include words from both groups, on at least two pages). We looked at each paper that passed the keyword-based screening and checked if it indeed regarded elections and included experiments. While our sets of keywords were selected to limit the number of papers that we had to analyze manually, they were also meant to not be very restrictive. For example, IJCAI-2023 included 846 papers of which 41 passed the initial screening, but only 7 passed manual checking and made it to the Guide.
RecordingExperiments. Finally, we have analyzed the experiments that the collected papers included. For each experiment, we recorded the type of elections used (ordinal or approval), how the votes were obtained (e.g., if they were generated from some statistical culture or were based on real-life data), the sizes of the considered elections (expressed as numbers of candidates and voters), and the number of samples used to obtain each "data point" (the notion of a data point is paper specific; in most cases it meant the number of elections generated for each datapoint on some plot). For each of these parameters we recorded additional notes, if we felt that some further comments would be helpful.
1 Naturally, we include papers that consider two candidates as a special case, in addition to larger candidate sets.
2 For example, we did not include the work of Peters et al. [2021] in the Guide as in the conference versions the authors mention conclusions from experiments, but do not describe their details.
3 Source: https://dblp.org/xml/release/dblp-2023-09-01.xml.gz
Remark 2.1. Authors often consider elections where some parameter-such as the number of voters-changes with a particular step (e.g., from 20 to 100 voters, with a step of 5). In such cases, we recorded the range of election sizes considered, but omitted the step parameter. Indeed, we felt that availability of such data would not affect our analysis too strongly, but would hinder data collection.
We stress that our notion of what counts as one experiment is not necessarily aligned with how the papers view this issue. For example, if some hypothetical paper described two "experiments," where in the former it considered the running time of some algorithm and in the latter it analyzed whether some property is satisfied, but it used the same (or, identically generated) data for both, then we would have recorded this as a single experiment. Similarly, if a paper included a single "experiment," such as, e.g., testing manipulability of some voting rule, but within this "experiment" it first focused on a particular statistical culture and a range of election sizes, and then it moved to a different culture and a different range of sizes, then we would record this as two experiments.
3 Bird's Eye View of The Guide
In this section we present some statistics regarding the papers in the Guide and the elections that they consider.
3.1 Number of Papers
At the time of writing this survey, the Guide included 163 papers (we intend to continue our work and keep collecting papers from future years and, hopefully, further sources). In Figure 1a we plot the number of papers that we downloaded for each of the considered conferences, and in Figure 1b we show how many papers in each of the conferences included numerical experiments on elections. Generally, the number of experimental works is increasing, especially if one compares years 2010-2016 and 2017-2023, but it is unclear how strong this trend is. In particular, there was a significant decrease in 2021 and a significant increase in 2023. It remains to see if 2023 was continuing the trend, or if it were catching up with the papers "missing" in 2021 (it is tempting to speculate that the decrease in 2021 was due to the COVID-19 pandemics but, as Figure 1a shows, the overall number of papers in the conferences has not decreased as dramatically).
In Figure 1c we plot the number of papers in the Guide that consider either experiments on ordinal or approval elections. While, so far, ordinal elections have received far greater attention (altogether 130 papers consider them, whereas only 35 papers include experiments on approval ones; with some papers including both types of elections), it is evident that in Candidates Voters recent years approval elections have become popular. One of the reasons for this partial shift of interest is that approval elections are very natural in the context of multiwinner elections [Faliszewski et al., 2017; Lackner and Skowron, 2023] and in participatory budgeting [Rey and Maly, 2023], two topics that received a lot of attention in recent years.
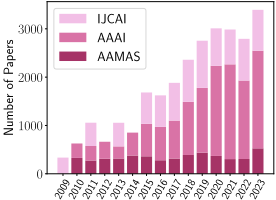
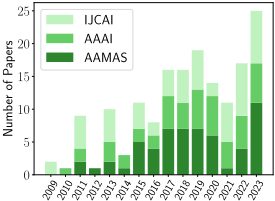
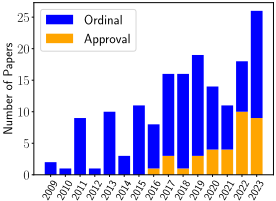
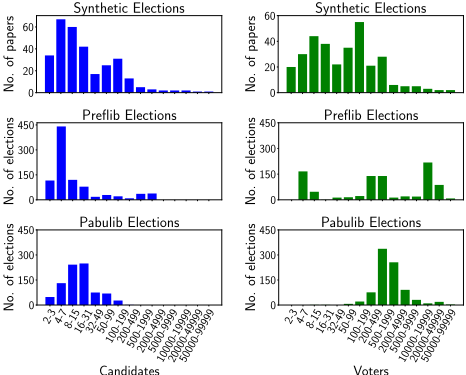
Figure 2: Histograms of the numbers of candidates and voters of synthetic elections used in the papers from the Guide (top), and in Preflib (middle) and Pabulib (bottom).
3.2 Sizes of Elections in Experiment
Next, we analyze the sizes of elections studied in the papers from the Guide. In Figure 2 we plot histograms showing how many papers consider particular numbers of candidates and voters, and in Figure 3 we show heatmaps illustrating the popularity of different combinations of these parameters. We also include analogous data for elections from the Preflib [Mattei and Walsh, 2013] and Pabulib [Faliszewski et al., 2023a] databases of real-life elections (the former mostly contains ordinal elections, whereas the latter mostly includes approval ones, only regarding participatory budgeting; Pabulib plots omit "Artificial Mechanical Turk" datasets).
| regime | candidates (m) | voters (n) | ||||
|---|---|---|---|---|---|---|
| small elections political elections voting in ground truth multiwinner lab | 2 | - | 30 | 2 | - | 30 |
| 2 | - | 20 | ≥ | 2000 | ||
| institutions | 2 | - | 30 | 30 | - | 2000 |
| participatory budgeting | 4 | - | 200 | 200 | - | 100000 |
| m | ≥ | n | ≤ | 50 | ||
| 100 | 500 | 100 | 500 | |||
100 - 500 100 - 500
Table 1: Rough classification of the ranges of numbers of candidates and voters in various types of elections in the papers from the Guide.
even if it appears in several experiments (if we recorded each election size once per experiment, the overall shape of the figures would not change much). Further, if an experiment considers elections of different sizes (for example, analyzing how its result changes as we vary the numbers of candidates or voters), then we record an election with a given size for each bucket in the histogram/heatmap to which it fits.
We identify six main regimes in which many of the papers operate, listed in Table 1. The classification is due to us, but it is inspired by what we have seen in the papers, and it takes into account the data from Preflib and Pabulib. Hence, the boundaries of the regimes are somewhat arbitrary and fluid, and papers sometimes mention other motivations for the election sizes they consider (or often omit such motivation altogether). Further, the classification is naturally not perfectly accurate and rather focuses on capturing general trends and pragmatics. For example, it is possible that there is some (fairly atypical) real-life political election with 30 candidates and 500 voters, even though we classify such elections as having between 2 and 20 candidates, and at least 2000 voters. As many papers that consider elections from a given regime do not mention this explicitly as their motivation or goal, it is reassuring that, nonetheless, the community focused on elections that match natural, realistic settings (with the possible exception of the multiwinner lab one, which is not particularly realistic, but has other redeeming features). Below we discuss the regimes in detail.
Small Elections. This regime includes the smallest elections and captures, e.g., groups of friends voting on where to have lunch or small committees within companies, e.g., deciding who to hire (given a shortlist). However, generally, papers using this type of data do not explicitly state their motivation. Experiments over small elections are sometimes conducted to provide illustrations for theoretical results, rather than to get new insights. Notably, small elections are often chosen due to technical challenges, for instance when the studied problems are computationally difficult. They also often arise in studies done on human subjects.
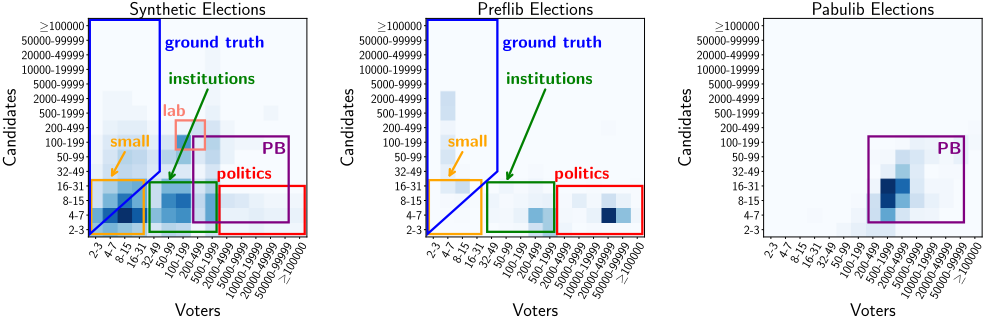
Politics. The next group regards various forms of political elections, with a limited number of candidates (m ≤ 20) and a comparably high number of voters (n ≥ 2000). Papers that use elections of these sizes and point to specific motivations indeed typically mention some form of political elections, such as parliamentary, city board, referendum, or presidential (nominee) ones. Accordingly, political elections from Preflib (e.g., the Irish dataset) are particularly popular in such papers. The only other application scenario that is occasionally mentioned is crowdsourcing, e.g., in the form of large-scale surveys (such as the Sushi survey on Preflib) or peer grading.
Voting in Institutions. Our next regime involves fairly small groups of up to 30 candidates and slightly larger numbers of voters (up to 2000), which can be seen as the sizes of a typical election in an institution such as, e.g., a professional association. 4 However, papers using these election sizes often do not focus on particular applications and simply find this setting appealing. Indeed, elections from this regime are sometimes used due to the hardness of computational problems studied, as they often allow for sufficiently realistic, but manageable experiments. Papers using such elections focused on a wide range of topics, involving matching, party elections, iterative voting, or randomized voting rules. It is also worth mentioning that many papers in this category included other (smaller or larger) election sizes.
4 Elections to the IFAAMAS Board of Trustees, with over 300 eligible voters, are a possible real-life example, and ERS data from Preflib is another. On the other hand, presidential elections of the American Psychological Associate (APA) that are available on Preflib have around 5 candidates and 17'000 voters and are thus perhaps closer to the political setting.
PB Elections. Instances in this group are mostly real-life participatory budgeting elections from Pabulib. They typically contain hundreds (at most 220) of candidates and more than 200, but up to tens of thousands, of voters. There is no canonical way of using the resources from Pabulib. Authors usually consider either (i) all elections that are available at the time they access Pabulib; (ii) elections that satisfy certain size criteria (e.g., have at least 10 candidates); or (iii) elections that are of high enough quality (i.e., large-sized elections with a high average number of approvals per voter), such as PB elections from Warsaw from the years 2020-2023.
Multiwinner Lab. This type of election contains mid-sized instances that are characteristic to experimental analyzes of multiwinner voting rules (with very few exceptions). Papers, many of which are written by some of the coauthors of this survey, often argue that the considered numbers of candidates and voters, both between 100 and 500, balance the trade-off between running times of algorithms and the structural complexity of the preferences. Briefly put, these elections are big enough to be interesting in the context of studied properties, but small enough for the respective computational techniques. Elections with equal numbers of voters and candidates, specifically m = n = 100 and m = n = 200, are particularly prevalent. At times, the number m of candidates is determined by the desired committee size k with the goal to obtain a certain (e.g., integral) value of m/k. Naturally, these elections are typically generated using synthetic models.
Search for Ground Truth. This class of elections is slightly more vague. It contains elections where there are different "credible" sources of information (n ≤ 50) ranking a variety of candidates (m > n) and typically the goal is to aggregate these sources to recover an objective quality ranking of the candidates. These elections appear in many papers with a range of mentioned application scenarios including aggregating the opinions of experts (e.g., judges or funding panel members), aggregating rankings of items according to different criteria (e.g., price, outward appearance,...), aggregating rankings of athletes in different types of competitions (e.g., Olympic climbing), aggregating the outputs of different computer systems (e.g., machine translation systems or search engines), or deciding which items to select for a small group. Elections of these sizes are typically generated from the impartial culture model (even more frequently than in the other regimes), whereas the Mallows model, which would be a natural choice for such scenarios, and real-world data are rarely used (see Section 4 for a discussion of statistical cultures). Real-world datasets from Preflib that fall into this category include different sports competitions (such as Formula 1 and speed skating), criteria-based rankings (e.g., of cities, countries and universities), and rankings output by different search engines according to the same query.
3.3 Statistics of Data Sources
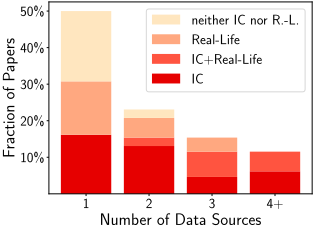
From now on, we almost exclusively focus on ordinal elections (we briefly go back to approval ones in Section 5). Overall, in 130 papers we identified 213 experiments that were using ordinal elections. Most of them (62.3%) used only synthetic data. It is a bit worrisome that 16.2% of the papers relied solely on the highly unrealistic impartial culture model (where we choose votes uniformly at random). About 13.8% of the papers used only real-life elections (mostly from Preflib), with the Sushi dataset being the most popular. We include aggregated statistics about the number of data sources for ordinal elections in Figure 4. We give statistics for specific models in the next section.
4 Statistical Cultures for Ordinal Elections
In this section we take a closer look at the most popular statistical cultures, i.e., models of generating synthetic preference data, for ordinal elections (over 73.8% of the papers use at least one of the cultures that we describe, and this fraction grows to over 90.7% if we include real-life data). Below we provide their definitions and discuss their use in the papers from the Guide, including common parameter settings. Further, in Figure 5 we illustrate elections that these models generate as well as the relations between the models on a map of elections. The swap distance between two preference orders u and v, denoted κ(u, v), is the number of pairs of candidates a and b, such that u and v disagree on their ranking (i.e., one of them ranks a above b, and the other ranks b above a).
Maps of elections are a way to visualize an election dataset and have been introduced by Szufa et al. [2020] and Boehmer et al. [2021]. Specifically, for each two elections in the dataset we measure their similarity (using the isomorphic swap distance [Faliszewski et al., 2019]) and visualize them as points on a plane, so that the Euclidean distances between the points resemble these similarities (we use the MDS embedding [Kruskal, 1964]). Crucially, the maps use distances that are invariant to renaming the candidates and voters and, hence, illustrate structural similarities between the elections. Further, our maps include three special elections as reference points: Identity (ID), where all votes are the same, antagonism (AN), which has two equal-sized groups of voters with opposite preference orders, and an approximation of a uniformity (UN) election, where each possible vote appears once.
Following Faliszewski et al. [2023b], we also include "microscope" maps of specific types of elections. To form such a "microscope", we take a single election, measure the swap distance between each pair of its votes, and then draw a picture where each disc represents a single vote (with its size representing the number of identical votes) and the Euclidean distances between the discs resemble the swap distances between the votes. This allows one to understand internal structures of the considered elections. We recommend looking at the "microscopes" whenever one uses data from a new source.
Impartial Culture (Used in 54.6% of the Papers). Under the impartial culture (IC) model we generate votes oneby-one, choosing each preference order uniformly at random. Consequently, there is no apparent structure among the votes, as seen in Figure 5. While by now the model is part of the folklore, its first use dates back to the work of Guilbaud [1952], who studied the probability of the Condorcet paradox. It is commonly agreed that impartial culture does not generate realistic elections but, nonetheless, it is used in over 54% of the papers. Indeed, the model is extremely simple and does not require setting any parameters. This means that every experiment that uses IC, uses the very same distribution. Consequently, it has become the baseline that many researchers evaluate their results against. We largely agree with this use of IC as a common yardstick, but we very strongly encourage the use of further models in experiments, to get a broader view of the studied phenomena.
Impartial anonymous culture (IAC), introduced by Kuga and Nagatani [1974] and Fishburn and Gehrlein [1978], is a variant of IC where each voting situation is equiprobable (a voting situation associates each vote with the number of voters that cast it). Impartial anonymous and neutral culture (IANC) further abstracts away from candidate names [E˘gecio˘glu and Giritligil, 2013]. Unless there are very few candidates or the number of voters is huge, IAC and IANC generate elections that are very similar to IC.
MallowsModel (Used in 28.5%of the Papers). Using the Mallows model [Mallows, 1957] is the second most popular way to generate synthetic elections in the Guide. This is quite positive as recent work indicated that it provides a good coverage of the space of real-life elections [Boehmer, 2023; Boehmer et al., 2022]. In Figure 5, Mallows elections form a line between ID and UN. The basic idea is that there is an underlying "ground truth" ordering v∗ of the candidates and that the probability of sampling a vote from the model decreases with the vote's distance from v∗ . The expected distance can be controlled by a dispersion parameter ϕ ∈ [0, 1]. Formally, the probability of sampling a vote v is proportional to ϕκ(v,v∗ ) . (Occasionally authors express the probability of sampling a vote v as proportional to e-ϕ·κ(v,v∗ ) , as done, e.g., in the work of Doucette and Cohen [2017]. This is correct, but yields a different range of ϕ values.)
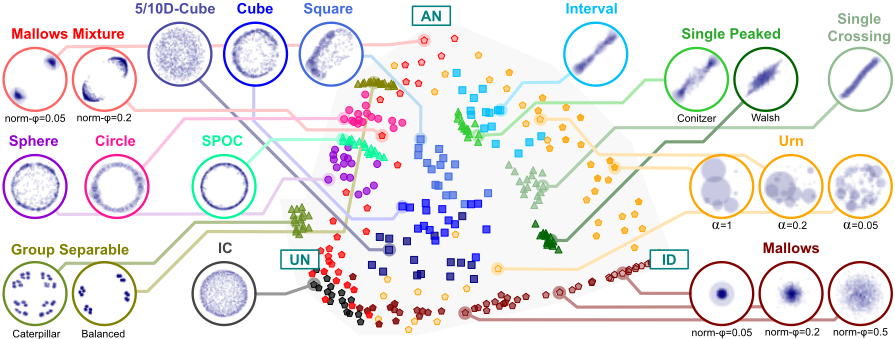
Authors often consider multiple values of the dispersion parameter at equal distances from each other (e.g., ϕ ∈ {0.1, 0.2, . . .}), but single values (e.g., ϕ = 0.8 or ϕ = 0.5) appear as well. Generally, there is a trend toward using larger values. Another strategy is to not consider specific, fixed values and, instead, generate elections by first sampling a value of the dispersion parameter uniformly from some prespecified range and then drawing votes from the resulting distribution (see e.g., the works of Bachrach et al.; Boehmer et al.; Faliszewski et al. [2016; 2023a; 2023b]). This procedure creates a diverse dataset without the need for separate evaluations. Mixtures of Mallows models combining multiple models with different central orders and dispersion parameters with some weight function on top have also been used, but less frequently (an example of such a mixture, with the voters equally split between two Mallows models with equal noise and opposite central orders, is visible in Figure 5).
Recently, Boehmer et al. [2021; 2023b; 2023] argued that there are certain issues when using the Mallows model. In particular, they showed that equally-spaced values of the dispersion parameter do not provide a uniform coverage of the space between ID and UN elections: For larger numbers of candidates, parameter values below, say, 0.8 will result in elections where votes are fairly similar to each other (this, indeed, justifies the use of high ϕ values in previous works). Moreover, they argued that fixing a dispersion parameter and changing the number of candidates fundamentally changes the nature of the sampled elections, thus rendering results for different numbers of candidates incomparable. They provided a new parameter, norm-ϕ, that ensures that uniformlyselected parameter values provide uniform coverage of the space between ID and UN (indeed, to generate Mallows elections for Figure 5, we were choosing norm-ϕ ∈ [0, 1] uniformly at random): Given a value of norm-ϕ ∈ [0, 1], one computes classic ϕ so that the expected swap distance between the central vote and one generated using the Mallows model is norm-ϕ = 1/4 · m(m- 1) (where m is the number of candidates). We point to their paper(s) for further explanations, intuitions, and ways of computing ϕ given norm-ϕ.
Pólya-Eggenberger Urn Model (Used in 15.3% of the Papers). The Pólya-Eggenberger urnmodel [Eggenberger and Pólya, 1923; Berg, 1985] uses a nonnegative parameter of contagion α ∈ R, which corresponds to the level of correlation between the votes. Votes are generated iteratively as follows: We imagine an urn which initially contains one copy of each possible order; to generate a vote, we draw one from the urn, include its copy in the election, and return it to the urn, together with α · m! copies, where m is the number of candidates. 5 For α = 0 we get IC, and for α = 1/m! we get IAC [E˘gecio˘glu and Giritligil, 2013].
Among the considered papers, 20 conducted experiments on the urn model. Typical values of α were 10/m!, 0.05, 0.1, 0.2, 0.5, and 1. In a few papers, particularly regarding the map of elections, α was derived from the Gamma distribution with shape parameter k = 0.8 and scale parameter θ = 1 (and this is how we generated the urn elections for Figure 5).
Euclidean Elections (Used in 20%of the Papers). Under a Euclidean model, we assume that the candidates and voters are represented as points in some d-dimensional Euclidean space. Typically, these points are sampled uniformly at random from a d-dimensional cube (usually [0, 1]d , for d = 1 this is the Interval model, for d = 2 the Square model, and for d = 3 the Cube model). Occasionally other distributions are considered (such as various forms of Gaussian distributions and uniform distribution over a d-dimensional sphere; for d = 2 this is the Circle model and for d = 3 the Sphere model). Each voter's ranking is constructed so that he or she ranks candidates whose points are closer to his or hers higher than those whose points are further away.
5 This normalized variant is due to McCabe-Dansted and Slinko [2006]; in the unnormalized variant the parameter gives the absolute number of the additional copies put back into the urn.
Among the considered papers, 25 conducted experiments on Euclidean preferences. The most popular choice was the 2D setting (18 papers), followed by the 1D one (12 papers). Some papers additionally investigated higher dimensions, reaching up to the 20D model (e.g., Boehmer et al. [2023a], Boehmer et al. [2021] and Szufa et al. [2020]).
Single-Peaked Elections (Used in 9.2% of the Papers). Single-peakedness is one of the most prominent structured domains. An election is single-peaked [Black, 1958] if there is an ordering of the candidates-the societal axis-such that for each voter, sweeping through the axis from left to right, the position of the corresponding candidates in the voter's ranking first increases and then decreases. Single-peaked elections are usually motivated by the fact that they cover applications in which there is an objective order of candidates; a typical example being the political left-to-right spectrum.
In practice, authors use two main methods to generate such elections. Both of them first select an axis uniformly at random. The model proposed by Walsh [2015] uses a uniform distribution over the votes that are single-peaked for the selected axis. In the model proposed by Conitzer [2009], to generate a vote we first pick uniformly at random its top choice. Then, to fill the next position in the ranking, we flip a symmetric coin and either select the first unused candidate to the right or to the left of the top-choice one. We repeat the procedure until all positions are filled (or the remaining positions are uniquely determined).
While the Walsh approach seems more appealing as a single-peaked variant of impartial culture, the Conitzer approach is interesting because it gives elections very similar to the 1D-Euclidean ones (where the candidate and voter points are sampled uniformly at random from an interval). Consequently, multiple papers with experiments on both Walsh and Conitzer models show that they tend to give qualitatively different elections. Thus, when studying single-peaked elections, we recommend using both approaches.
Single-peakedness on a circle (SPOC) is a variant of single-peakedness where the axis is cyclic [Peters and Lackner, 2020]. Sampling SPOC elections using the Conitzer's approach leads to a uniform distribution of such votes.
Single-Crossing Elections (Used in 4.6% of the Papers).
An election is single-crossing if we can order all the votes in a way that for every pair of candidates all the voters either prefer one of them to the other, or the relative preference between them changes exactly once when going from the first to the last vote in the ordering [Mirrlees, 1971; Roberts, 1977]. It is unknown how to sample such votes uniformly at random in polynomial time (and, indeed, doing so might be challenging). Szufa et al. [2020] give a sampling heuristic which seems reasonable, but makes no guarantees about its distribution (we use it in Figure 5).
Group-Separable Elections (Used in 3% of the Papers). A group-separable election [Inada, 1964; Inada, 1969] can be characterized by a rooted, ordered tree whose leafs are candidates (Inada's definition was different, we follow an approach of Karpov [2019]). Then, each vote in such an election must be obtainable by, first, reversing the order of children of arbitrary internal nodes of the tree (possibly none), and then reading the candidates from leaves from left to right. In the considered experiments, only group-separable elections with balanced or caterpillar trees were considered and the votes were drawn uniformly at random. Such elections do not resemble real-life data, but are different from elections given by any other culture (which is visible by their distinct position in the map), thus they can capture unusual phenomena, which might be hard to spot otherwise.
Which Models to Use? There is no clear answer as to which statistical cultures are the best in some objective sense. However, there are three natural approaches to choosing which models to use in a paper: First, one might want to cover as much of the space of elections as possible (this might mean including elections from structured domains, in addition to more common models). Second, one might know the nature of the real-life data that appears in a given phenomenon and might want to choose model(s) that generate similar elections. Finally, one might want to stick to realistic data, but without focusing on its specific type. In this case, results on the map of elections [Boehmer et al., 2021; Boehmer et al., 2022; Faliszewski et al., 2023b] suggest choosing cultures that land in a triangle between ID, UN, and Euclidean elections (for dimension 2 or higher). This might mean, e.g., using the Mallows model, urn models with fairly low contagion parameters, and Euclidean models (such as, e.g., the 5D-Cube).
5 Approval Elections and Conclusions
For an analysis of approval elections, we point to the full version of the paper [Boehmer et al., 2024]. Briefly put, we observed that real-life data is used much more often than in the ordinal case, i.e., in nearly 46% of the papers. Regarding synthetic elections, variants of Euclidean and IC models are clearly dominant. Indeed, about 91% of recorded experiments used data from at least one of these three sources. We suggest using at least one of them, for comparison. Other models received notably less attention, even though some are quite appealing [Szufa et al., 2022].
Looking back, we see that impartial culture and real-life data are popular both in the ordinal and approval settings. While the ordinal world uses real-life data less frequently and fairly often considers structured domains, in the approval world the situation is the opposite. We hope that our analysis will help researchers to see current trends and approaches, and will allow them to design more conclusive experiments. We suggest the use of real-life data, Euclidean models (especially with higher dimensions), normalized Mallows model, and urn elections (with small contagion parameter). IC is a yardstick to measure against previous papers, and structured domains can give otherwise difficult-to-spot insights.
Acknowledgements
- W˛ as was partially supported by EPSRC under grant EP/X038548/. The research presented in this paper is supported in part from the funds assigned by Polish Ministry of Science and Technology to AGH University. This project has received funding from the French government under management of Agence Nationale de la Recherche as part of the "Investissements d'avenir" program, reference ANR-19-P3IA0001 (PRAIRIE 3IA Institute), and from the European Research Council (ERC) under the European Union's Horizon 2020 research and innovation programme (grant agreement No 101002854).


@inproceedings{ijcai2024p881,
  title     = {Guide to Numerical Experiments on Elections in Computational Social Choice},
  author    = {Boehmer, Niclas and Faliszewski, Piotr and Janeczko, Łukasz and Kaczmarczyk, Andrzej and Lisowski, Grzegorz and Pierczyński, Grzegorz and Rey, Simon and Stolicki, Dariusz and Szufa, Stanisław and Wąs, Tomasz},
  booktitle = {Proceedings of the Thirty-Third International Joint Conference on
               Artificial Intelligence, {IJCAI-24}},
  publisher = {International Joint Conferences on Artificial Intelligence Organization},
  editor    = {Kate Larson},
  pages     = {7962--7970},
  year      = {2024},
  month     = {8},
  note      = {Survey Track},
  doi       = {10.24963/ijcai.2024/881},
  url       = {https://doi.org/10.24963/ijcai.2024/881},
}
TY - CPAPER TI - Guide to Numerical Experiments on Elections in Computational Social Choice AU - Boehmer, Niclas AU - Faliszewski, Piotr AU - Janeczko, Łukasz AU - Kaczmarczyk, Andrzej AU - Lisowski, Grzegorz AU - Pierczyński, Grzegorz AU - Rey, Simon AU - Stolicki, Dariusz AU - Szufa, Stanisław AU - Wąs, Tomasz T2 - Proceedings of the Thirty-Third International Joint Conference on Artificial Intelligence, IJCAI-24 PB - International Joint Conferences on Artificial Intelligence Organization PY - 2024 SP - 7962 EP - 7970 DO - 10.24963/ijcai.2024/881 UR - https://doi.org/10.24963/ijcai.2024/881 ER -Copied
Machine-readable versions of this paper, for tools and AI agents:





