
BrainCGT: A Brain Graph Transformer for Modeling Causal Connectivity in Neurological Disorder Diagnosis
Proceedings of the Thirty-Fifth International Joint Conference on Artificial Intelligence. AI4Tech: AI Enabling Technologies. Pages 6509-6517.
https://doi.org/10.24963/ijcai.2026/724
Keywords
- Emerging AI4Tech : Emerging AI4Tech areas
- Advanced AI4Tech: Data-driven AI4Tech
- Domain-specific AI4Tech: Other AI4Tech applications
- Domain-specific AI4Tech: AI4Care and AI4Health
- Advanced AI4Tech: Neuro AI4Tech
Abstract
Brain connectivity analysis is a fundamental tool for identifying biomarkers and understanding of neurological disorders. Most existing approaches employ graph transformers over undirected functional connectivity networks, which are typically estimated using correlation statistics. Although effective for capturing statistical associations, these models do not represent directed interactions between brain regions that arise from causal relationships. As a result, direction-specific disease mechanisms are not explicitly modeled, and interpretability is often limited. To address this gap, we present BrainCGT, a brain graph transformer designed to model causal connectivity inferred from fMRI time-series data. In this framework, brain networks are modeled as directed graphs with a modular organization, where nodes correspond to individual brain regions and directed edges reflect causal flow of information between them. Direction-aware node representations together with direction-biased attention mechanisms allow the model to capture asymmetric interactions across regions. Experimental results on three large-scale fMRI datasets demonstrate that BrainCGT achieves consistently better performance than existing graph-based methods for neurological disorder classification. In addition, examination of the learned attention structures shows correspondence with established neurobiological pathways, suggesting improved interpretability. These results highlight the importance of incorporating causal directionality into brain graph transformer architectures for robust and interpretable neuroimaging analysis.
- [Abid et al., 2025] Shagufta Abid, Dongyu Zhang, Ahsan Shehzad, Jing Ren, Shuo Yu, Hongfei Lin, and Feng Xia. Speechhgt: A multimodal hypergraph transformer for speech-based early alzheimer's disease detection. In Proceedings of the Thirty-Fourth International Joint Con- ference on Artificial Intelligence, IJCAI-2025, pages 9131- 9139. International Joint Conferences on Artificial Intelli- gence Organization, September 2025. IJCAI
- [Alharthi and Alzahrani, 2023] Asrar G. Alharthi and Salha M. Alzahrani. Do it the transformer way: A comprehensive review of brain and vision transformers for autism spectrum disorder diagnosis and classification. Comput. Biol. Medicine, 167:107667, 2023.
- [Arab et al., 2025] Fahimeh Arab, AmirEmad Ghassami, Hamidreza Jamalabadi, Megan A. K. Peters, and Erfan Nozari. Whole-brain causal discovery using fmri. Network Neuroscience, 9(1):392-420, 2025.
- [Bullmore and Sporns, 2009] Ed Bullmore and Olaf Sporns. Complex brain networks: graph theoretical analysis of structural and functional systems. Nat. Rev. Neurosci., 10(3):186-198, Feb 2009.
- [Cui et al., 2023] Hejie Cui, Wei Dai, Yanqiao Zhu, Xuan Kan, Antonio Aodong Chen Gu, Joshua Lukemire, Liang Zhan, Lifang He, Ying Guo, and Carl Yang. Braingb: A benchmark for brain network analysis with graph neu- ral networks. IEEE Trans. Med. Imaging, 42(2):493-506, 2023.
- [Dai et al., 2019] Zhengjia Dai, Qixiang Lin, Tao Li, Xiao Wang, Huishu Yuan, Xin Yu, Yong He, and Huali Wang. Disrupted structural and functional brain networks in alzheimer's disease. Neurobiology of Aging, 75:71-82, March 2019.
- [Delgado-Alvarado et al., 2023] Manuel Delgado-Alvarado, Vicente J. Ferrer-Gallardo, Pedro M. Paz-Alonso, César Caballero-Gaudes, and María C. Rodríguez-Oroz. Interac- tions between functional networks in Parkinson's disease mild cognitive impairment. Scientific Reports, 13(1):19177, November 2023.
- [Dong et al., 2024] Qunxi Dong, Hongxin Cai, Zhigang Li, Jingyu Liu, and Bin Hu. A multiview brain network trans- former fusing individualized information for autism spec- trum disorder diagnosis. IEEE Journal of Biomedical and Health Informatics, 28(8):4854-4865, August 2024.
- [Fan et al., 2016] Lingzhong Fan, Hai Li, Junjie Zhuo, Yu Zhang, Jiaojian Wang, Liangfu Chen, Zhengyi Yang, Congying Chu, Sangma Xie, Angela R. Laird, Peter T. Fox, Simon B. Eickhoff, Chunshui Yu, and Tianzi Jiang. The human brainnetome atlas: A new brain atlas based on con- nectional architecture. Cerebral Cortex, 26(8):3508-3526, May 2016.
- [Hao et al., 2024] Xiaoke Hao, Jingyi Wang, Zilong He, Yingchun Guo, Ming Yu, Feng Liu, Jing Qin, and Dao- qiang Zhang. Multi-cluster self-paced diverse learning and feature fusion for autism spectrum disorder identification with resting-state fMRI. IEEE Transactions on Emerg- ing Topics in Computational Intelligence, 8(6):3860-3873, December 2024.
- [Ji et al., 2023] Junzhong Ji, Aixiao Zou, Jinduo Liu, Cuicui Yang, Xiaodan Zhang, and Yongduan Song. A survey on brain effective connectivity network learning. IEEE Trans. Neural Networks Learn. Syst., 34(4):1879-1899, 2023.
- [Kong and Yu, 2014] Xiangnan Kong and Philip S. Yu. Brain network analysis: a data mining perspective. SIGKDD Explor. Newsl., 15(2):30-38, Jun 2014.
- [Li et al., 2021] Xiaoxiao Li, Yuan Zhou, Nicha Dvornek, Muhan Zhang, Siyuan Gao, Juntang Zhuang, Dustin Scheinost, Lawrence H. Staib, Pamela Ventola, and James S. Duncan. Braingnn: Interpretable brain graph neural net- work for fMRI analysis. Med. Image Anal., 74:102233, Dec 2021.
- [Liu et al., 2024] Jingyu Liu, Weigang Cui, Yipeng Chen, Yu- lan Ma, Qunxi Dong, Ran Cai, Yang Li, and Bin Hu. Deep fusion of multi-template using spatio-temporal weighted multi-hypergraph convolutional networks for brain dis- ease analysis. IEEE Transactions on Medical Imaging, 43(2):860-873, February 2024.
- [Lundberg and Lee, 2017] Scott M. Lundberg and Su-In Lee. A unified approach to interpreting model predictions. In Proceedings of the 31st International Conference on Neural Information Processing Systems, NIPS'17, pages 4768- 4777, Red Hook, NY, USA, 2017.
- [Curran Associates Inc. Luo et al., 2024] Xuexiong Luo, Jia Wu, Jian Yang, Shan Xue, Amin Beheshti, Quan Z. Sheng, David McAlpine, Paul Sowman, Alexis Giral, and Philip S. Yu. Graph neu- ral networks for brain graph learning: A survey. In Pro- ceedings of the Thirty-ThirdInternational Joint Conference on Artificial Intelligence, IJCAI-2024, pages 8170-8178. International Joint Conferences on Artificial Intelligence Organization, August 2024. IJCAI
- [Luo et al., 2025] Xuexiong Luo, Jia Wu, Jian Yang, Hongyang Chen, Zhao Li, Hao Peng, and Chuan Zhou. Knowledge distillation guided interpretable brain subgraph neural networks for brain disorder exploration. IEEE Transactions on Neural Networks and Learning Systems, 36(2):3559-3572, February 2025.
- [Marek et al., 2011] Kenneth Marek, Danna Jennings, Shirley Lasch, Andrew Siderowf, Caroline Tanner, Tanya Simuni, Chris Coffey, Karl Kieburtz, et al. The parkinson progression marker initiative (ppmi). Progress in Neurobiology, 95(4):629-635, 2011. Standard PPMI dataset citation.
- [Martino et al., 2014] A. Di Martino, C.-G. Yan, Q. Li, E. De- nio, F. X. Castellanos, K. Alaerts, J. S. Anderson, M. Assaf, et al. The autism brain imaging data exchange: towards a large-scale evaluation of the intrinsic brain architecture in autism. Molecular Psychiatry, 19(6):659-667, 2014.
- [Standard ABIDE I dataset citation. Marzi et al., 2024] Chiara Marzi, Marco Giannelli, Andrea Barucci, Carlo Tessa, Mario Mascalchi, and Stefano Di- ciotti. Efficacy of mri data harmonization in the age of machine learning: a multicenter study across 36 datasets. Scientific Data, 11(1):2, January 2024.
- [Meunier et al., 2010] David Meunier, Renaud Lambiotte, and Edward T. Bullmore. Modular and hierarchically modu- lar organization of brain networks. Front. Neurosci., 4:200, 2010.
- [Mueller et al., 2005] Susanne G. Mueller, Michael W. Weiner, Leon J. Thal, Ronald C. Petersen, Clifford Jack, William Jagust, John Q. Trojanowski, Arthur W. Toga, Lau- rel Beckett, et al. The alzheimer's disease neuroimaging initiative. Neuroimag. Clin. N. Am., 15(4):869-877, 2005. Standard ADNI dataset citation.
- [Pei et al., 2025] Shengbing Pei, Jiajun Ma, Zhao Lv, Chao Zhang, and Jihong Guan. Community-aware graph trans- former for brain disorder identification. In Proceedings of the Thirty-Fourth International Joint Conference on Artifi- cial Intelligence, IJCAI-2025, pages 4191-4199. Interna- tional Joint Conferences on Artificial Intelligence Organi- zation, September 2025. IJCAI
- [Peng et al., 2025] Ciyuan Peng, Yuelong Huang, Qichao Dong, Shuo Yu, Feng Xia, Chengqi Zhang, and Yaochu Jin. Biologically plausible brain graph transformer. In The Thirteenth International Conference on Learning Represen- tations (ICLR 2025), Singapore, April 2025.
- [Rolls et al., 2020] Edmund T. Rolls, Chu-Chung Huang, Ching-Po Lin, Jianfeng Feng, and Marc Joliot. Automated anatomical labelling atlas 3. NeuroImage, 206:116189, Feb 2020.
- [Shehzad et al., 2025a] Ahsan Shehzad, Dongyu Zhang, Shuo Yu, Shagufta Abid, Dinesh Kant Kumar, and Feng Xia. Multiscale graph transformer for brain disorder di- agnosis. IEEE Transactions on Consumer Electronics, 71(2):5535-5546, May 2025.
- [Shehzad et al., 2025b] Ahsan Shehzad, Dongyu Zhang, Shuo Yu, Shagufta Abid, and Feng Xia. Dynamic graph transformer for brain disorder diagnosis. IEEE Journal of Biomedical and Health Informatics, 29(6):4388-4400, June 2025.
- [Shehzad et al., 2026] Ahsan Shehzad, Feng Xia, Shagufta Abid, Ciyuan Peng, Shuo Yu, Dongyu Zhang, and Karin Verspoor. Graph transformers: A survey. IEEE Transac- tions on Neural Networks and Learning Systems, pages 1-20, 2026.
- [Smith et al., 2011] Stephen M. Smith, Karla L. Miller, Gho- lamreza Salimi-Khorshidi, Matthew Webster, Christian F. Beckmann, Thomas E. Nichols, Joseph D. Ramsey, and Mark W. Woolrich. Network modelling methods for fmri. NeuroImage, 54(2):875-891, January 2011.
- [Thomas Yeo et al., 2011] B. T. Thomas Yeo, Fenna M. Krienen, Jorge Sepulcre, Mert R. Sabuncu, Danial Lashkari, Marisa Hollinshead, Joshua L. Roffman, Jordan W. Smoller, Lilla Zöllei, Jonathan R. Polimeni, Bruce Fischl, Hesheng Liu, and Randy L. Buckner. The organization of the human cerebral cortex estimated by intrinsic functional connectiv- ity. J. Neurophysiol., 106(3):1125-1165, Sep 2011.
- [Van Den Heuvel and Pol, 2010] Martijn P. Van Den Heuvel and Hilleke E. Hulshoff Pol. Exploring the brain network: A review on resting-state fMRI functional connectivity. Eu- ropean neuropsychopharmacology, 20(8):519-534, 2010.
- [Vaswani et al., 2017] Ashish Vaswani, Noam Shazeer, Niki Parmar, Jakob Uszkoreit, Llion Jones, Aidan N. Gomez, Lukasz Kaiser, and Illia Polosukhin. Attention is all you need. In Isabelle Guyon, Ulrike von Luxburg, Samy Ben- gio, Hanna M. Wallach, Rob Fergus, S. V. N. Vishwanathan, and Roman Garnett, editors, Advances in Neural Informa- tion Processing Systems 30: Annual Conference on Neural Information Processing Systems 2017, December 4-9, 2017, Long Beach, CA, USA, pages 5998-6008, Long Beach, CA, USA, Dec 2017.
- [Velickovic et al., 2018] Petar Velickovic, Guillem Cucurull, Arantxa Casanova, Adriana Romero, Pietro Lio, and Yoshua Bengio. Graph attention networks. In 6th Inter- national Conference on Learning Representations (ICLR 2018), Vancouver, BC, Canada, Apr 2018. OpenReview.net.
- [Xia et al., 2025] Feng Xia, Ciyuan Peng, Jing Ren, Falih Gozi Febrinanto, Renqiang Luo, Vidya Saikrishna, Shuo Yu, and Xiangjie Kong. Graph learning. Foundations and Trends in Signal Processing, 19(4):371-551, 2025.
- [Xu et al., 2019] Keyulu Xu, Weihua Hu, Jure Leskovec, and Stefanie Jegelka. How powerful are graph neural networks? In 2019 International Conference on Learning Representa- tions (ICLR), New Orleans, LA, USA, May 2019.
- [Xu et al., 2026] Faming Xu, Yiding Wang, Gang Qu, Vince D. Calhoun, Julia M. Stephen, Tony W. Wilson, Yu- Ping Wang, and Chen Qiao. A deep spatio-temporal ar- chitecture for dynamic ecn analysis with granger causality based causal discovery. Pattern Recognition, 172:112346, April 2026.
- [Ying et al., 2021] Chengxuan Ying, Tianle Cai, Shengjie Luo, Shuxin Zheng, Guolin Ke, Di He, Yanming Shen, and Tie-Yan Liu. Do transformers really perform badly for graph representation? In 35th Conference on Neural Information Processing Systems (NeurIPS 2021), pages 2132-2144, Virtual, Dec 2021.
- [Yu et al., 2024] Shuo Yu, Shan Jin, Ming Li, Tabinda Sarwar, and Feng Xia. Long-range brain graph transformer. In The Thirty-eighth Annual Conference on Neural Information Processing Systems, pages 21453-21468, 2024.
- [Zhang et al., 2025] Tianyi Zhang, Keqi Han, Jiawei Nie, Chenyu You, Sanne van Rooij, Jennifer Stevens, Boadie Dunlop, Charles Gillespie, and Carl Yang. Causal brain connectivity: Integrating granger directed graphs in fmri analysis. In Riccardo Bellazzi, José Manuel Juarez Herrero, Lucia Sacchi, and Blaž Zupan, editors, Artificial Intelli- gence in Medicine, pages 439-444, Cham, 2025. Springer Nature Switzerland.
References were extracted automatically from the PDF and may contain errors.
Full text extracted automatically from the PDF; figures, tables and equations may differ. The PDF is the version of record.
1 Introduction
Brain network analysis is a core paradigm in computational neuroscience for studying neurological and neurodevelopmental disorders [Bullmore and Sporns, 2009]. The brain is modeled as a graph whose nodes represent anatomically or functionally defined regions and whose edges encode statistical or causal interactions. fMRI enables estimation of these graphs from temporally resolved signals and provides a principled basis for analyzing disease-related connectivity disruptions [Smith et al., 2011]. This representation offers a principled framework for analyzing connectivity disruptions associated with disease states. However, hierarchical modular organization and dynamic information exchange challenge conventional models, motivating more expressive approaches for accurate and interpretable diagnosis [Meunier et al., 2010; Kong and Yu, 2014].
∗Corresponding author.
Existing fMRI-based disease-classification models mainly use whole-brain or modular networks. Whole-brain methods build fully connected graphs from atlases such as AAL and Pearson correlation across all regions [Rolls et al., 2020]. These graphs are analyzed using handcrafted graph metrics or learned representations from end-to-end graph models [Li et al., 2021]. However, they treat the brain as homogeneous and miss modular disruptions critical to many disorders. Modular methods use community detection or predefined resting-state networks and combine modules with graph fusion or convolutional models [Thomas Yeo et al., 2011; Liu et al., 2024]. Yet most still rely on undirected functional connectivity and omit directional information flow, even when Graph Transformers are used [Xia et al., 2025; Dong et al., 2024].
Despite this progress, diagnostic graph models usually ignore causal connectivity, which captures directional influence between brain regions [Ji et al., 2023]. Such directionality is central to disorders including Alzheimer's Disease, Parkinson's Disease, and Autism Spectrum Disorder because dysfunction reflects altered causal interactions rather than isolated disconnections. Correlation-based undirected connectivity obscures these relationships, limiting diagnostic accuracy, biological interpretability, and mechanistic insight [Van Den Heuvel and Pol, 2010]. We therefore hypothesize that integrating causal connectivity into modular graph learning improves classification and reveals disorder-specific communication patterns.
To address this limitation we propose BrainCGT 1 , a causal brain graph transformer for directed interactions within and across modular brain networks. BrainCGT estimates asymmetric effective connectivity for seven functional modules using multivariate Granger causality, encodes direction-sensitive topological descriptors, and applies direction-aware attention to model disorder-specific causal interactions. We evaluate BrainCGT on ADNI, PPMI, and ABIDE for binary classification. Results show consistent gains in accuracy, F1 score, and AUC over state-of-the-art undirected graph baselines while improving biological interpretability. These findings demonstrate that explicit causal modeling improves diagnostic performance while enhancing biological interpretability of disease-related brain mechanisms.
1 The source codes are available at: https://github.com/
This paper makes the following key contributions:
- We propose BrainCGT an end to end framework that integrates causal connectivity into modular brain networks for neurological disorder diagnosis addressing information flow limitations of undirected functional connectivity.
- We introduce a causal brain graph transformer with direction aware input embeddings and direction biased attention mechanisms that encode node specific causal roles and learn asymmetric directed graph structures.
- Experimental evaluations on ADNI, PPMI, and ABIDE demonstrate that BrainCGT outperforms state of the art models while identifying interpretable disease altered causal pathways and drivers of dysfunction.
2 RelatedWork
2.1 Brain Network Analysis for Brain Diseases Diagnosis
modular graph architectures integrate multi scale information using attention mechanisms and capture intra and inter modular dependencies [Pei et al., 2025; Peng et al., 2025]. However these approaches rely predominantly on functional connectivity which produces symmetric undirected graphs reflecting statistical co activation rather than directed signaling [Xu et al., 2026]. Although causal connectivity methods infer directed graphs using techniques such as Granger causality they are typically applied at the whole brain level and neglect modular topology [Zhang et al., 2025; Arab et al., 2025].
2.2 Graph Transformers
Graph Transformer architectures overcome fundamental limitations of message passing Graph Neural Networks by enabling global dependency modeling [Shehzad et al., 2026]. Conventional GNNs rely on local aggregation which restricts receptive fields induces over smoothing and limits long range dependency extraction [Luo et al., 2024]. Graph Transformers address these constraints through self attention that directly models pairwise node interactions within a single layer [Vaswani et al., 2017]. Structural encodings preserve graph topology and guide attention toward meaningful global patterns [Ying et al., 2021]. Recent studies adapt Graph Transformers to brain networks and improve diagnostic performance by capturing global and multiscale dependencies [Alharthi and Alzahrani, 2023; Shehzad et al., 2025a; Shehzad et al., 2025b]. Transformer-based diagnosis has also expanded to multimodal settings including speech-based early Alzheimer's disease detection with hypergraph transformers [Abid et al., 2025]. However connectivity-focused approaches still rely on functional connectivity which obscures directed causal signaling and limits diagnostic precision and interpretability.
3 The Design of BrainCGT
3.1 ProblemFormulation
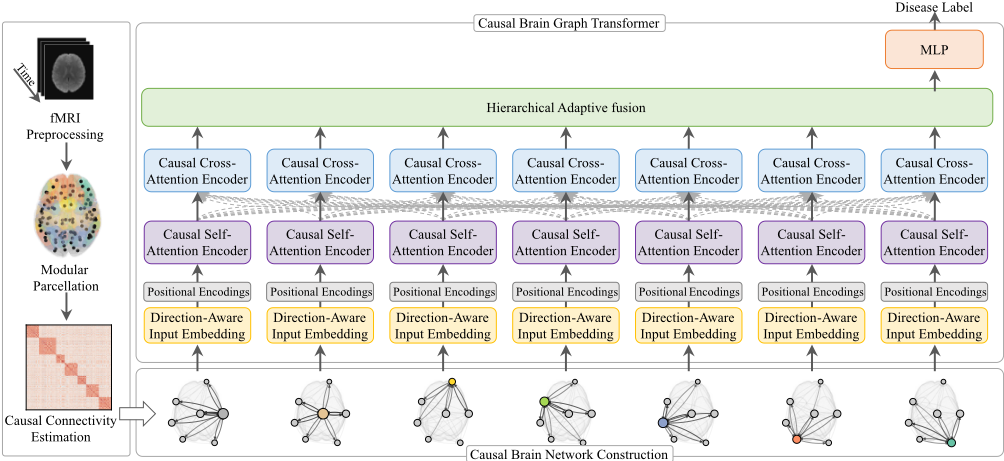
We pose neurological disorder diagnosis as a supervised graph classification problem on subject-specific causal brain networks. Let D = {(V (s) , y(s) )}Ss=1 denote S subjects where V (s) ∈ RX×Y×Z×T is a 4D fMRI volume and y(s) ∈ Y is the diagnostic label. We learn fθ : G → Y that maps each G (s) to ˆ y(s) by minimizing a classification loss L(fθ(G (s) ), y(s) ). We represent each subject by G (s) = (V, E, A(s) , X (s) ) with shared nodes V and edges E. Stage 1 parcellates V (s) into N ROIs using a modular atlas, yielding X (s) = {x(s) i (t)}Ni=1 and sparse asymmetric A(s) via multivariate Granger causality. Stage 2 uses direction-aware embeddings with intra/intermodule causal attention and hierarchical fusion to produce discriminative graph-level embeddings for classification. Posthoc interpretability quantifies causal attributions at node, edge, and module granularity. Figure 1 illustrates the framework.
3.2 Causal Brain Network Construction
fMRI Preprocessing
Preprocessing produces temporally and spatially standardized 4D fMRI volumes with statistical properties suited to multivariate autoregressive modeling. Each raw scan is Vraw ∈ RX×Y ×Z×T with spatial indices (X, Y, Z) and temporal index T and serves as input for downstreammodeling. In FSL we perform slice-timing correction and MCFLIRT motion correction and normalize to the MNI152 template using affine and non-linear transforms. We apply Gaussian smoothing with full width at half maximum of 6 mm to improve signalto-noise ratio. We regress white matter and cerebrospinal fluid signals plus six motion parameters then band-pass filter within 0.01 ≤ f ≤ 0.1 Hz. To enforce covariance stationarity we apply voxel-wise detrending and first-order differencing and harmonize multi-site datasets with ComBat. The resulting volume is Vpre ∈ RX×Y ×Z×T .
Modular Parcellation
We construct region-level representations by parcellating each preprocessed fMRI volume into anatomically defined ROIs and assigning each ROI to a functional module. We use the Brainnetome Atlas with N = 246 cortical and subcortical regions [Fan et al., 2016]. For each ROI ri we compute the regional BOLD time series xi(t) by voxel averaging,
where Vi denotes the voxel set for ri. We then assign each ROI to one of M = 7 Yeo networks [Thomas Yeo et al., 2011] via Module(i) ∈ {1, . . . ,M}. This yields the modular multivariate series X = {xi(t)}Ni=1 that supports subsequent causal inference and hierarchical transformer modeling.
Causal Connectivity Estimation
We estimate directed functional connectivity to construct subject-specific causal brain graphs. From V ∈ RX×Y ×Z×T we extract regional BOLD series {xi(t)}Ni=1 and group ROIs into functional modules [Smith et al., 2011]. For each module pair (m, n) we stack signals into Xmn(t) ∈ Rd with d = |Rm ∪ Rn|. We fit a VAR(p) model for Xmn(t) with coefficients W(mn) k ∈ Rd×d :
We select p by Bayesian Information Criterion and model residuals ϵ(t) as white noise. For each ordered pair (i, j) we test H0 : β(k) ij = 0 ∀k using an F-statistic Fij. We apply false discovery rate correction across all directed pairs and retain xi→xj when corrected p < α. For retained edges we scale influences by min-max normalization and set Aij = 0 otherwise:
The resulting sparse asymmetric A ∈ RN×N defines G = (V, E, A, X ) for the Causal Brain Graph Transformer.
3.3 Causal Brain Graph Transformer Direction-Aware Input Embedding
The input embedding stage fuses regional activity, causal topology, and anatomical position into node vectors. Given G = (V, E,A,X), |V| = N, A ∈ RN×N stores Grangercausal weights, and X = {xi(t)}Ni=1 stores BOLD signals. For each region ri, we apply PCA to xi(t) ∈ RT and retain ai ∈ R. We summarize directed influence using weighted in-degree and out-degree centralities,
We concatenate fi = [ai, din i , dout i , pi] ∈ R3+dp and project using h(0) i =Wefi +be. Stacking {h(0) i }Ni=1 yields H(0) ∈ RN×D for causal attention encoding.
Causal Self-Attention Encoder
We model localized causal interactions using intra-module causal self-attention within each functional module. Module m comprises ROIs Mm ⊆ V from the Yeo2011 parcellation and restricts attention to Mm. Head-specific matrices Wq,Wk,Wv ∈ Rda×D learn feature subspaces across attention heads for causal attention. At layer l we compute query key and value projections for nodes i, j ∈ Mm:
We score directed pairs with e(l) ij to explicitly gate attention by causality:
We define N(i) as intra-module neighbors with nonzero Aij and set α(l) ij = softmaxj∈N(i)(e(l) ij ) to enforce sparse directed message passing. For each head h we aggregate ∑j∈N(i) α(l,h) ij v(h) j and concatenate all heads to form the next embedding. We map the concatenation with Wo ∈ R(Hda)×D to obtain h(l+1) i in RD at layer l + 1:
Residual connections and layer normalization stabilize training and output Hintra ∈ RN×D with module-specific directed dependencies.
Causal Cross-Attention Encoder
To model interactions between functional modules, we introduce a cross-attention mechanism that enables ROIs in one module to aggregate causally-relevant features from ROIs in another. Given a pair of modules (Mm,Mn), where Mm is the target and Mn is the source, we compute attention scores from nodes in Mm to nodes in Mn using a gated mechanism similar to intra-module attention. For each node i ∈ Mm and each node j ∈ Mn, we compute:
The attention score is then calculated as:
where Aij is the inter-module edge weight. The normalized attention coefficient is:
We compute the updated inter-module feature for node i as:
We repeat this process across all ordered module pairs and aggregate the outputs. The resulting set of node embeddings Hinter ∈ RN×D captures cross-network information transfer modulated by causal connectivity.
Hierarchical Adaptive Fusion and Classification
We fuse intra- and inter-modular node representations using gated concatenation and attention pooling for graph-level prediction. For each node i we concatenate both streams to form zi ∈ R2D and retain both components. We compute a dynamic gate gi ∈ R2D with a sigmoid gated MLP to reweight concatenated channels:
The gate performs dimension-wise modulation for each node to produce fused embeddings:
We score each fused node for global attention pooling using si as follows:
We normalize scores across nodes with softmax and compute an attention-weighted graph embedding:
An MLP with ReLU maps hgraph to logits and a softmax yields class probabilities.
Causal Interpretability
To enable post-hoc explanation of model predictions, we adapt the GNNExplainer framework for directed, modular graphs. Given an input graph G and the predicted class ˆ y, we learn a continuous mask M ∈ RN×N over the adjacency matrix to identify the most influential edges and nodes. We formulate the optimization objective as:
where ˜ G is a perturbed version of G sampled under mask M, and λ is a sparsity regularization hyperparameter. We interpret the learned mask to produce edge-level, node-level, and module-level attribution scores. These scores highlight specific causal pathways, source nodes, and network-level disruptions that drive individual-level classifications, providing neuroscientific interpretability and potential biomarkers for clinical analysis. The pseudocode of BrainCGT is given in Algorithm 1.
4 Experimental Results
4.1 Datasets
We evaluate BrainCGT on three multi-site cohorts (see Table 1):
Algorithm 1 BrainCGT Algorithm.
- Input: Raw fMRI volume Vraw ∈ RX×Y ×Z×T Output: Predicted diagnostic label ˆ y 1: procedure BRAINCGT(Vraw) 2: /* Causal Brain Network Construction */ 3: Vpre ← Preprocess(Vraw) 4: {xi(t)}Ni=1 ←ModularParcellation(Vpre) 5: A←GrangerCausalityEstimation({xi(t)}Ni=1 ) 6: X ← {xi(t)}Ni=1 7: G ←BuildGraph(V,X,A) 8: /* Causal Brain Graph Transformer */ 9: H(0) ←DirectionAwareInputEmbedding(G) 10: Initialize model parameters θ 11: for e = 1 to E do 12: Hintra ← CausalSelfAttentionEncoder(H(0) , A) 13: Hinter ← CausalCrossAttentionEncoder(Hintra, A) 14: Hfused ← HierarchicalFusion(Hintra, Hinter) 15: ˆ y ← MLPClassifier(Hfused) 16: Compute loss Lcls(ˆ y, y) 17: Update parameters θ via backpropagation 18: end for 19: /* Causal Interpretability */ 20: CausalAttributionMaps ←GNNExplainer(G, ˆ y) 21: return ˆ y 22: end procedure
- ADNI [Mueller et al., 2005]: Controlled-access Alzheimer cohort. We use resting-state fMRI to build causal graphs and classify CN vs AD. It includes 426 subjects age 50-100, 227/199 male/female, CN n=280, and AD n=146. We drop sessions missing fMRI or metadata.
- PPMI [Marek et al., 2011]: Controlled-access Parkinson cohort. We use resting-state fMRI for causal graphs and classify Control vs PD. It includes 324 subjects age 4085, 194/130 male/female, Control n=94, PD n=230. We remove scans failing quality control.
- ABIDE [Martino et al., 2014]: Open multi-site autism cohort. We use resting-state fMRI for causal graphs and classify Control vs ASD. It includes 1,118 subjects age 8-40, 957/161 male/female, Control n=581, ASD n=537. We apply stratified sampling for site balance [Marzi et al., 2024].
| Dataset | #Subj. | Age | M/F | Labels (n) |
|---|---|---|---|---|
| ADNI | 426 | 50-100 | 227/199 | CN(280), AD(146) |
| PPMI | 324 | 40-85 | 194/130 | CN(94), PD(230) |
| ABIDE | 1118 | 8-40 | 957/161 | CN(581),ASD (537) |
4.2 Baselines
We compare against four baseline families under identical preprocessing and train/val/test splits.
- Conventional machine learning: We use SVM, random forests, and a shallow MLP on handcrafted graph descriptors. We extract degree, betweenness, clustering, assortativity, and modularity, standardize within folds, and tune by stratified grid search.
- Conventional graph learning: We evaluate GIN [Xu et al., 2019], GAT [Velickovic et al., 2018], and Graphormer [Ying et al., 2021] on directed A with ROI summaries and in/out-degree indicators. We train in PyTorch Geometric with Adam, cosine decay, and early stopping, and avoid feature selection.
- Functional connectivity models: We benchmark BrainGB [Cui et al., 2023], KDGCN [Luo et al., 2025], ALTER [Yu et al., 2024], CAGT [Pei et al., 2025], and BioBGT [Peng et al., 2025] using public releases. We estimate undirected connectivity from the same fMRI data and tune hyperparameters on validation only.
- Causal connectivity models: We include CaLLTiF [Arab et al., 2025], BrainGB with Granger causality [Zhang et al., 2025], and STDCDAE [Xu et al., 2026]. We follow each pipeline for directed connectivity estimation and keep metrics and stopping criteria identical.
Implementation Details
BrainCGT includes two modules for causal graph construction and transformer-based classification. We preprocess fMRI with nibabel, nilearn and nipype then parcellate and denoise. Multivariate Granger causality produces asymmetric adjacency matrices with module partitions and direction-aware node features. We implement the transformer in PyTorch Geometric with direction-biased attention and degree-informed embeddings. We use 5-fold stratified subject-level splits for ADNI, PPMI and ABIDE and train each dataset separately. We optimize cross-entropy with AdamW using learning rate 1×10⁻⁴ -3×10⁻⁴ , weight decay 1×10⁻⁴ and batch size 16. We train up to 200 epochs with dropout 0.2 and early stopping with patience 20 and gradient clipping.
Computational Complexity
We analyze BrainCGT complexity to quantify scalability and bottlenecks. Causal construction dominates time: modulewise VAR fitting costs O(TN 2p+N 3 p) and inter-module tests cost O(TEinterp). The transformer costs O(HDE +HND) per layer for sparse attention plus O(DN) pooling and O(D2 ) classification. Total time is O(TN 2p+N 3p+LHDE) and the dense worst case is O(LHDN 2 ). Space is O(E +ND + LHD2 +N 2 p) from sparse graphs, node embeddings, parameters, VAR coefficients, and attention buffers O(HE). Here N denotes ROIs, T time points, E edges, H heads, D hidden size, L layers, and p lag order.
4.3 Performance of BrainCGT
We evaluate BrainCGT on ADNI, PPMI, and ABIDE and summarize results in Table 2. ADNI shows balanced performance with Accuracy 75.13 ± 4.15%, F1 72.55 ± 4.72%, and AUC 75.81 ± 1.38%. PPMI attains high Accuracy 84.46 ± 2.24% but lower F1 64.92±2.39% and AUC 67.56±3.47%, indicating threshold miscalibration under class imbalance. ABIDE remains robust with Accuracy 81.62 ± 1.57% and AUC 80.94±1.59%, while F1 67.46±3.21% reflects cohort heterogeneity and site effects. Small Accuracy and AUC deviations indicate stable training and generalizable causality-aware representations.
| ADNI | PPMI | ABIDE | ||||||||
|---|---|---|---|---|---|---|---|---|---|---|
| Type | Method | Accuracy | F1 Score | AUC | Accuracy | F1 Score | AUC | Accuracy | F1 Score | AUC |
| Machine Learning | SVM | 52.95±4.59 | 51.21±2.99 | 53.53±0.61 | 71.97±2.15 | 43.02±2.31 | 49.87±2.11 | 59.83±1.26 | 44.55±1.25 | 63.29±2.68 |
| Random Forest | 51.38±0.65 | 50.78±2.87 | 52.18±4.98 | 72.02±4.63 | 43.21±4.52 | 47.77±2.45 | 58.94±1.83 | 44.34±1.11 | 60.86±4.81 | |
| MLP | 53.82±4.19 | 50.24±1.02 | 54.45±1.06 | 73.26±1.11 | 45.87±4.98 | 49.52±4.69 | 58.23±2.11 | 48.63±1.52 | 60.56±4.76 | |
| Graph Learning | GIN | 62.43±2.90 | 60.67±2.91 | 62.44±2.10 | 76.37±3.69 | 54.42±2.55 | 63.47±4.21 | 64.80±3.99 | 51.72±1.55 | 69.46±2.32 |
| GAT | 61.76±4.96 | 60.47±4.86 | 62.82±2.12 | 79.85±1.57 | 52.01±4.93 | 64.09±3.30 | 65.02±2.58 | 53.26±4.09 | 67.22±2.54 | |
| Graphormer | 63.56±3.93 | 60.51±2.89 | 64.94±2.32 | 78.53±4.55 | 56.28±2.19 | 62.23±3.22 | 64.39±4.66 | 55.05±1.66 | 70.93±1.27 | |
| Functional Connectivity | BrainGB | 67.34±1.31 | 66.17±4.50 | 69.40±2.37 | 78.73±0.62 | 58.04±2.13 | 64.65±1.39 | 70.00±1.60 | 58.99±1.32 | 77.13±3.98 |
| KDGCN | 71.15±0.90 | 70.22±2.25 | 73.46±4.44 | 79.42±2.25 | 57.66±2.84 | 62.69±2.64 | 72.34±2.14 | 62.46±0.64 | 78.51±4.21 | |
| Models ALTER | 72.94±4.86 | 71.26±0.90 | 74.86±1.97 | 78.73±0.62 | 58.04±2.13 | 64.65±1.39 | 71.08±4.41 | 63.57±4.58 | 75.42±3.62 | |
| CAGT | 72.62±3.11 | 70.44±3.53 | 73.35±4.62 | 80.25±2.24 | 59.15±2.17 | 63.92±2.96 | 73.75±4.65 | 63.26±4.68 | 77.82±3.99 | |
| BioBGT | 71.06±4.47 | 70.54±1.12 | 74.17±2.45 | 81.44±2.16 | 57.17±0.59 | 60.62±1.70 | 73.21±2.88 | 63.37±0.81 | 78.35±2.78 | |
| Causal Connectivity | CaLLTiF | 72.33±4.94 | 71.60±3.01 | 74.19±1.63 | 82.43±2.22 | 57.07±4.61 | 63.68±4.28 | 76.30±3.47 | 63.71±2.28 | 77.44±4.06 |
| Models BrainGB w/ GC | 71.18±4.03 | 70.55±2.09 | 74.81±3.46 | 83.29±2.34 | 64.25±3.76 | 64.22±2.30 | 79.07±4.05 | 64.11±2.38 | 79.95±4.20 | |
| STDCDAE | 73.08±1.44 | 70.88±3.14 | 74.03±3.26 | 85.97±3.28 | 63.08±3.61 | 64.67±4.67 | 76.14±2.11 | 65.58±1.16 | 80.87±0.90 | |
| Ours | BrainGCT | 75.13±4.15 | 72.55±4.72 | 75.81±1.38 | 84.46±2.24 | 64.92±2.39 | 67.56±3.47 | 81.62±1.57 | 67.46±3.21 | 80.94±1.59 |
4.4 Comparison with Baseline Methods
We compare BrainCGT with conventional ML, generic graph learning, functional connectivity, and causal connectivity baselines in Table 2. Against handcrafted pipelines, BrainCGT improves Accuracy, F1, and AUC by 11.20-21.79 points across ADNI, PPMI, and ABIDE. Against GIN, GAT, and Graphormer, gains reach 4.61-16.60 in Accuracy, 8.64-12.41 in F1, and 3.47-10.87 in AUC. Relative to correlation-based models, BrainCGT improves by 2.19-7.87 Accuracy points and 0.95-2.91 AUC points across cohorts. BrainCGT preserves edge asymmetry and disentangles intra-module and inter-module effects during attention-based encoding. These margins indicate that directed edges and module-aware attention capture cross-network dependencies that correlationbased connectivity can obscure. Compared with causal baselines, BrainCGT usually leads in F1 and AUC, although STDCDAE leads Accuracy on PPMI by 1.51. Overall, hierarchical causal gating and adaptive fusion in BrainCGT yield robust separability under imbalance and site variability without sacrificing calibration.
4.5 Ablation Study
We perform single-factor ablations to measure the contribution of each BrainCGT component to diagnostic accuracy. Table 3 summarizes all results. Each variant removes one component: fMRI preprocessing, modular parcellation (Yeo-7), causal connectivity, direction-aware embeddings, causal selfattention, or causal cross-attention. All other stages remain unchanged. For fairness across configurations, we recompute graphs and retrain every model from scratch with identical data splits, hyperparameters and random seeds. Removing fMRI preprocessing produces the largest accuracy drops on ADNI -14.0%, PPMI -10.7% and ABIDE -10.4%. This confirms the central role of signal conditioning for stable effective connectivity estimation. Removing causal connectivity and causal self-attention also reduces accuracy, with maximum drops of -9.5% and -8.0%. These reductions indicate the importance of directed interactions and direction-specific gating. Removing modular parcellation or causal cross-attention yields moderate degradation and reflects weaker structural priors and limited inter-module integration. Direction-aware embeddings produce smaller but consistent losses. Overall, causal constraints and signal-level preprocessing dominate BrainCGT performance.
| Ablation | ADNI | PPMI | ABIDE |
|---|---|---|---|
| Full model | 75.13±4.15 | 84.46±2.24 | 81.62±1.57 |
| w/o preprocessing | 64.63±5.02 | 75.46±2.87 | 73.12±1.96 |
| w/o modular parcell. | 70.13±3.66 | 80.46±2.61 | 75.62±1.71 |
| w/o causal connect. | 68.13±3.94 | 76.46±2.95 | 75.62±1.78 |
| w/o dir-aware emb. | 71.63±3.25 | 81.46±2.42 | 78.62±1.63 |
| w/o causal self-attn. | 69.13±3.58 | 78.96±2.73 | 76.62±1.74 |
| w/o causal cross-attn. | 70.63±3.41 | 80.46±2.58 | 77.12±1.68 |
4.6 Parameter Analysis
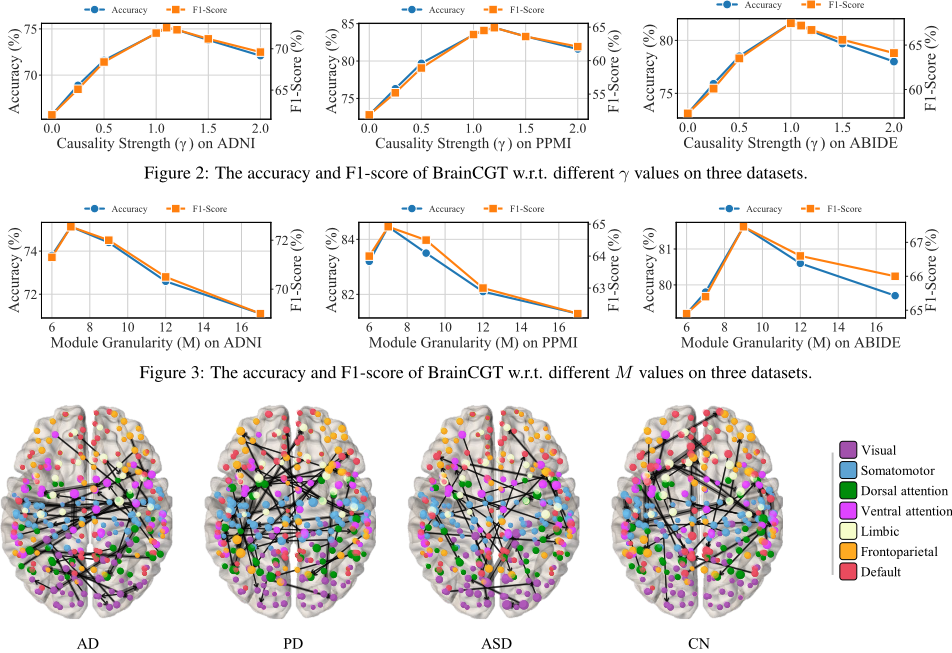
We analyze BrainCGT sensitivity to causal prior strength and modular granularity through the gate scaling factor γ and the number of functional modules M. We sweep γ in {0.00, 0.25, 0.50, 1.00, 1.10, 1.20, 1.50, 2.00} and M in {6, 7, 9, 12, 17} while holding all other settings fixed. Models are trained on ADNI, PPMI, and ABIDE using identical cross-validation folds, and performance is evaluated using held-out accuracy and F1-score. As shown in Figure 2, performance exhibits a concave dependence on γ with optima near γ ≈ 1, specifically (1.1, 1.2, 1.0) for ADNI, PPMI, and ABIDE. Eliminating causal bias at γ = 0 causes large accuracy drops of 12.6%, 13.8%, and 10.4%, with corresponding F1-score reductions up to 20.0%. Over-injection at γ = 2.0 also degrades performance. In Figure 3, varying M yields a U-shaped response with dataset-specific optima (7,7,9). Both under-segmentation and over-segmentation reduce accuracy, confirming the need for balanced mesoscale organization. This behavior is consistent across datasets and indicates stable hyperparameter sensitivity.
4.7 Interpretability Analysis
We evaluate BrainCGT interpretability on ADNI PPMI and ABIDE to assess whether diagnostic decisions rely on biologically grounded directed connectivity [Li et al., 2021]. We adapt GNNExplainer to the directed modular graphs used by BrainCGT and optimize a continuous adjacency mask that balances fidelity and sparsity [Lundberg and Lee, 2017]. Masks are aggregated across nodes and modules and projected to the anatomical parcellation to produce cohort-level causal maps shown in Figure 4. AD maps reveal reduced hippocampal and posterior cingulate outflow and weaker posterior to anterior DMN drive together with increased frontal influence, reflecting medial temporal and posterior DMN degeneration and compensatory executive recruitment [Dai et al., 2019]. PD maps show reduced basal ganglia to motor cortex signaling with elevated thalamic and prefrontal drive, consistent with breakdown of dopaminergic motor loops and increased reliance on top down control [Delgado-Alvarado et al., 2023]. ASD maps show stronger sensory to association signaling and weaker prefrontal regulation along with reduced medial prefrontal temporoparietal and amygdalar interactions. These directed alterations support mechanistic interpretation beyond undirected FC and highlight disorder-specific disruptions in bottom up and top down signaling [Hao et al., 2024; Xu et al., 2026].
5 Conclusion
This paper addresses limitations of neurological disorder diagnosis models based on undirected FC. We propose BrainCGT, a graph transformer that infers modular effective connectivity and integrates it end to end. Direction-aware embeddings and direction-biased attention capture asymmetric causal information flow associated with neuropathological alterations. Evaluation on ADNI, PPMI, and ABIDE shows superior diagnostic accuracy over state-of-the-art FC-based methods. Future work will extend BrainCGT to dynamic and multiscale effective connectivity. Overall, modeling modular effective connectivity yields a more robust and mechanistically informative biomarker than undirected approaches.
Acknowledgments
This work is supported by the National Natural Science Foundation of China (NSFC) under Grant Nos. 62576073, 62376051, and 62576075.
@inproceedings{ijcai2026p724,
  title     = {BrainCGT: A Brain Graph Transformer for Modeling Causal Connectivity in Neurological Disorder Diagnosis},
  author    = {Shehzad, Ahsan and Zhang, Dongyu and Abid, Shagufta and Yu, Shuo and Zheng, Xin and Lin, Hongfei and Xia, Feng},
  booktitle = {Proceedings of the Thirty-Fifth International Joint Conference on
               Artificial Intelligence, {IJCAI-26}},
  publisher = {International Joint Conferences on Artificial Intelligence Organization},
  editor    = {Diego Calvanese},
  pages     = {6509--6517},
  year      = {2026},
  month     = {8},
  note      = {AI4Tech: AI Enabling Technologies},
  doi       = {10.24963/ijcai.2026/724},
  url       = {https://doi.org/10.24963/ijcai.2026/724},
}
TY - CPAPER TI - BrainCGT: A Brain Graph Transformer for Modeling Causal Connectivity in Neurological Disorder Diagnosis AU - Shehzad, Ahsan AU - Zhang, Dongyu AU - Abid, Shagufta AU - Yu, Shuo AU - Zheng, Xin AU - Lin, Hongfei AU - Xia, Feng T2 - Proceedings of the Thirty-Fifth International Joint Conference on Artificial Intelligence, IJCAI-26 PB - International Joint Conferences on Artificial Intelligence Organization PY - 2026 SP - 6509 EP - 6517 DO - 10.24963/ijcai.2026/724 UR - https://doi.org/10.24963/ijcai.2026/724 ER -Copied
Machine-readable versions of this paper, for tools and AI agents:





