
Community-Aware Graph Transformer for Brain Disorder Identification
Proceedings of the Thirty-Fourth International Joint Conference on Artificial Intelligence. Main Track. Pages 4191-4199.
https://doi.org/10.24963/ijcai.2025/467
Keywords
- Humans and AI: HAI: Brain sciences
- Humans and AI: HAI: Cognitive modeling
Abstract
Abnormal brain functional network is an effective biomarker for brain disease diagnosis. Most existing methods focus on mining discriminative information from whole-brain connectivity patterns. However, multi-level collaboration is the foundation of efficient brain function, in addition to the whole-brain network, there are multiple sub-networks that can quickly integrate and process specific cognitive functions, forming the modular community structure of the brain. To address this gap, we propose a novel method, community-aware graph Transformer (CAGT), that integrates the community information of sub-networks and the topological information of brain graph into the Transformer architecture for better brain disorder identification. CAGT enhances information exchange within and between functional communities through dual-scale feature fusion, capturing interactive information across various scales. Additionally, it incorporates prior knowledge to design brain region position encoding and guide the self-attention, thereby enhancing the spatial awareness of the Transformer and aligning it with the brain's natural information transfer process. Experimental results indicate that our proposed method significantly improves performance on both large and small datasets, and can reliably capture the interactions between sub-networks, demonstrating its generalization and interpretability.
- [Badea et al., 2017] Liviu Badea, Mihaela Onu, Tao Wu, Adina Roceanu, and Ovidiu Bajenaru. Exploring the reproducibility of functional connectivity alterations in parkinson's disease. PLoS One, 12(11):e0188196, 2017.
- [Bannadabhavi et al., 2023] Anushree Bannadabhavi, Soo- jin Lee, Wenlong Deng, Rex Ying, and Xiaoxiao Li. Community-aware transformer for autism prediction in fmri connectome. In International Conference on Med- ical Image Computing and Computer-Assisted Interven- tion, pages 287-297. Springer, 2023.
- [Bassett and Bullmore, 2017] Danielle S Bassett and Ed- ward T Bullmore. Small-world brain networks revisited. The Neuroscientist, 23(5):499-516, 2017.
- [Betzel and Bassett, 2017] Richard F Betzel and Danielle S Bassett. Multi-scale brain networks. Neuroimage, 160:73- 83, 2017.
- [Cai et al., 2023] Hongjie Cai, Yue Gao, and Manhua Liu. Graph transformer geometric learning of brain networks using multimodal mr images for brain age estimation. IEEE Transactions on Medical Imaging, 42(2):456-466, 2023.
- [Craddock et al., 2012] R Cameron Craddock, G Andrew James, Paul E Holtzheimer III, Xiaoping P Hu, and He- len S Mayberg. A whole brain fmri atlas generated via spa- tially constrained spectral clustering. Human brain map- ping, 33(8):1914-1928, 2012.
- [Craddock et al., 2013] Cameron Craddock, Yassine Ben- hajali, Carlton Chu, Francois Chouinard, Alan Evans, András Jakab, Budhachandra Singh Khundrakpam, John David Lewis, Qingyang Li, Michael Milham, et al. The neuro bureau preprocessing initiative: open sharing of preprocessed neuroimaging data and derivatives. Frontiers in Neuroinformatics, 7(27):5, 2013.
- [Cui et al., 2022] Hejie Cui, Wei Dai, Yanqiao Zhu, Xiaox- iao Li, Lifang He, and Carl Yang. Interpretable graph neu- ral networks for connectome-based brain disorder analy- sis. In International Conference on Medical Image Com- puting and Computer-Assisted Intervention, pages 375- 385. Springer, 2022.
- [Cui et al., 2023] Hejie Cui, Wei Dai, Yanqiao Zhu, Xuan Kan, Antonio Aodong Chen Gu, Joshua Lukemire, Liang Zhan, Lifang He, Ying Guo, and Carl Yang. Braingb: A benchmark for brain network analysis with graph neu- ral networks. IEEE Transactions on Medical Imaging, 42(2):493-506, 2023.
- [Dwivedi et al., 2021] Vijay Prakash Dwivedi, Anh Tuan Luu, Thomas Laurent, Yoshua Bengio, and Xavier Bres- son. Graph neural networks with learnable struc- tural and positional representations. arXiv preprint arXiv:2110.07875, 2021.
- [Fusar-Poli et al., 2022] Laura Fusar-Poli, Natascia Brondino, Pierluigi Politi, and Eugenio Aguglia. Missed diagnoses and misdiagnoses of adults with autism spec- trum disorder. European archives of psychiatry and clinical neuroscience, 272(2):187-198, 2022.
- [Hu et al., 2019] Weihua Hu, Bowen Liu, Joseph Gomes, Marinka Zitnik, Percy Liang, Vijay Pande, and Jure Leskovec. Strategies for pre-training graph neural net- works. arXiv preprint arXiv:1905.12265, 2019.
- [Kan et al., 2022] Xuan Kan, Wei Dai, Hejie Cui, Zilong Zhang, Ying Guo, and Carl Yang. Brain network trans- former. Advances in Neural Information Processing Sys- tems, 35:25586-25599, 2022.
- [Kong et al., 2024] Youyong Kong, Xiaotong Zhang, Wen- han Wang, Yue Zhou, Yueying Li, and Yonggui Yuan. Multi-scale spatial-temporal attention networks for func- tional connectome classification. IEEE Transactions on Medical Imaging, pages 1-1, 2024.
- [Lawrence et al., 2021] Ross M Lawrence, Eric W Bridge- ford, Patrick E Myers, Ganesh C Arvapalli, Sandhya C Ramachandran, Derek A Pisner, Paige F Frank, Alli- son D Lemmer, Aki Nikolaidis, and Joshua T Vogelstein. Standardizing human brain parcellations. Scientific data, 8(1):78, 2021.
- [Li et al., 2021a] Xiaoxiao Li, Yuan Zhou, Nicha Dvornek, Muhan Zhang, Siyuan Gao, Juntang Zhuang, Dustin Scheinost, Lawrence H Staib, Pamela Ventola, and James S Duncan. Braingnn: Interpretable brain graph neu- ral network for fmri analysis. Medical Image Analysis, 74:102233, 2021.
- [Li et al., 2021b] Yang Li, Jingyu Liu, Yiqiao Jiang, Yu Liu, and Baiying Lei. Virtual adversarial training-based deep feature aggregation network from dynamic effective con- nectivity for mci identification. IEEE transactions on med- ical imaging, 41(1):237-251, 2021.
- [Liu et al., 2024a] Jinduo Liu, Feipeng Wang, and Junzhong Ji. Concept-level causal explanation method for brain function network classification. In Proceedings of the Thirty-Third International Joint Conference on Artificial Intelligence, IJCAI-24, pages 3087-3096, 8 2024. IJCAI
- [Liu et al., 2024b] Mengjun Liu, Huifeng Zhang, Mianxin Liu, Dongdong Chen, Zixu Zhuang, Xin Wang, Lichi Zhang, Daihui Peng, and Qian Wang. Randomizing hu- man brain function representation for brain disease diag- nosis. IEEE Transactions on Medical Imaging, 2024.
- [Lord et al., 2020] Catherine Lord, Traolach S Brugha, Tony Charman, James Cusack, Guillaume Dumas, Thomas Fra- zier, Emily JH Jones, Rebecca M Jones, Andrew Pickles, Matthew W State, et al. Autism spectrum disorder. Nature reviews Disease primers, 6(1):1-23, 2020.
- [Luo et al., 2024] Xuexiong Luo, Jia Wu, Jian Yang, Shan Xue, Amin Beheshti, Quan Z. Sheng, David McAlpine, Paul Sowman, Alexis Giral, and Philip S. Yu. Graph neural networks for brain graph learning: A survey. In Proceedings of the Thirty-Third International Joint Con- ference on Artificial Intelligence, IJCAI-24, pages 8170- 8178, 8 2024. IJCAI
- [Marco et al., 2011] Elysa J Marco, Leighton BN Hinkley, Susanna S Hill, and Srikantan S Nagarajan. Sensory pro- cessing in autism: a review of neurophysiologic findings. Pediatric research, 69(8):48-54, 2011.
- [Marx et al., 2023] Wolfgang Marx, Brenda WJH Penninx, Marco Solmi, Toshi A Furukawa, Joseph Firth, Andre F Carvalho, and Michael Berk. Major depressive disorder. Nature Reviews Disease Primers, 9(1):44, 2023.
- [Mostofsky and Ewen, 2011] Stewart H Mostofsky and Joshua B Ewen. Altered connectivity and action model formation in autism is autism. The Neuroscientist, 17(4):437-448, 2011.
- [Padmanabhan et al., 2017] Aarthi Padmanabhan, Charles J Lynch, Marie Schaer, and Vinod Menon. The default mode network in autism. Biological Psychiatry: Cognitive Neu- roscience and Neuroimaging, 2(6):476-486, 2017.
- [Peng et al., 2024] Zhihao Peng, Zhibin He, Yu Jiang, Pengyu Wang, and Yixuan Yuan. Gbt: Geometric-oriented brain transformer for autism diagnosis. In International Conference on Medical Image Computing and Computer- Assisted Intervention, pages 142-152. Springer, 2024.
- [Plitt et al., 2015] Mark Plitt, Kelly Anne Barnes, and Alex Martin. Functional connectivity classification of autism identifies highly predictive brain features but falls short of biomarker standards. NeuroImage: Clinical, 7:359-366, 2015.
- [Qu et al., 2024] Gang Qu, Anton Orlichenko, Junqi Wang, Gemeng Zhang, Li Xiao, Kun Zhang, Tony W. Wilson, Ju- lia M. Stephen, Vince D. Calhoun, and Yu-Ping Wang. In- terpretable cognitive ability prediction: A comprehensive gated graph transformer framework for analyzing func- tional brain networks. IEEE Transactions on Medical Imaging, 43(4):1568-1578, 2024.
- [Rampášek et al., 2022] Ladislav Rampášek, Michael Galkin, Vijay Prakash Dwivedi, Anh Tuan Luu, Guy Wolf, and Dominique Beaini. Recipe for a general, powerful, scalable graph transformer. Advances in Neural Information Processing Systems, 35:14501-14515, 2022.
- [Sapey-Triomphe et al., 2023] Laurie-Anne Sapey- Triomphe, Lauren Pattyn, Veith Weilnhammer, Philipp Sterzer, and Johan Wagemans. Neural correlates of hierarchical predictive processes in autistic adults. Nature Communications, 14(1):3640, 2023.
- [Sporns and Betzel, 2016] Olaf Sporns and Richard F Bet- zel. Modular brain networks. Annual review of psychology, 67(1):613-640, 2016.
- [Sussman et al., 2015] D Sussman, RC Leung, VM Vogan, W Lee, S Trelle, S Lin, DB Cassel, MM Chakravarty, JP Lerch, E Anagnostou, et al. The autism puzzle: Diffuse but not pervasive neuroanatomical abnormalities in chil- dren with asd. NeuroImage: Clinical, 8:170-179, 2015.
- [Van Den Heuvel and Pol, 2010] Martijn P Van Den Heuvel and Hilleke E Hulshoff Pol. Exploring the brain network: a review on resting-state fmri functional connectivity. Eu- ropean neuropsychopharmacology, 20(8):519-534, 2010.
- [Xu et al., 2024] Jiaxing Xu, Kai He, Mengcheng Lan, Qingtian Bian, Wei Li, Tieying Li, Yiping Ke, and Miao Qiao. Contrasformer: A brain network contrastive trans- former for neurodegenerative condition identification. In Proceedings of the 33rd ACM International Conference on Information and Knowledge Management, pages 2671- 2681, 2024.
- [Yan et al., 2016] Chao-Gan Yan, Xin-Di Wang, Xi-Nian Zuo, and Yu-Feng Zang. Dpabi: data processing & anal- ysis for (resting-state) brain imaging. Neuroinformatics, 14:339-351, 2016.
- [Yan et al., 2019] Chao-Gan Yan, Xiao Chen, Le Li, Fran- cisco Xavier Castellanos, Tong-Jian Bai, Qi-Jing Bo, Jun Cao, Guan-Mao Chen, Ning-Xuan Chen, Wei Chen, et al. Reduced default mode network functional connec- tivity in patients with recurrent major depressive disor- der. Proceedings of the National Academy of Sciences, 116(18):9078-9083, 2019.
- [Yeo et al., 2011] BT Thomas Yeo, Fenna M Krienen, Jorge Sepulcre, Mert R Sabuncu, Danial Lashkari, Marisa Hollinshead, Joshua L Roffman, Jordan W Smoller, Lilla Zöllei, Jonathan R Polimeni, et al. The organization of the human cerebral cortex estimated by intrinsic functional connectivity. Journal of neurophysiology, 2011.
- [Yu et al., 2024] Shuo Yu, Shan Jin, Ming Li, Tabinda Sar- war, and Feng Xia. Long-range brain graph transformer. In The Thirty-eighth Annual Conference on Neural Infor- mation Processing Systems, 2024.
- [Zhang et al., 2023] Pengshuai Zhang, Guangqi Wen, Peng Cao, Jinzhu Yang, Jinyu Zhang, Xizhe Zhang, Xinrong Zhu, Osmar R Zaiane, and Fei Wang. Brainusl: U nsu- pervised graph s tructure l earning for functional brain network analysis. In International Conference on Med- ical Image Computing and Computer-Assisted Interven- tion, pages 205-214. Springer, 2023.
- [Zheng et al., 2024] Kaizhong Zheng, Shujian Yu, Baojuan Li, Robert Jenssen, and Badong Chen. Brainib: Inter- pretable brain network-based psychiatric diagnosis with graph information bottleneck. IEEE Transactions on Neu- ral Networks and Learning Systems, pages 1-14, 2024.
- [Zhu et al., 2022] Qi Zhu, Jing Yang, Shuihua Wang, Dao- qiang Zhang, and Zheng Zhang. Multi-modal non- euclidean brain network analysis with community detec- tion and convolutional autoencoder. IEEE Transactions on Emerging Topics in Computational Intelligence, 7(2):436- 446, 2022.
References were extracted automatically from the PDF and may contain errors.
Full text extracted automatically from the PDF; figures, tables and equations may differ. The PDF is the version of record.
1 Introduction
Neurological disorders, including autism spectrum disorder (ASD), Parkinson's disease (PD), and major depressive disorder (MDD), impact the quality of life for hundreds of millions of people worldwide [Marx et al., 2023; Lord et al., 2020]. These diseases typically involve complex neurobehavioral manifestations and neurobiological mechanisms, making accurate diagnosis a significant challenge [Li et al., 2021b]. Traditional diagnostic methods primarily rely on behavioral assessments and clinical observations, which are subjective and prone to misdiagnosis [Fusar-Poli et al., 2022]. In recent years, resting-state functional magnetic resonance imaging (rs-fMRI) has demonstrated tremendous research and diagnostic potential, it can reveal functional connections among brain regions of interest (ROIs) by assessing changes in blood oxygenation level dependent (BOLD) signals [Luo et al., 2024; Liu et al., 2024a]. By analyzing rs-fMRI data, researchers can identify abnormal patterns in brain functional network, which are crucial for early diagnosis and formulation of treatment strategies [Kong et al., 2024].
∗Corresponding author
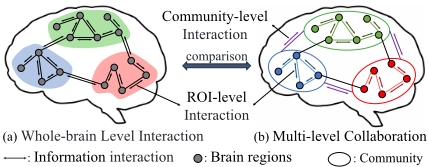
Besides the whole-brain functional network, brain function depends on collaborative interactions among various regions that are organized into distinct functional communities, namely sub-networks. Within each community, the regions are tightly interconnected and work together to perform specific cognitive and physiological tasks [Van Den Heuvel and Pol, 2010]. For example, the default mode network (DMN) is associated with self-reflection and internal thought, and the dorsal attention network (DAN) is critical for attention regulation. However, traditional deep learning methods for brain network analysis often fail to incorporate these community-specific associations. As illustrated in Figure 1, traditional methods rely on the brain region-level interaction model, which mainly focus on modeling direct interactions between pairs of ROIs, overlooking the intricate relationships between functional communities. In contrast, a more natural and biologically reasonable model is multi-level collaboration that not only considers information transmission at the ROI-level but also accounts for information interaction at the community-level, facilitating functional activities through intra- and inter-community interactions [Sporns and Betzel,
2016]. To address this issue, we propose to effectively aggregate information within and between communities, integrating ROI-level and community-level interactions. This approach captures the functional representation of brain regions by encompassing interactive information across local and global scales, extracting richer spatial representation, and improving model performance.
To further enhance the representation of complex brain graph data, recent studies suggest utilizing Graph Transformer, which provide a more flexible mechanism for capturing long-range dependencies compared to traditional graph neural network (GNN) [Kong et al., 2024; Yu et al., 2024]. However, existing approaches still face limitations. Previous Transformer-based studies often treat brain region nodes as sequentially arranged nodes without appropriate positional encoding, hindering the model's ability to accurately perceive the spatial structure of the brain network. Additionally, existing methods utilize the shortest path or adjacency matrix to help the attention mechanism capture structural information in graphs. However, they fail to fully exploit the available spatial structural prior knowledge, such as spatial distance and community information, despite extensive evidence demonstrating their significant impact on brain information transfer processes [Sporns and Betzel, 2016; Bassett and Bullmore, 2017]. To address these issues, we incorporate prior knowledge to optimize the Transformer architecture. Specifically, we design a novel positional encoding suitable for brain networks by combining Montreal Neurological Institute (MNI) coordinates with graph random walk strategies, effectively enhancing the model's spatial awareness. Furthermore, by integrating spatial distance and community structure information, the attention mechanism aligns more closely with the natural information transfer processes of the brain. This approach not only enhances the model's performance but also improves its biological interpretability.
In summary, we propose the community-aware graph Transformer (CAGT) method that effectively leverages prior knowledge of brain network to provide a novel deep learning architecture for neurological disease diagnosis. The main contributions are as follows.
- We design a dual-scale spatial feature fusion module that utilizes community structure to extract richer spatial representations from local to global scales.
- We design a prior guided graph Transformer that utilizes prior knowledge of community structure and topological information to construct positional encodings and attention weights, enhancing the spatial awareness of Transformer
- We identify key biomarkers for disease diagnosis, including connections between functional communities, this indicates that our method enhances diagnostic performance while preserving interpretability.
2 RelatedWork
2.1 Local Information ProcessingMethods
The local information processing methods aggregate information through neighboring brain regions, in which GNN is a typical representative. Cui et al. proposed the brain graph neural network benchmark (BrainGB), which supports the combination of different node characteristics, message passing mechanisms, and pooling strategies, it is to standardize the brain network analysis process and provide a modular implementation framework [Cui et al., 2023]. Zhang et al. proposed BrainUSL, an unsupervised graph structure learning method that leverages graph generation, topology-aware encoding, and multi-view contrastive regularization to automatically learn discriminative network structures [Zhang et al., 2023]. Cui et al. proposed IBGNN, an interpretable framework that integrates an edge weight-aware message passing mechanism and learns a globally shared edge mask to identify brain regions and key connections associated with specific diseases [Cui et al., 2022]. Zheng et al. leverage the information bottleneck principle to construct disease-relevant subgraphs and evaluate their effectiveness of information retention by computing mutual information, improving diagnostic accuracy for psychiatric disorders and providing interpretable biomarkers [Zheng et al., 2024]. However, these methods overlook critical community information in the brain and do not break through the inherent limitations of GNN models. Because GNN is a local information processing method, due to its limited receptive field, long-range interaction between ROIs is achieved through increasing the number of layers, but multiple layers can lead to over smoothing.
2.2 Global Information ProcessingMethods
The global information processing methods can directly analyze the information interaction between any two brain regions, in which Transformer is a typical representative. Transformer uses self-attention mechanism to obtain global dependencies, enabling modeling of complex long-range interactions. Recent studies focus on improving the attention mechanism to better capture the intricate relationships in brain networks. For instances, Peng et al. enhanced feature discriminability by removing smaller singular value components from the attention matrix and applying geometric constraints, effectively learning discriminative graph representations of ROIs [Peng et al., 2024]. Cai et al. aimed to predict functional connections from structural connections, refining the attention mechanism to better model the relationship between brain structure and function [Cai et al., 2023]. Similarly, Kong et al. utilized graph topological information to guide the attention mechanism and extracted rich spatiotemporal information at multiple scales of brain networks [Kong et al., 2024]. However, these methods lack suitable positional encodings, which are proven to effectively enhance the spatial perception capabilities of Transformer in brain network analysis. To address this issue, Qu et al. introduced the gated graph Transformer (GGT), designing learnable structural positional encodings to optimize the learning of graph structural information, thereby enhancing cognitive ability prediction. [Qu et al., 2024]. Yu et al. designed a positional encoding based on random walk strategies, allowing the model to better understand long-range dependencies in brain networks [Yu et al., 2024]. However, these methods still do not incorporate community and spatial prior knowledge, which limits their effectiveness in enhancing the model's understanding of spatial relationships and information transmission mechanisms among ROIs.
3 Method
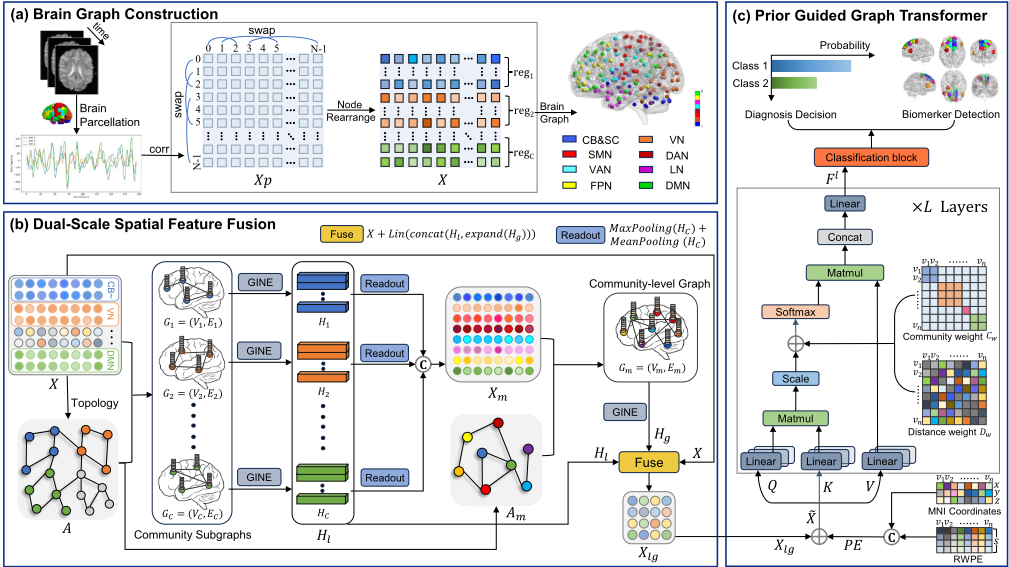
The overall framework of the proposed CAGT is presented in Figure 2. Firstly, the brain graph of each subject is constructed and partitioned into multiple community subgraphs. Then, a dual-scale spatial feature fusion module is designed to obtain representations of brain regions, which contain information exchange within and between community subgraphs. Finally, a prior guided graph Transformer is designed to realize brain disorder identification based on global information processing approach, in particular, the positional encoding is generated using a random walk strategy combined with MNI coordinates, the attention weights incorporate spatial distances and community structure information.
3.1 Brain Graph Construction
The brain is divided into N ROIs with a brain atlas, then the fMRI data of each subject can be represented as a matrix with the dimension of N × T , where N is the number of ROIs and T is the number of time points. By computing the Pearson correlation between each pair of ROIs, a symmetric functional connectivity (FC) matrix Xp ∈ RN×N is obtained, each row is the feature vector corresponding to a specific ROI. Xp records the whole-brain connectivity network of ROIs.
To detect the community structure in the brain network, we adopt the approach described in [Zhu et al., 2022] to rearrange the rows and columns of Xp. As shown in Figure 2 (a), the N ROIs are grouped into the C community modules, and the ROIs belonging to the same community are arranged together. This produces a rearranged FC matrix X ∈ RN×N and a community index Cidx that records the starting positions of each community module in the matrix. This rearrangement only changes the order of ROIs in the FC matrix, preserving the original connectivity information for each ROI. By retaining the top-k strongest functional connections for each ROI, we refine X to construct the topology of brain graph. This sparsification process extracts the most significant functional connections and eliminates redundant information.
As a result, we construct a brain graph G(V,E), where the adjacency matrix is denoted as A ∈ RN×N , and the node features are represented by X ∈ RN×N . This brain graph can be partitioned into C community subgraphs using the community index Cidx. For the c-th community subgraph Gc(Vc,Ec), the adjacency matrix Ac and the node features Xc are defined as follows:
where Ac ∈ RNc×Nc , Xc ∈ RNc×N , Nc is the number of nodes in the c-th community. The total number of nodes in all communities satisfies the equation N = N1 +N2 +N3 + · · · + NC. By partitioning the brain graph into C community subgraphs, it can facilitate the extraction of both intracommunity and inter-community aggregate information for further analysis.
3.2 Dual-Scale Spatial Feature Fusion
To capture information exchange within and between communities under the multi-level collaboration model, we extract features at both the node scale and the community scale, and further integrate these two levels to achieve a comprehensive local-to-global spatial representation of the brain network.
Local Information Extraction Within Communities
For each community subgraph, we employ the Graph Isomorphism Network with Edge Features (GINE) [Hu et al., 2019] to aggregate local information. The message-passing process is defined as:
where MLP(·) represents a multi-layer perceptron, ϵ is a learnable parameter, N(v) denotes the set of neighbors of node v, and eu,v is the edge feature between nodes u and v. Therefore, the community-internal information is updated
where Xc ∈ RNc×d and Hc ∈ RNc×d represent the initial and updated node feature within the community, respectively, and Ac is the adjacency matrix of the community subgraphs. Using convolution operations on each subgraph, it can effectively capture the features and relationships of ROIs within the community. The local feature maps are then concatenated as:
This process better reflects the functional connectivity among ROIs within each community.
Global Information Extraction Among Communities
To further extract global information, we perform a pooling operation on the internal features Hc of each community to obtain the community representation, the global feature map based on communities is obtained by concatenating them:
where P(·) denotes a combination of average pooling and max pooling, retaining essential features while smoothing the feature map. Next, we construct a connectivity matrix M ∈ RC×C based on the number of edges between communities, the element M(i, j) represents the number of functional connections between the i-th and j-th communities, and it is calculated as follows:
where Vi and Vj denote the node sets of the i-th and j-th communities, respectively. By normalizingM, we obtain the adjacency matrix of the global community graph:
This results in a community-level graph Gm(Vm,Em), where each node represents a community, and the edge weights reflect the strength of the functional connections between communities. Stronger connections correspond to larger edge weights. On the community-level graph, we also employ GINE to aggregate inter-community information, effectively capturing features and relationships between com-
Fusion of Local-to-Global Information
Inspired by the concept of residual connections, we integrate the local and global information with original feature X to obtain the final brain region feature map:
where the lin(·) represents a linear layer and operation expand(·) replicates Hg back to the pre-pooling dimensions based on the community indices:
and repeat(·) denotes a matrix replication operation.
3.3 Positional Encoding for Brain Networks
For non-Euclidean brain graph data, traditional sinusoidal positional encodings cannot effectively express the spatial relationships among ROIs. To better adapt to the unique characteristics of brain functional networks, we combine Random Walk Positional Encoding (RWPE) [Dwivedi et al., 2021] with MNI coordinates to create a unique positional encoding specifically tailored for brain functional networks. It can capture the centrality and importance of brain region nodes and their intricate spatial and topological relationships, significantly enhancing the Transformer's spatial awareness capabilities. Specifically, RWPE utilizes a random walk diffusion strategy. The probability of node i returning to itself after S steps of random walks is calculated as:
where D is the degree matrix, and A is the adjacency matrix of the graph. Based on this probability, the positional encoding after S steps of random walks is computed as:
It reflects the degree centrality of ROIs and global structure information of the brain graph.
The MNI coordinates directly provide the threedimensional spatial location of ROIs. By incorporating these coordinates into the positional encoding, the model is better to comprehend the relative positions of ROIs in threedimensional space. Specifically, suppose the coordinate of the i-th ROI is pi = [xi, yi, zi], the brain's spatial coordinate matrix PMNI is:
Then, the final positional encoding can be defined as:
where norm(·) normalizes the MNI coordinates, and ∥ denotes matrix concatenation. The positional encoding is added to the model input as follows:
where lin(·) maps the PE to a d-dimensional space. The final input ˜X ∈ RN×d integrates the local-to-global features Xlg with the positional encoding, allowing the model to capture both spatial and graph structural information.
3.4 Prior-GuidedMulti-head Attention
The attention mechanism in Transformer updates brain region information based on feature similarity between ROIs. However, neuroscience research reveals that brain information transmission is much more complex. It is strongly influenced by spatial distance and community structure, where physically adjacent regions tend to exhibit stronger functional connections and more frequent information exchanges. Moreover, connections within the same brain community are typically tighter, allowing efficient information transmission through functional synergy [Sporns and Betzel, 2016; Betzel and Bassett, 2017; Bassett and Bullmore, 2017]. Building on these findings, we integrate these prior knowledge into the multi-head self-attention mechanism, enabling the model to more accurately simulate brain information transfer process, enhancing interpretability and predictive accuracy.
Spatial Distance Weighting
The distance matrix D is computed using the Euclidean distance between nodes based on their MNI coordinates:
where (xi, yi, zi) and (xj , yj , zj ) denote the MNI coordinates of brain region nodes vi and vj, respectively. Subsequently, the distance weight matrix Dw is derived using a Gaussian kernel function:
where the exponential decay function increase the weight of short-distance connections, and α is a learnable parameter that is initially set to 1.
Community-based Weighting
We further design a community weight matrix that assigns higher weights to information transfer within the same community. For nodes within the same community, we set a learnable weight θc (initialized to 1) to form the community weight matrix Cw, the matrix is defined as follows:
Prior-Guided Attention Weight Matrix
By combining the distance weight matrix Dw and the community weight matrix Cw, we construct a prior-guided attention weight matrix that better reflects the brain's information transmission processes and activity mechanisms:
where F0 = ˜X, ∥ represents the concatenation operator, H is the number of attention heads, l is the layer index, and WlO , Wl,h Q ,Wl,h K ,Wl,h V are learnable model parameters. dl,h is the dimensionality of the query and key projections, σ represents softmax operator and λ1, λ2 are both learnable parameters initialized to 0.2 (via grid search). Ultimately, after L layers of the Transformer framework that integrates community spatial structure information, we can obtain feature map FL ∈ RN×d .
The final readout step involves aggregating global-level node embeddings to obtain an advanced representation of the brain graph. We employ the OCRead layer [Kan et al., 2022] to aggregate the learned node embeddings. The OCRead model begins by mapping the node data to a hidden space using an encoder. Then it computes standard orthogonal clustering centers E ∈ RK×N and employs a soft assignment mechanism to allocate nodes to these centers. The graph-level embedding ZG is calculated using the formula ZG = S · F L, where S ∈ RK×N is the learnable assignment matrix generated by OCRead. This process effectively captures the intricate patterns of brain activity. Finally, the graph-level embedding ZG undergoes dimension reduction and flattening before being fed into a multi-layer perceptron to produce accurate classification predictions. The entire process is optimized using supervised learning with cross-entropy loss.
4 Experiments and Results
4.1 Materials
We extensively evaluate the proposed method on three datasets, namely ABIDE I for autism [Craddock et al., 2013], REST-MDD for major depressive disorder [Yan et al., 2019] and Taowu and Neurocon for Parkinson's disease [Badea et al., 2017], where ABIDE I and REST-meta-MDD are large datasets with thousands of subjects, TaoWu and Neurocon is a relatively small dataset with about a hundred subjects.
ABIDE I is an open-source ASD diseases database comprising data from 17 international sites, available at https: //fcon 1000.projects.nitrc.org/indi/abide. The Preprocessed Connectomes Project (PCP) has preprocessed the fMRI data for each subject, resulting in rs-fMRI data for 1,035 subjects, including 505 ASD patients and 530 normal controls (NC).
REST-MDD is a publicly available MDD diseases database comprising 25 study cohorts, accessible at http:
| Type | Model | ABIDE I | REST-MDD | Taowu & Neurocon | ||||||
|---|---|---|---|---|---|---|---|---|---|---|
| ACC(%) ↑ | SEN(%) ↑ | SPE(%) ↑ | ACC(%) ↑ | SEN(%) ↑ | SPE(%) ↑ | ACC(%) ↑ | SEN(%) ↑ | SPE(%) ↑ | ||
| GNN Based | GINE | 63.04±2.90 | 65.93±8.41 | 64.82±9.81 | 60.97±3.89 | 61.62±7.81 | 63.18±3.89 | 67.82±12.46 | 67.62±10.81 | 69.82±19.46 |
| BrainGNN | 65.12±3.11 | 62.87±13.82 | 65.07±14.51 | 65.79±5.01 | 64.35±9.81 | 34.25±15.21 | 72.08±15.27 | 69.50±18.50 | 74.99±13.57 | |
| IBGNN | 66.28±4.49 | 65.66±13.63 | 66.98±9.40 | 62.10±2.80 | 69.05±10.00 | 54.07±14.21 | 78.06±16.34 | 86.00±24.27 | 62.50±22.97 | |
| BrainUSL | 70.72±4.09 | 71.09±12.98 | 68.94±11.53 | 65.00±1.34 | 71.49±8.41 | 56.59±10.08 | 76.07±14.34 | 83.04±16.25 | 63.50±21.07 | |
| BrainIB | 67.34±2.63 | 70.94±8.36 | 63.57±7.60 | 62.73±2.42 | 68.41±3.71 | 56.16±6.35 | 73.47±18.90 | 81.00±20.22 | 65.00±20.62 | |
| Graph Transformer Based | vanillaTF | 64.20±3.35 | 66.40±6.97 | 62.47±10.06 | 61.73±1.25 | 64.22±3.17 | 52.10±7.35 | 63.47±15.90 | 77.00±15.32 | 57.00±13.21 |
| BrainNetTF | 69.22±3.15 | 68.69±5.68 | 65.13±4.41 | 65.33±2.18 | 67.77±5.89 | 62.54±4.55 | 71.11±15.74 | 85.64±16.37 | 48.50±28.39 | |
| Com-BrainTF | 68.93±4.45 | 69.78±6.99 | 66.11±4.75 | 65.42±2.04 | 67.59±4.14 | 63.21±4.22 | 64.99±20.15 | 76.21±22.14 | 48.50±25.36 | |
| ALTER | 71.29±3.76 | 72.23±6.21 | 66.10±8.09 | 66.93±2.39 | 71.70±4.79 | 61.32±3.77 | 76.33±9.82 | 83.07±15.67 | 59.66±23.28 | |
| GBT | 70.06±4.96 | 73.08±7.73 | 66.86±7.73 | 67.04±2.33 | 70.25±6.27 | 64.88±6.10 | 68.61±20.24 | 84.14±17.89 | 45.16±26.80 | |
| Contrasformer | 67.30±3.83 | 69.66±13.57 | 65.09±17.09 | 63.30±2.91 | 63.95±4.70 | 50.90±3.92 | 70.21±16.04 | 74.14±15.86 | 52.61±23.11 | |
| GraphGPS | 65.30±2.63 | 60.61±6.57 | 64.12±7.32 | 61.09±1.32 | 65.56±2.08 | 53.45±3.62 | 64.17±14.76 | 69.32±12.67 | 59.61±18.22 | |
| Ours | CAGT | 74.01±3.33 | 77.83±8.63 | 69.60±9.55 | 68.23±2.05 | 71.57±6.29 | 64.11±7.81 | 86.52±11.83 | 95.5±9.06 | 74.16±25.67 |
| Datasets | DE | PE | PA | ACC(%) ↑ | AUC(%) ↑ | SEN(%) ↑ | SPE(%) ↑ |
|---|---|---|---|---|---|---|---|
| ABIDE I | ✓ | ✓ | ✓ ✓ | 67.42±2.56 69.37±2.11 71.18±1.26 | 71.32±3.64 73.12±2.81 74.56±1.69 | 73.78±2.14 72.32±4.19 72.68±3.89 76.25±6.33 77.83±8.63 | 60.95±5.67 63.18±6.89 66.14±8.21 67.12±3.32 |
| ✓ | ✓ ✓ | 65.25±3.01 65.77±2.64 | 67.21±3.61 67.25±2.56 | 68.12±2.01 69.24±5.61 | 69.60±9.55 61.23±7.33 60.96±7.32 62.18±4.99 | ||
| ✓ | ✓ | 72.47±3.56 | 75.67±1.81 | ||||
| ✓ | ✓ | ✓ | 74.01±3.33 | 77.80±2.96 | |||
| REST-MDD | 64.21±1.35 | 66.75±6.87 | |||||
| ✓ | 68.42±3.67 | ||||||
| ✓ | ✓ | 67.16±3.89 | 70.62±1.71 | 69.23±4.56 | 63.14±6.78 | ||
| ✓ | ✓ | ✓ | 68.23±2.05 | 71.01±2.66 | 71.57±6.27 | 64.11±7.81 | |
| Taowu & Neurocon | ✓ ✓ | ✓ | 73.44±13.80 | 77.64±16.22 | 82.26±12.63 | 65.62±23.24 | |
| ✓ | 70.45±9.71 | 72.56±13.86 | 85.69±11.89 | 62.45±13.89 | |||
| ✓ | 73.45±10.45 | 76.23±9.87 | 87.64±8.97 | 64.63±15.98 | |||
| ✓ | 83.26±9.89 | 83.10±14.37 | 89.27±10.50 | 73.56±21.63 | |||
| ✓ | ✓ | ✓ | 86.52±11.83 | 84.08±16.82 | 95.50±9.06 | 74.16±25.67 |
//rfmri.org/REST-meta-MDD. The data were preprocessed using the Data Processing Assistant for Resting-State fMRI (DPARSF) toolbox [Yan et al., 2016]. Following the official recommendation to exclude overlapping data from site S4, the refined dataset consists of 2,380 rs-fMRI scans, including 1,276 MDD patients and 1,104 NC.
TaoWu and Neurocon datasets are among the earliest image datasets available for Parkinson's research. We followed the preprocessing steps outlined in [Liu et al., 2024b] using the DPARSF toolbox. The TaoWu dataset ultimately includes 39 subjects, with 20 PD patients and 19 NC. The Neurocon dataset includes 43 subjects, with 27 PD patients and 16 NC.
For each subject, the entire brain is parcellated into 200 regions using the CC200 atlas [Craddock et al., 2012]. These regions are further clustered into eight sub-networks based on the previous research [Yeo et al., 2011; Lawrence et al., 2021], namely Cerebellum and Subcortical Structures (CB & SC), Visual Network (VN), Somatomotor Network (SMN), DAN, Ventral Attention Network (VAN), Limbic Network (LN), Frontoparietal Network (FPN), and DMN.
4.2 Experimental Setting
We evaluate the model's performance using ten-fold crossvalidation. The entire network is trained end-to-end with the Adam optimizer. Key parameters included a batch size of 64, a total of 70 epochs, an initial learning rate of 1 × 10⁻⁴ , and a weight decay of 1 × 10⁻⁶ . The top-k connections for each node are retained as edges, with their values fixed at 30. The RWPE dimension S is set to 30. The Transformer architecture is configured with 2 layers and 8 heads. A dropout rate of 0.2 is applied to the GINE, Transformer, and the final fully connected classification layer. All codes are implemented using the PyTorch and PyG libraries. Experiments are conducted on a Windows server equipped with an Intel® Core™ i7-10700 CPU (2.90 GHz), a GeForce GTX 3080 Ti GPU and 32 GB of RAM. The code is available at https://github.com/null-cks/CAGT.
4.3 Comparison with ExistingMethods
We compare our CAGT model with two types of models: 1) GNN-based models, including GINE [Hu et al., 2019] , BrainGNN [Li et al., 2021a] , IBGNN [Cui et al., 2022] , BrainUSL [Zhang et al., 2023], and BrainIB [Zheng et al., 2024]; 2) Transformer-based models designed for graph data, including vanilla-Transformer (vanillaTF), BrainNetTransformer (BrainNetTF) [Kan et al., 2022], Com-BrainTF [Bannadabhavi et al., 2023], ALTER [Yu et al., 2024], GBT [Peng et al., 2024], Contrasformer [Xu et al., 2024] and GraphGPS [Ramp´aˇsek et al., 2022]. For these models, we used the open-source code from the original papers. We modified only the validation method to ten-fold cross-validation to align with our experimental setup, while maintaining the original model architectures.
Table 1 presents the results of three classification tasks in three public datasets, using accuracy (ACC), sensitivity (SEN), and specificity (SPE) as primary metrics. As can be seen, Graph Transformer-based methods generally outperform GNN-based methods on large datasets like ABIDE I and REST-MDD, but struggle with small datasets such as Tawowu and Neurocon due to their higher parameter count, which increases the risk of overfitting. Large datasets such as REST-MDD exhibit more consistent data distributions across folds, leading to smaller standard deviations, while small datasets such as Taowu and Neurocon show greater variability. Notably, our CAGT model consistently achieves superior performance in all tasks, with accuracy improvements of 2.72% for ASD, 1.19% for MDD, and 8.46% for PD. This demonstrates the advantage of our approach in effectively extracting comprehensive representations of brain connectomes by leveraging sub-network community characteristics and brain spatial topological information.
4.4 Ablation Studies
To evaluate the effectiveness of the CAGT model's components, we conduct ablation studies across three tasks, focusing on the dual-scale spatial feature fusion module (DF), positional encoding (PE), and prior-guided multi-head attention (PA). The results are summarized in Table 2. The DF module enhances spatial representation by fusing local features of sub-networks with global features of the whole brain, achieving performance improvements of 2.92%, 2.96%, and 13.07% across the three tasks. This demonstrates the effectiveness of leveraging community-related information. The PA module further strengthens long-range interactions between brain regions and incorporates prior knowledge of brain information transmission mechanisms, contributing significantly to performance gains of 5.87%, 3.38%, and 9.7% in the respective tasks. Additionally, the inclusion of PE improves the model's spatial awareness of the brain network, increasing accuracy by 1.54%, 1.07%, and 3.26%. These results confirm the positive impact of each component on the model's diagnostic capabilities.
4.5 Biomarker Detection
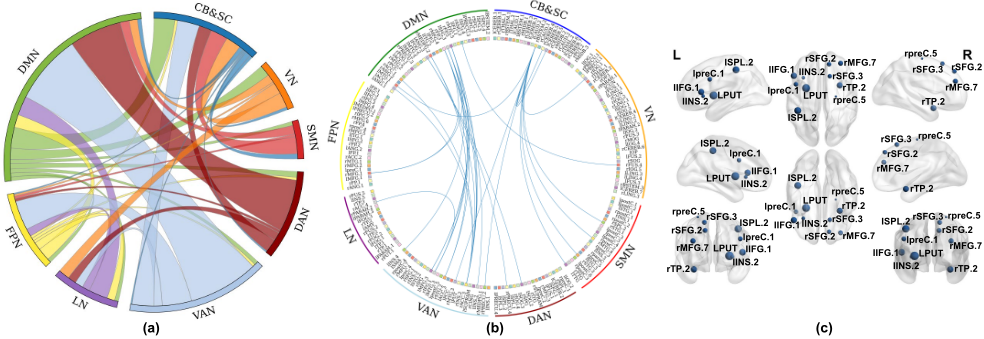
CAGT can also detect key functional communities and brain regions associated with brain disorder diagnosis. Taking ABIDE I as an example, we separately compute the average attention scores Sasd and Snc for correctly classified ASD patients and NC subjects obtained in our model. Then, the inter-community relationships is quantified by averaging the attention scores among their corresponding ROIs, this results in two inter-community connectivity matrix ¯Sasd ∈ R8×8 and ¯Snc ∈ R8×8 . By comparing ¯Sasd and ¯Snc, we can detect abnormal connectivity patterns in ASD patients. Specifically, the DMN shows the highest attention weight and demonstrates stronger connectivity with both VAN and DAN in ASD group, aligning with findings reported in [Padmanabhan et al., 2017]. Conversely, the SMN exhibits weaker connectivity with other sub-networks in ASD group, reflecting its impact on sensory and motor processing due to diminished connectivity [Marco et al., 2011; Mostofsky and Ewen, 2011]. The inter-community relationships of ASD is shown in Figure 3(a), visualizing the distinctive connectivity patterns. Furthermore, Figure 3(b) and 3(c) present the top thirty most significant functional connections and the top ten critical brain regions, identified by sparsifying the attention score matrix Sasd. Key brain regions including the frontal gyrus, precentral gyrus, putamen and insula are known to play crucial roles in sensory, motor, and cognitive processing. These results align with the existing neuroscience literature [Sussman et al., 2015; Plitt et al., 2015; Sapey-Triomphe et al., 2023].
5 Conclusion
In this work, we propose a novel framework that integrates sub-network community information and brain graph topology into the Transformer architecture to enhance brain disorder identification. The dual-scale spatial feature fusion module effectively combines local community-level features with global whole-brain features, enhances the model's ability to capture hierarchical brain interactions. The prior-guided graph Transformer incorporates brain-specific positional encoding and adds prior knowledge of brain information transmission mechanisms to the Transformer, aligning with brain biological characteristics and improving model interpretability. Our method not only achieves superior performance compared to existing methods but also reliably identifies key biomarkers associated with neurological disorders.
Acknowledgments
This work was supported in part by the Natural Science Research Project of Anhui Educational Committee under Grant 2023AH050081; in part by the Collaborative Innovation Project of Key Laboratory of Philosophy and Social Sciences in Anhui Province under Grant HZ2302; in part by the Scientific Research Project of Colleges and Universities in Anhui Province under Grant 2024AH040115; and in part by the Anhui Province Science and Technology Innovation and Tackling Key Problems Project under Grant 202423k09020041.
@inproceedings{ijcai2025p467,
  title     = {Community-Aware Graph Transformer for Brain Disorder Identification},
  author    = {Pei, Shengbing and Ma, Jiajun and Lv, Zhao and Zhang, Chao and Guan, Jihong},
  booktitle = {Proceedings of the Thirty-Fourth International Joint Conference on
               Artificial Intelligence, {IJCAI-25}},
  publisher = {International Joint Conferences on Artificial Intelligence Organization},
  editor    = {James Kwok},
  pages     = {4191--4199},
  year      = {2025},
  month     = {8},
  note      = {Main Track},
  doi       = {10.24963/ijcai.2025/467},
  url       = {https://doi.org/10.24963/ijcai.2025/467},
}
TY - CPAPER TI - Community-Aware Graph Transformer for Brain Disorder Identification AU - Pei, Shengbing AU - Ma, Jiajun AU - Lv, Zhao AU - Zhang, Chao AU - Guan, Jihong T2 - Proceedings of the Thirty-Fourth International Joint Conference on Artificial Intelligence, IJCAI-25 PB - International Joint Conferences on Artificial Intelligence Organization PY - 2025 SP - 4191 EP - 4199 DO - 10.24963/ijcai.2025/467 UR - https://doi.org/10.24963/ijcai.2025/467 ER -Copied
Machine-readable versions of this paper, for tools and AI agents:





