
Multi-View Joint Graph Representation Learning for Urban Region Embedding
Proceedings of the Twenty-Ninth International Joint Conference on Artificial Intelligence. Special track on AI for CompSust and Human well-being. Pages 4431-4437.
https://doi.org/10.24963/ijcai.2020/611
Keywords
- Data Mining: Mining Spatial, Temporal Data
- Humans and AI: Other
- Data Mining: Mining Graphs, Semi Structured Data, Complex Data
- Data Mining: Applications
Abstract
The increasing amount of urban data enable us to investigate urban dynamics, assist urban planning, and eventually, make our cities more livable and sustainable. In this paper, we focus on learning an embedding space from urban data for urban regions. For the first time, we propose a multi-view joint learning model to learn comprehensive and representative urban region embeddings. We first model different types of region correlations based on both human mobility and inherent region properties. Then, we apply a graph attention mechanism in learning region representations from each view of the built correlations. Moreover, we introduce a joint learning module that boosts the region embedding learning by sharing cross-view information and fuses multi-view embeddings by learning adaptive weights. Finally, we exploit the learned embeddings in the downstream applications of land usage classification and crime prediction in urban areas with real-world data. Extensive experiment results demonstrate that by exploiting our proposed joint learning model, the performance is improved by a large margin on both tasks compared with the state-of-the-art methods.
- [Abu-El-Haija et al., 2018] Sami Abu-El-Haija, Bryan Per- ozzi, Rami Al-Rfou, and Alexander A Alemi. Watch your step: Learning node embeddings via graph attention. In Advances in Neural Information Processing Systems, pages 9180-9190, 2018.
- [Belkin and Niyogi, 2002] Mikhail Belkin and Partha Niyogi. Laplacian eigenmaps and spectral techniques for embedding and clustering. In Advances in neural information processing systems, pages 585-591, 2002.
- [Berg, 2007] Bruce F Berg. New York City Politics: Govern- ing Gotham. Rutgers University Press, 2007.
- [Fu et al., 2019] Yanjie Fu, Pengyang Wang, Jiadi Du, Le Wu, and Xiaolin Li. Efficient region embedding with multi-view spatial networks: A perspective of locality- constrained spatial autocorrelations. In AAAI, 2019.
- [Grover and Leskovec, 2016] Aditya Grover and Jure Leskovec. node2vec: Scalable feature learning for networks. In Proceedings of the 22nd ACM SIGKDD international conference on Knowledge discovery and data mining, pages 855-864. ACM, 2016.
- [Huang et al., 2012] Zhiwu Huang, Shiguang Shan, Haihong Zhang, Shihong Lao, and Xilin Chen. Cross-view graph embedding. In Asian Conference on Computer Vision, pages 770-781. Springer, 2012.
- [Huang et al., 2018] Chao Huang, Junbo Zhang, Yu Zheng, and Nitesh V Chawla. Deepcrime: attentive hierarchi- cal recurrent networks for crime prediction. In Proceed- ings of the 27th ACM International Conference on Infor- mation and Knowledge Management, pages 1423-1432. ACM, 2018.
- [Kipf and Welling, 2016] Thomas N Kipf and Max Welling. Variational graph auto-encoders. arXiv preprint arXiv:1611.07308, 2016.
- [Pan et al., 2012] Gang Pan, Guande Qi, Zhaohui Wu, Daqing Zhang, and Shijian Li. Land-use classification using taxi gps traces. IEEE Transactions on Intelligent Transportation Systems, 14(1):113-123, 2012.
- [Perozzi et al., 2014] Bryan Perozzi, Rami Al-Rfou, and Steven Skiena. Deepwalk: Online learning of social repre- sentations. In Proceedings of the 20th ACM SIGKDD in- ternational conference on Knowledge discovery and data mining, pages 701-710. ACM, 2014.
- [Qu et al., 2017] Meng Qu, Jian Tang, Jingbo Shang, Xiang Ren, Ming Zhang, and Jiawei Han. An attention-based col- laboration framework for multi-view network representa- tion learning. In Proceedings of the 2017 ACM on Confer- ence on Information and Knowledge Management, pages 1767-1776. ACM, 2017.
- [Roweis and Saul, 2000] Sam T Roweis and Lawrence K Saul. Nonlinear dimensionality reduction by locally lin- ear embedding. science, 290(5500):2323-2326, 2000.
- [Su et al., 2015] Hang Su, Subhransu Maji, Evangelos Kalogerakis, and Erik Learned-Miller. Multi-view con- volutional neural networks for 3d shape recognition. In Proceedings of the IEEE international conference on com- puter vision, pages 945-953, 2015.
- [Sun et al., 2018] Yiwei Sun, Ngot Bui, Tsung-Yu Hsieh, and Vasant Honavar. Multi-view network embedding via graph factorization clustering and co-regularized multi- view agreement. In 2018 IEEE International Conference on Data Mining Workshops (ICDMW), pages 1006-1013. IEEE, 2018.
- [Tang et al., 2015] Jian Tang, Meng Qu, Mingzhe Wang, Ming Zhang, Jun Yan, and Qiaozhu Mei. Line: Large- scale information network embedding. In Proceedings of the 24th international conference on world wide web, pages 1067-1077. International World Wide Web Confer- ences Steering Committee, 2015.
- [Tibshirani, 1996] Robert Tibshirani. Regression shrinkage and selection via the lasso. Journal of the Royal Statistical Society: Series B (Methodological), 58(1):267-288, 1996.
- [Vaswani et al., 2017] Ashish Vaswani, Noam Shazeer, Niki Parmar, Jakob Uszkoreit, Llion Jones, Aidan N Gomez, Łukasz Kaiser, and Illia Polosukhin. Attention is all you need. In Advances in neural information processing sys- tems, pages 5998-6008, 2017.
- [Veličković et al., 2017] Petar Veličković, Guillem Cucurull, Arantxa Casanova, Adriana Romero, Pietro Lio, and Yoshua Bengio. Graph attention networks. arXiv preprint arXiv:1710.10903, 2017.
- [Wang and Li, 2017] Hongjian Wang and Zhenhui Li. Re- gion representation learning via mobility flow. In Proceed- ings of the 2017 ACM on Conference on Information and Knowledge Management, pages 237-246. ACM, 2017.
- [Yao et al., 2018] Zijun Yao, Yanjie Fu, Bin Liu, Wangsu Hu, and Hui Xiong. Representing urban functions through zone embedding with human mobility patterns. In IJCAI, pages 3919-3925, 2018. IJCAI
- [Zhang et al., 2017] Chao Zhang, Keyang Zhang, Quan Yuan, Haoruo Peng, Yu Zheng, Tim Hanratty, Shaowen Wang, and Jiawei Han. Regions, periods, activities: Un- covering urban dynamics via cross-modal representation learning. In Proceedings of the 26th International Con- ference on World Wide Web, pages 361-370. International World Wide Web Conferences Steering Committee, 2017.
- [Zhang et al., 2019] Yunchao Zhang, Yanjie Fu, Pengyang Wang, Xiaolin Li, and Yu Zheng. Unifying inter-region autocorrelation and intra-region structures for spatial em- bedding via collective adversarial learning. In Proceedings of the 25th ACM SIGKDD International Conference on Knowledge Discovery & Data Mining, pages 1700-1708. ACM, 2019.
- [Zheng et al., 2014] Yu Zheng, Tong Liu, Yilun Wang, Yan- min Zhu, Yanchi Liu, and Eric Chang. Diagnosing new york city's noises with ubiquitous data. In Proceedings of the 2014 ACM International Joint Conference on Per- vasive and Ubiquitous Computing, pages 715-725. ACM, 2014.
References were extracted automatically from the PDF and may contain errors.
Full text extracted automatically from the PDF; figures, tables and equations may differ. The PDF is the version of record.
1 Introduction
The city is composed of various kinds of regions, where people work, study, entertain and live. Studying quantitative representations of urban regions can help us better explore the correlations of urban properties and provide valuable insights into the structures and dynamics of cities. Also, such representations are of great value to downstream applications such as land usage classification [Yao et al., 2018], crime prediction [Huang et al., 2018], estate price estimation, and so on.
In recent years, with the advent of mobile sensing technologies, the increasing amount of urban data, such as human trajectories, vehicle traffic, Point-of-Interests (PoIs), and check-in records, are being collected in the digital form from diverse sources. Such various urban data reveal the configurations and connections of regions from multi-view and provide great opportunities for jointly learning the representations of urban regions, i.e., mapping the regions into distributed and low-dimensional vectors in a latent embedding space.
Human mobility flow data, such as human trajectories and vehicle traffic, have been widely used to learn the representations of regions [Pan et al., 2012; Zheng et al., 2014; Yao et al., 2018]. To explore region correlations hidden in human mobility, scholars have made great efforts on various methods ranging from matrix decomposition [Pan et al., 2012; Zheng et al., 2014] to word and network embeddings [Wang and Li, 2017; Zhang et al., 2017; Yao et al., 2018]. However, the above models are single-view based, i.e., only considering mobility flow data. As single-view based models cannot explore the power of multi-type urban data, this inherent flaw limits their performance.
Several previous studies have also tried to combine region attributes with human mobility data to characterize region representations [Zhang et al., 2019; Fu et al., 2019]. However, even multi-view data are used, there are still two shortcomings in these works. First, different views are combined simply and equally. For example, [Fu et al., 2019] considered both human mobility connectivity and geographic distance to construct PoI-PoI networks for each region. However, the correlations from the two views are simply concatenated as a feature of the region. Similarly, in [Zhang et al., 2019] the region representations from different views are also directly stacked together as a comprehensive feature. In these ways, information from different views contributes equally to the final representation, which is not the optimal combination in practice. Moreover, inter-view cooperation is not considered in these works. In the urban environment, region relations from different views are highly correlated. For example, the PoI types of a region usually imply the region's human mobility patterns, such as the time of traffic peak hours. Thus, it is important to share and propagate information between different views in the learning process, which was not considered in existing works. As a result, there is a compelling need to develop an effective solution to learn comprehensive region embeddings jointly from multi-view urban data.
In this paper, we aim to propose a joint representation learning framework for region embedding by leveraging both human mobility and inherent region properties. We design a graph neural networks based representation learning framework using homogeneous graph structures to represent both human mobility and inherent region properties. Compared with the traditional neural networks such as multilayer perceptron(MLP) used in existing works [Fu et al., 2019], graph neural networks can better capture the underlying region relationships and produce more robust region embeddings. Also, instead of simple graph reconstruction, we designed two different types of tasks to train our model, which make sure that human mobility interactions and region attribute information are well reserved in the learned region representations. Finally, we design a joint learning module to cooperate and fuse multi-view data in a deep cooperation manner. We first apply a self-attention layer to enable cross-view information sharing, which extracts useful global information from other views to boost the representation learning process of every single view. Moreover, we propose to fuse multi-view embeddings with adaptive weights and engage the fused embeddings into multiple tasks to produce more comprehensive region representations.
Overall, the contributions of this paper can be summarized as follows:
- We study the urban region representation problem by exploring region correlations in the urban environment from multiple views, including human mobility and inherent region properties.
- We propose a joint learning model to incorporate multiview region correlations to learn comprehensive region embeddings. Specifically, we design a cross-view information sharing layer to boost the learning of individual view and a fusion layer to effectively combine multiple views.
- We conduct extensive experiments to evaluate our method based on real-world data. The results demonstrate that our method consistently outperforms state-ofthe-art baselines by over 20% in land usage classification and over 10% in crime prediction tasks in terms of various metrics.
In the rest of this paper, we first illustrate some preliminary definitions and define the problem. Then, we introduce the proposed model in details and show the experiment settings and results. At last, we introduce related work and conclude our paper.
2 Preliminaries and Problem Statement
Urban human mobility We define urban human mobility as a set of trip records that occur in urban areas. We denote a human mobility dataset as M and each entity in M is a tuple consisted of source and destination of the trip:
where rs is the start region and rd is the destination region.
Urban region attributes The region attributes are the inherent social and geographic features of urban regions. A certain type of attribute of regions can be denoted as A as follows:
where ai is the corresponding feature of i-th region and F is the number of dimensions of that feature. In our work, multiple region attributes, like PoIs and check-in records, are considered.
Urban region representation learning Give the human mobility M and the set of urban region attributes As, the goal of urban region representation learning is to learn a distributed and low dimensional embedding of each urban region, which is denoted as E,
where ⃗ei is the embedding of i-th region, and d is the embedding size. In the d-dimension embedding space, the region correlations revealed by both the human mobility and region attributes are preserved.
3 Methodology
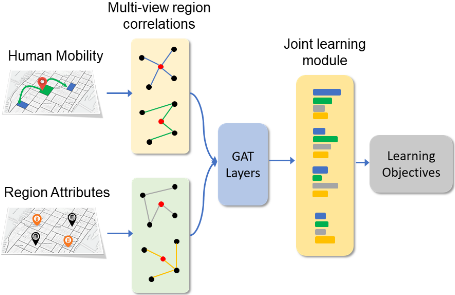
Figure 1 shows the framework of our proposed multi-view joint representation learning framework. First, we introduce the modeling of multi-view correlations between urban regions from both human mobility and region attributes. We then describe our base model and learning objectives. Finally, we present an effective multi-view joint learning module.
3.1 Multi-viewCorrelationModeling
Urban regions are related to each other from multiple aspects. For example, in terms of human mobility activities, like commuting, remote regions may form a community that serves as a daily life circle in the urban environment. Alternatively, according to the inherent attributes of regions such as PoI distribution, adjacent regions show high correlations due to similar functionalities. To learn robust and comprehensive representations of urban regions, we have to consider region correlations from multiple views jointly. In our method, we construct four types of region correlations based on human mobility and region attributes.
Region Correlations Based on Human Mobility
Recent studies [Wang and Li, 2017; Yao et al., 2018] have shown that human mobility reveals important underlying region correlations. Regions that receive human flows from the same sources or send human flows to the same targets usually play similar roles and are considered close to each other from the human mobility view [Yao et al., 2018]. In our method, we define the source and destination context of a region based on inter-region interactions. Given a set of human mobility M, the interaction weight from region ri to region rj is computed as: wri rj = |{(rs, rd) ∈ M|rs = ri, rd = rj}|, where |.| counts the set size. Then the source and destination contexts of a region ri are described by distributions ps(r|ri) and pd(r|ri) as follows:
Based on the source and destination context of each region, we define two types of correlations as follows,
where sim(·) denotes the cosine similarity, C ij s is the source correlation, C ij d represents the destination correlation.
Region Correlations Based on Region Attributes
The inherent region attritbutes are the meta-knowledge that describes the geographic and social nature of a region. Given a type of attributes of n regions A = {⃗ai}ni=1 , the corresponding region correlations are computed as
We consider two attributes as follows:
- PoI attributes: The PoI attributes of a region refer to the importance of each type of PoIs within the region. Specifically, we first map PoIs to the located region. Then we compute the importance of each type of PoIs in a region using TF-IDF model by considering a PoI as word and a region as a document.
- Check-in attributes: Check-in data are posted by users who appear in a specific PoI. Different from PoI attributes only describing the quantity of PoIs, check-in data takes human activities into account and reflects the activeness of each PoI category. Similarly, we use TFIDF model to compute the importance of each type of check-ins within a region as its check-in attribute.
From the PoI and check-in attributes of regions, we compute the PoI correlation Cpoi and check-in correlation Cchk between regions as illustrated in equation (4).
3.2 Base Model
Now, we introduce the base model that learns region representations using region correlations from single view. Generally, given the region correlation C from a single view, we first construct a graph G(V,N), where V = {vi}ni=1 denotes n regions and N = {Ni}ni=1 denotes the neighborhood of each node. Ni is defined as the set of k nearest neighbors of vi in terms of correlation C. Following this procedure, we construct graphs Gs, Gd, Gpoi and Gchk based on region correlations Cs, Cd, Cpoi and Cchk, respectively.
After the construction of the graph, we employ graph attention network(GAT) [Veliˇckovi´c et al., 2017] to learn representations of vertices. GAT applies attention mechanism on graph-structured data. It updates the representation of a vertex by propagating information to its neighbors, where the weights of its neighbor vertices is learned by attention mechanism automatically. Formally, given the input vertex feature h = {⃗h1,⃗h2, . . . ,⃗hn} ,⃗hi ∈ RF , a GAT layer updates the vertex representations by following steps:
where W and -→a are learnable parameters, ‖ is the concatenation operation. To enhance the performance, we apply multi-head attention mechanism in each GAT layer as suggested [Veliˇckovi´c et al., 2017]. In practice, we stack two GAT layers together as a GAT block. We apply GAT blocks on graphs Gs, Gd, Gpoi and Gchk and denote the output vertex representations as Es, Ed, Epoi and Echk respectively.
3.3 Joint LearningModule
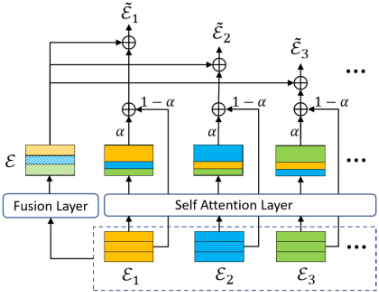
The above base model merely learns region representations based on single-view region correlations. In order to enable cooperation among different views during learning process and effectively fuse multi-view representations, we present a joint learning module as shown in Figure 2. The proposed framework consists of two parts. The first part enables information sharing across all views via a self attention layer. The second part is a fusion layer that combines multi-view representations by learning adaptive weights.
Cross-view Information Sharing
Region correlations observed from multiple views are various but highly related. Take human mobility correlations and PoI correlations of regions as example. In the morning rush hours, most people move from the regions with residence PoIs to the regions with business PoIs, while in the evening rush hours people move in the opposite direction. Such high correlations inspire us that incorporating information frommulti-view can enhance the learning process of each single view.
Based on the above intuition, we propose to employ the self-attention mechanism [Vaswani et al., 2017] to propagate knowledge across the representations of different views. Given the representations from M different views as {Ei ∈ Rn×d }Mi=1 . For each representation Ei, we associate a key matrix Ki ∈ Rn×k and a query matrix Qi ∈ Rn×k with it as follows:
For each view, we then propagate information among all views as follows:
In our case, ˆ Ei is considered as the relevant global information for i-th view. To incorporate this information in the learning process, we compute
where E ′ i is the representation for i-th viewwith global information, and α is the weight of global information.
Multi-view Fusion
To adopt the learned region representations in various applications, a comprehensive region representation that preserves multi-view correlations is needed. To fuse the multi-view representations, we propose a fusion layer that learns adaptive weights for different views as follows:
where wi is the weight of i-th view, which is learned by a single layer MLP network with the i-th embeddings as input.
In order to enable the learning of the multi-view fusion layer, we engage E in the learning objective of each view. Formally, we update the representation of each view as:
By feeding the outputs of the base model into proposed joint learning module, we obtain region embeddings ˜ Es, ˜ Ed, ˜ Epoi and ˜ Echk, on which we design various learning tasks.
3.4 Learning Objectives
To effectively training our model, we design two types of tasks based on human mobility and region attributes, i.e., source and destination region prediction and region relation reconstruction.
Source and destination prediction We aim to predict the destination region given the source region or conversely based on the region representations ˜ Es = {eis }ni=1 and ˜ Ed = {eid }ni=1 . Given the source region ri, we model the distribution of destination region rj as follow:
Correspondingly, we model the distribution of source region ri for a given destination region rj as:
Then given the human mobility dataset M which contains real-world source and destination region pairs, the learning objective function is defined as the negative log-likelihood of predicted distributions. Formally, the objective function can expressed as:
Region relations reconstruction To let the learned region embeddings reserve the region similarity in terms of different region attributes, we design the task to reconstruct region correlations based on corresponding embeddings. Take PoI attributes as example, the learning objective is defined based on Cpoi and ˜ Epoi = {eipoi }ni=1 as follow:
Similarly, we define the learning objective Lchk of check-in attributes. In this way, the final learning objective is:
4 Evaluation
We empirically evaluate our model with two important downstream applications: land usage classification and crime prediction.
4.1 Experiment Settings
Data Description
We collect several real-world datasets of New York City from NYC open data website 1 . The description of each dataset is shown in Table 1. We apply taxi trip data as the human mobility data and use Manhattan borough that divided into 180 regions as our studied area.
| Dataset | Description |
|---|---|
| Census blocks | Boundaries of 180 regions split by streets in Manhattan, New York. |
| Taxi trips | Around 10 million taxi trip records during one month in the studied area. |
| PoI data | Around 20 thousand PoI locations of 13 categories in the studied area. |
| Check-in data | Over 100 thousand check-in locations of over 200 fine-grained categories. |
| Crime data | Around 40 thousand crime records during one year in the studied area. |
1 opendata.cityofnewyork.us
Baseline Algorithms
We conduct experiments on following 8 baselines of 4 types:
I. Single viewmethods
- CHK: We merely use the check-in attribute of a region as the region embedding.
- PoI: We directly use the PoI attributes of a region with TF-IDF method as the region embedding.
II. Graph embedding methods
- GAE: We apply graph autoencoder(GAE) in [Kipf and Welling, 2016] on the multi-view graphs of regions and make the GAE of each view share the middle layer to learn region embeddings.
- node2vec: We apply node2vec in [Grover and Leskovec, 2016] on multi-view graphs of regions and concatenate the embeddings of each view.
III. State-of-the-art methods
- HDGE: HDGE [Wang and Li, 2017] jointly learns region representations by path sampling on both traffic flow graph and spatial graph.
- ZE-Mob: ZE-Mob [Yao et al., 2018] learns region embeddings by considering the co-currency relation of regions in human mobility trips.
- MV-PN: [Fu et al., 2019] proposed to learn region embeddings with multi-view PoI network within the region. We denote it as MV-PN.
IV. Variant of our method
- Ours(No-J): In this variant of our model, we disable the joint learning module and assigning equal weights to each view to fuse the multi-view embeddings.
- Ours(Mob): In this variant of our model, we train our model only based on human mobility data.
In our experiments, the embedding sizes of CHK and PoI are the number of check-in and PoI categories, respectively. The embedding size of HDGE and ZE-Mob are set as 20 and 96 as suggested by the authors. The embedding sizes of GAE, node2vec, MV-PN, our model and variants are set as 96. Please refer to the released code 2 for details of the implementations.
4.2 Land Usage Classification
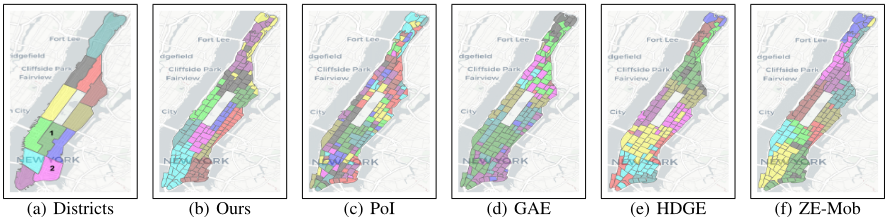
In the task of land usage classification, we aim to cluster regions into groups based on their embeddings using K-means. The regions with the same land usage type are supposed to be assigned to the same group. We use the district division by the community boards [Berg, 2007] as ground truth. As shown in Figure 3(a), the borough of Manhattan is divided into 12 districts mainly based on the land usage. For example, district 1 is known as the central business district (CBD).
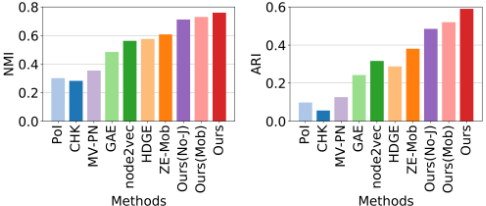
We evaluate the clustering results using Normalized Mutual Information (NMI) and Adjusted Rand Index (ARI) following the settings in [Yao et al., 2018]. The results are shown in Figure 4. From the results, we have the following observations. i) The methods considering multi-view region correlations generally have better performance than the methods considering only single-view correlations, i.e., PoI and CHK. However, a simple combination of multi-view region representations, such as GAE and node2vec, can not fully exploit the multi-view information. ii) Our method outperforms all baseline methods by a large margin, which reaches over 20% improvement in terms of NMI and over 50% improvement in terms of ARI compared with state of the art methods. iii) The simple combination of multi-view information causes decline of the performance, referring to Ours(Mob) vs. Ours(No-J). In contrast, the multi-view fusion layer brings around 5% and 20% improvement in terms of NMI and ARI compared with the base model, referring to Ours vs. Ours(No-J).
2 https://github.com/mingyangzhang/mv-region-embedding
To intuitively evaluate the clustering results, we visualized the clustering results of five methods in Figure 3, where the same color marks regions in the same cluster. We can observe that the clusters based on our method best fit the real districts. For example, for districts one and two, the boundaries drawn by our method are very close to the real boundaries. The above results show that the region embeddings learned by our model can well represent the region functionalities, and our method is able to effectively fuse multi-view information.
4.3 Crime Prediction
In this task, we predict the number of crime events in each region for one year with the learned region embeddings. In practice, we apply the Lasso regression model [Tibshirani, 1996] to conduct the prediction.
| MAE | RMSE | R2 | |
|---|---|---|---|
| CHK | 102.28 | 141.11 | 0.089 |
| PoI | 94.71 | 129.01 | 0.239 |
| GAE | 96.55 | 133.10 | 0.189 |
| node2vec | 102.00 | 135.61 | 0.158 |
| HDGE | 72.65 | 95.36 | 0.584 |
| ZE-Mob | 101.98 | 132.16 | 0.200 |
| MV-PN | 92.30 | 123.96 | 0.297 |
| Ours(No-J) | 67.78 | 93.62 | 0.599 |
| Ours(Mob) | 66.13 | 89.93 | 0.630 |
| Ours | 65.16 | 88.19 | 0.644 |
| Improve | 10.3% | 7.5% | 10.3% |
We use Mean Absolute Error (MAE), Root Mean Square Error(RMSE) to measure the prediction errors, and the coefficient of determination (R2 ) to measure the goodness of fit of models. We select the value of the weight of l1 normalization in the Lasso model for each method by grid searching and compute all the metrics by K-Fold cross-validation, where K=5. The results are shown in Table 2. From the results, we can observe that our method outperforms all the baselines by a large margin. As listed in the last row, our model achieves over 10% improvement in terms of MAE and R2 , achieves 7.5% improvement in terms of RMSE. Moreover, the cross-view sharing mechanism brings considerable improvements, referring to Our vs. Our(No-J). Another observation is that the simple combination of multi-view correlations, i.e., node2vec, ZE-Mob, lead to worse performance than some single view methods, i.e., PoI in this task. This result shows that the simple combination of multi-view correlations will lose some information from views that are important for crime prediction.
5 RelatedWork
5.1 Graph Embedding
Graph embedding aims to learn low-dimensional vectors to represent vertices in graphs. A traditional approach for graph embedding is based on the factorization of the adjacency matrix, Laplacian matrix or other variants [Roweis and Saul, 2000; Belkin and Niyogi, 2002]. Inspired by word embedding models, some other algorithms are proposed to learn vertex embedding based on random walk [Perozzi et al., 2014; Grover and Leskovec, 2016], or other neighborhood sampling techniques [Tang et al., 2015]. More recently, many graph embedding methods based on graph neural networks arise [Abu-El-Haija et al., 2018] [Kipf andWelling, 2016]. In our method, we use the graph attention networks [Veliˇckovi´c et al., 2017] as the base model to learn region embeddings from a single view.
5.2 Multi-viewRepresentation Learning
The techniques for learning representation from multi-view information can be classified into two categories. The first category learns representations in different views that are maximally correlated. The second category replies on multiview fusion[Su et al., 2015]. A child field of this area related to our work is multi-view graph embedding, which are mainly based on cross-view regularization [Sun et al., 2018; Qu et al., 2017; Huang et al., 2012]. However, the explicit cross-view information passing is not considered in these methods, which is demonstrated to be important for urban region representation learning problem by this paper.
5.3 Region Representation Learning
Learning urban region embeddings have attracted much attention because of the booming of urban big data. Human mobility data are used in many previous works to model the relationship between regions by constructing transition graphs [Wang and Li, 2017] or counting co-occurrences [Yao et al., 2018]. However, the inherent region properties such as PoIs are ignored in these works. Alternatively, multiview data of both human mobility and region attributes have been utilized in some recent works [Zhang et al., 2019; Fu et al., 2019]. For example, Fu et al. [Fu et al., 2019] proposed an autoencoder based model that combines PoI correlations and mobility information. However, these methods combine multi-view information by simple manners without cross-view information sharing and cooperation.
6 Conclusion
In this paper, we presented a multi-view joint learning model for urban region embedding. Specifically, We utilized human mobility data, and inherent region attributes to construct multi-view region correlations. We proposed a joint learning module to learn comprehensive region representations by enabling cross-view information sharing and weighted multiview fusion. We conducted extensive experiments based on real-world data to evaluate the effectiveness of our model. The results demonstrate that our method is able to effectively cooperate and fuse multi-view urban data to learn comprehensive region embeddings and consistently outperforms baselines in various tasks. In future work, we will explore the effects of different views of urban data in specific tasks and extend our framework to be more task adaptive.
Acknowledgments
This research has been supported in part by the project 16214817 from the Research Grants Council of Hong Kong, project FP805 from HKUST, the 5GEAR project and the FIT project from the Academy of Finland.
@inproceedings{ijcai2020p611,
  title     = {Multi-View Joint Graph Representation Learning for Urban Region Embedding},
  author    = {Zhang, Mingyang and Li, Tong and Li, Yong and Hui, Pan},
  booktitle = {Proceedings of the Twenty-Ninth International Joint Conference on
               Artificial Intelligence, {IJCAI-20}},
  publisher = {International Joint Conferences on Artificial Intelligence Organization},
  editor    = {Christian Bessiere},
  pages     = {4431--4437},
  year      = {2020},
  month     = {7},
  note      = {Special track on AI for CompSust and Human well-being},
  doi       = {10.24963/ijcai.2020/611},
  url       = {https://doi.org/10.24963/ijcai.2020/611},
}
TY - CPAPER TI - Multi-View Joint Graph Representation Learning for Urban Region Embedding AU - Zhang, Mingyang AU - Li, Tong AU - Li, Yong AU - Hui, Pan T2 - Proceedings of the Twenty-Ninth International Joint Conference on Artificial Intelligence, IJCAI-20 PB - International Joint Conferences on Artificial Intelligence Organization PY - 2020 SP - 4431 EP - 4437 DO - 10.24963/ijcai.2020/611 UR - https://doi.org/10.24963/ijcai.2020/611 ER -Copied
Machine-readable versions of this paper, for tools and AI agents:





