
Multi-TA: Multilevel Temporal Augmentation for Robust Septic Shock Early Prediction
Proceedings of the Thirty-Third International Joint Conference on Artificial Intelligence. Main Track. Pages 6035-6043.
https://doi.org/10.24963/ijcai.2024/667
Keywords
- Machine Learning: ML: Robustness
- Natural Language Processing: NLP: Applications
- Multidisciplinary Topics and Applications: MTA: Health and medicine
- Machine Learning: ML: Time series and data streams
Abstract
Early predicting the onset of a disease is critical to timely and accurate clinical decision-making, where a model determines whether a patient will develop the disease n hours later. While deep learning algorithms have demonstrated great success using multivariate irregular time-series data such as electronic health records (EHRs), they often lack temporal robustness due to data scarcity problems becoming more prominent at multilevel as n increases. At event-level, the decreasing number of available events per trajectory increases uncertainty in anticipating future disease behavior. At trajectory-level, the scarcity of patient trajectories limits diversity in the training population, hindering the model's generalization. This work introduces Multi-TA, a multilevel temporal augmentation framework that leverages BERT-based temporal EHRs representation learning and a unified data augmentation approach, effectively addressing data scarcity issues at both event and trajectory levels. Validated on two real-world EHRs for septic shock, Multi-TA outperforms mixup and GAN-based state-of-the-art models across eight prediction windows, demonstrating improved temporal robustness. Further, we provide in-depth analyses on data augmentation.
- [Achenchabe et al., 2021] Y. Achenchabe, A. Bondu, A. Cornuéjols, and A. Dachraoui. Early classification of time series: Cost-based optimization criterion and algorithms. Machine Learning, 110(6):1481-1504, 2021.
- [Baowaly et al., 2019] M. K. Baowaly, C. Lin, C. Liu, and K. Chen. Synthesizing electronic health records us- ing improved generative adversarial networks. JAMIA, 26(3):228-241, 2019.
- [Benavoli et al., 2016] A. Benavoli, G. Corani, and F. Mangili. Should we really use post-hoc tests based on mean-ranks? JMLR, 17(1):152-161, 2016.
- [Birkhead et al., 2015] G. S. Birkhead, M. Klompas, and N. Shah. Uses of electronic health records for public health surveillance to advance public health. Annu. Rev. Public Health, 36:345-359, 2015.
- [Bondu et al., 2022] A. Bondu, Y. Achenchabe, A. Bifet, F. Clérot, A. Cornuéjols, et al. Open challenges for machine learning based early decision-making research. SIGKDD Explor., 24(2):12-31, 2022.
- [Che et al., 2015] Z. Che, D. Kale, W. Li, M. T. Bahadori, and Y. Liu. Deep computational phenotyping. In SIGKDD, pages 507-516. ACM, 2015.
- [Che et al., 2017] Z. Che, Y. Cheng, S. Zhai, Z. Sun, and Y. Liu. Boosting deep learning risk prediction with gener- ative adversarial networks for electronic health records. In ICDM, pages 787-792. IEEE, 2017.
- [Choi et al., 2016] E. Choi, M. T. Bahadori, J. Sun, J. Kulas, A. Schuetz, and W. Stewart. Retain: An interpretable pre- dictive model for healthcare using reverse time attention mechanism. In NeurIPS, pages 3504-3512, 2016.
- [Choi et al., 2017a] E. Choi, M. T. Bahadori, L. Song, W. F. Stewart, and J. Sun. Gram: graph-based attention model for healthcare representation learning. In SIGKDD, pages 787-795. ACM, 2017.
- [Choi et al., 2017b] E. Choi, S. Biswal, B. Malin, J. Duke, W. F. Stewart, and J. Sun. Generating multi-label discrete patient records using generative adversarial networks. In MLHC, pages 286-305. PMLR, 2017.
- [Cui et al., 2020] L. Cui, S. Biswal, L. M. Glass, G. Lever, J. Sun, and C. Xiao. Conan: complementary pattern aug- mentation for rare disease detection. In AAAI, volume 34, pages 614-621, 2020.
- [Devlin et al., 2019] J. Devlin, M. Chang, K. Lee, and K. Toutanova. BERT: Pre-training of deep bidirectional transformers for language understanding. In NAACL, pages 4171-4186. ACL, 2019.
- [Esteban et al., 2016] C. Esteban, O. Staeck, et al. Predict- ing clinical events by combining static and dynamic infor- mation using recurrent neural networks. In ICHI, pages 93-101. IEEE, 2016.
- [Esteban et al., 2017] C. Esteban, S. L. Hyland, and G. Rätsch. Real-valued (medical) time series generation with recurrent conditional gans. arXiv:1706.02633, 2017.
- [Fleuren et al., 2020] L. M. Fleuren, T. LT. Klausch, C. L. Zwager, L. J. Schoonmade, et al. Machine learning for the prediction of sepsis: a systematic review and meta- analysis of diagnostic test accuracy. Intensive Care Med., 46:383-400, 2020.
- [Gao et al., 2022] G. Gao, Q. Gao, X. Yang, M. Pajic, and M. Chi. A reinforcement learning-informed pattern min- ing framework for multivariate time series classification. In IJCAI, 2022. IJCAI
- [Iglesias et al., 2023] G. Iglesias, E. Talavera, Á. González- Prieto, A. Mozo, and S. Gómez-Canaval. Data augmenta- tion techniques in time series domain: a survey and taxon- omy. Neural Computing and Applications, 35(14):10123- 10145, 2023.
- [Khoshnevisan and Chi, 2021] Farzaneh Khoshnevisan and Min Chi. Unifying domain adaptation and domain gen- eralization for robust prediction across minority racial groups. In ECML-PKDD, pages 521-537. Springer, 2021.
- [Kim and Chi, 2018] Y. J. Kim and M. Chi. Temporal belief memory: Imputing missing data during rnn training. In IJCAI, pages 2326-2332, 2018. IJCAI
- [Kumar et al., 2006] A. Kumar, D. Roberts, K. E. Wood, B. Light, J. E. Parrillo, et al. Duration of hypotension be- fore initiation of effective antimicrobial therapy is the crit- ical determinant of survival in human septic shock. Crit. Care Med., 34(6):1589-1596, 2006.
- [Lee et al., 2020] D. Lee, X. Jiang, and H. Yu. Harmonized representation learning on dynamic ehr graphs. J. Biomed. Inform., 106:103426, 2020.
- [Li et al., 2015] H. Li, X. Li, X. Jia, M. Ramanathan, and A. Zhang. Bone disease prediction and phenotype dis- covery using feature representation over electronic health records. In BCB, pages 212-221. ACM, 2015.
- [Li et al., 2020] Y. Li, S. Rao, J. R. A. Solares, A. Has- saine, R. Ramakrishnan, D. Canoy, Y. Zhu, K. Rahimi, and G. Salimi-Khorshidi. Behrt: transformer for electronic health records. Sci. Rep., 10(1):1-12, 2020.
- [Li et al., 2021] J. Li, B. J. Cairns, J. Li, and T. Zhu. Generating synthetic mixed-type longitudinal electronic health records for artificial intelligent applications. arXiv:2112.12047, 2021.
- [Lin et al., 2019] C. Lin, J. Ivy, and M. Chi. Multi-layer fa- cial representation learning for early prediction of septic shock. In Big Data, pages 840-849. IEEE, 2019.
- [Lipton et al., 2015] Z. C. Lipton, D. C. Kale, C. Elkan, and R. Wetzel. Learning to diagnose with lstm recurrent neural networks. arXiv:1511.03677, 2015.
- [Luo et al., 2020] J. Luo, M. Ye, C. Xiao, and F. Ma. Hi- tanet: Hierarchical time-aware attention networks for risk prediction on electronic health records. In SIGKDD, pages 647-656. ACM, 2020.
- [Ma et al., 2020] L. Ma, C. Zhang, Y. Wang, W. Ruan, et al. Concare: Personalized clinical feature embedding via cap- turing the healthcare context. In AAAI, volume 34, pages 833-840, 2020.
- [Mogren, 2016] O. Mogren. C-rnn-gan: Continuous recurrent neural networks with adversarial training. arXiv:1611.09904, 2016.
- [Mould, 2012] D. R. Mould. Models for disease progres- sion: new approaches and uses. Clin. Pharmacol. Ther., 92(1):125-131, 2012.
- [Nguyen et al., 2017] P. Nguyen, T. Tran, N. Wickramas- inghe, and S. Venkatesh. Deepr: A convolutional net for medical records. IEEE J. Biomed. Health Inform., 21(1):22-30, 2017.
- [Pang et al., 2021] C. Pang, X. Jiang, K. S. Kalluri, M. Spot- nitz, R. Chen, A. Perotte, and K. Natarajan. Cehr-bert: In- corporating temporal information from structured ehr data to improve prediction tasks. In ML4H, pages 239-260.
- PMLR, 2021.
- [Poulain et al., 2022] R. Poulain, M. Gupta, and R. Beheshti. Few-shot learning with semi-supervised transformers for electronic health records. In MLHC, pages 853-873.
- PMLR, 2022.
- [Rasmy et al., 2021] L. Rasmy, Y. Xiang, Z. Xie, C. Tao, and D. Zhi. Med-bert: pretrained contextualized embeddings on large-scale structured electronic health records for dis- ease prediction. NPJ digital medicine, 4(1):1-13, 2021.
- [Richardson et al., 2020] S. Richardson, J. S. Hirsch, M. Narasimhan, J. M. Crawford, et al. Presenting Char- acteristics, Comorbidities, and Outcomes Among 5700 Patients Hospitalized With COVID-19 in the New York City Area. JAMA, 323(20):2052-2059, 2020.
- [Shahar, 1997] Y. Shahar. A framework for knowledge- based temporal abstraction. Artif. Intell., 90(1):79-133, 1997.
- [Shang et al., 2019] J. Shang, T. Ma, C. Xiao, and J. Sun. Pre-training of graph augmented transformers for medica- tion recommendation. In IJCAI, pages 5953-5959, 2019. IJCAI
- [Simonyan et al., 2014] K. Simonyan, A. Vedaldi, and A. Zisserman. Deep inside convolutional networks: Vi- sualising image classification models and saliency maps. 2014.
- [Singer et al., 2016] M. Singer, C. S. Deutschman, C. W. Seymour, M. Shankar-Hari, D. Annane, et al. The third international consensus definitions for sepsis and septic shock (sepsis-3). JAMA, 315(8):801-810, 2016.
- [Singhal et al., 2023] K. Singhal, S. Azizi, T. Tu, S. S. Mah- davi, J. Wei, H. W. Chung, N. Scales, A. Tanwani, H. Cole- Lewis, S. Pfohl, et al. Large language models encode clin- ical knowledge. Nature, 620(7972):172-180, 2023.
- [Sohn and Park, 2022] H. Sohn and B. Park. Robust and in- formative text augmentation (rita) via constrained worst- case transformations for low-resource named entity recog- nition. In SIGKDD, page 1616-1624. ACM, 2022.
- [Sohn et al., 2020] H. Sohn, K. Park, and M. Chi. Mulan: Multilevel language-based representation learning for dis- ease progression modeling. In BigData, pages 1246-1255. IEEE, 2020.
- [Tintinalli et al., 2011] J. E. Tintinalli, J. S. Stapczynski, O. J. Ma, D. M. Cline, R. Cydulka, and G. D. Meck- ler. Tintinallis emergency medicine A comprehensive study guide, chapter 146: Septic Shock, pages 1003-1014.
- [Tonelli et al., 2018] M. Tonelli, N. Wiebe, B. J. Manns, et al. Comparison of the Complexity of Patients Seen by Different Medical Subspecialists in a Universal Health Care System. JAMA Network Open, 1(7):e184852- e184852, 11 2018.
- [Verma et al., 2019] V. Verma, A. Lamb, C. Beckham, A. Najafi, I. Mitliagkas, D. Lopez-Paz, and Y. Bengio. Manifold mixup: Better representations by interpolating hidden states. In ICML, pages 6438-6447. PMLR, 2019.
- [Wang et al., 2014] X. Wang, D. Sontag, and F. Wang. Un- supervised learning of disease progression models. In SIGKDD, page 85-94. ACM, 2014.
- [Wei et al., 2023] S. Wei, Y. Xie, C. S. Josef, and R. Ka- maleswaran. Granger causal chain discovery for sepsis- associated derangements via continuous-time hawkes pro- cesses. In SIGKDD, pages 2536-2546, 2023.
- [Wen et al., 2021] Q. Wen, L. Sun, F. Yang, X. Song, J. Gao, X. Wang, and H. Xu. Time series data augmentation for deep learning: A survey. In IJCAI, pages 4653-4660, 2021. IJCAI
- [Yan et al., 2022] M. Y. Yan, L. T. Gustad, and Ø. Nytrø. Sepsis prediction, early detection, and identification using clinical text for machine learning: a systematic review. J. Am. Med. Inform. Assoc., 29(3):559-575, 2022.
- [Yang et al., 2021] X. Yang, Y. Zhang, and M. Chi. Multi- series time-aware sequence partitioning for disease pro- gression modeling. In IJCAI, pages 3581-3587, 2021.
- [Yang et al., 2023] X. Yang, G. Gao, and M. Chi. Hierarchi- cal apprenticeship learning for disease progression model- ing. In IJCAI, pages 2388-2396, 2023. IJCAI
- [Yoon et al., 2019] J. Yoon, D. Jarrett, and M. van der Schaar. Time-series generative adversarial networks. In NeurIPS, volume 32, 2019.
- [Yu et al., 2019] K. Yu, Y. Wang, Y. Cai, C. Xiao, E. Zhao, L. Glass, and J. Sun. Rare disease detection by se- quence modeling with generative adversarial networks. arXiv:1907.01022, 2019.
- [Zhang et al., 2018] H. Zhang, M. Cisse, Y. N. Dauphin, and D. Lopez-Paz. mixup: Beyond empirical risk minimiza- tion. In ICLR, 2018.
- [Zhang et al., 2019] Y. Zhang, X. Yang, J. Ivy, and M. Chi. Attain: attention-based time-aware lstm networks for dis- ease progression modeling. In IJCAI, pages 10-16, 2019. IJCAI
- [Zhou et al., 2013] J. Zhou, J. Sun, Y. Liu, J. Hu, and J. Ye. Patient risk prediction model via top-k stability selection. In SDM, pages 55-63. SIAM, 2013.
References were extracted automatically from the PDF and may contain errors.
Full text extracted automatically from the PDF; figures, tables and equations may differ. The PDF is the version of record.
1 Introduction
A disease progression model (DPM) aims to estimate how a target disease would progress over time based on historical data such as multivariate time-series electronic health records (EHRs) [Mould, 2012]. One important purpose of DPM is to detect diseases as early and accurately as possible since robust and accurate early prediction can assist timely clinical interventions [Zhou et al., 2013; Li et al., 2015; Che et al., 2015; Choi et al., 2016; Choi et al., 2017a] and reduce the risk of mortality as well as the burden on patients and the healthcare system [Kumar et al., 2006; Wang et al., 2014]. While recent deep learning-based early prediction models have demonstrated great success by utilizing RNNs, CNNs, or Transformers [Lipton et al., 2015; Birkhead et al., 2015; Choi et al., 2016; Esteban et al., 2016; Luo et al., 2020; Rasmy et al., 2021; Yang et al., 2021], one of the major shortcomings of the existing approaches is that they do not perform consistently well on EHRs as n increases (i.e. tradeoff between earliness and accuracy) [Achenchabe et al., 2021; Bondu et al., 2022]. In this work, we refer to such phenomena as the lack of temporal robustness.
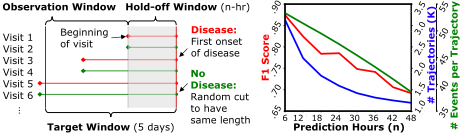
Typically, EHRs contain patient trajectories, which are represented by a single hospital visit by an inpatient: a visit is a series of events recorded at irregular times; an event consists of a set of data entries (e.g. measurements of vital signs) collected during a certain period of time. As shown in Figure 1 (left), our goal is to predict whether a patient will develop a disease n hours later by leveraging the patient's EHRs in the observation windows until n hours before the onset of the disease or the end of the sequence. Figure 1 (right) shows that as we increase n from 6 to 48 hours, the early prediction performance (red line) deteriorates as observed in other previous works [Lin et al., 2019; Zhang et al., 2019; Khoshnevisan and Chi, 2021]. It is primarily caused by the fact that as n increases, data scarcity problems become more prominent, due to the patient behavior of visiting a hospital when their symptoms become noticeable. More specifically, we identified two levels of data scarcity: the event-level scarcity, decreasing number of events per trajectory (green line in Figure 1) make it more difficult for models to predict the following behavior of diseases or relevant medical signals within the hold-off n hours window. The trajectory-level scarcity refers to as n increases, the number of patient trajectories decreases (blue line) and causes insufficient diversity in the training population to learn possible variations of disease progression across patients.
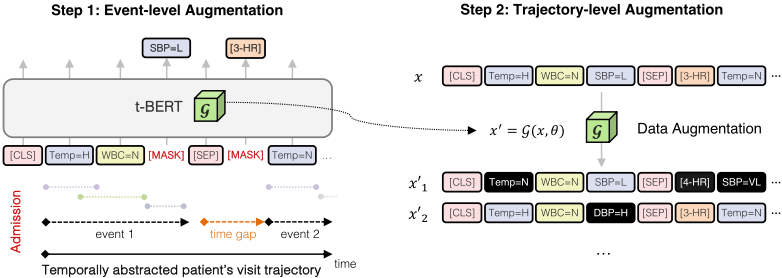
In this work, we propose a temporal EHRs augmentation (Multi-TA) framework. Figure 2 shows that Multi-TA consists of two key components, one per source of scarcity: (1) Representation learning module (left) is designed to address event-level scarcity by acquiring knowledge about the temporal dynamics of events or patient health status within the holdoff window and fill in the missing pieces; (2) Data augmentation module (right) is devised to address trajectory-level scarcity. By leveraging the representation learning module (G) and optimizing the level of data transformation (θ) within a regular training process, the module generates synthetic trajectories that are realistic but extreme for the prediction model in a way that the model can learn sufficient variations of disease progression and become temporally robust.
We validate Multi-TA on the task of septic shock early prediction due to its critical significance in healthcare and its difficulty. However, our framework is generalizable to diverse tasks involving multivariate irregular time-series data, particularly those facing challenges similar to EHRs. Sepsis, a life-threatening medical condition resulting from a dysregulated body response to infection, can lead to the most severe complication known as septic shock, characterized by high mortality rates and prolonged hospitalization [Singer et al., 2016]. Timely treatment is crucial, as each hour's delay in antibiotic administration increases the mortality risk by 8% [Kumar et al., 2006]. Additionally, sepsis, with diverse etiologies like cancer, presents a wide range of syndromes, and different patient groups may exhibit distinct symptoms [Tintinalli et al., 2011]. Our study, utilizing realworld data from two US medical systems, demonstrates that Multi-TA can enhance the temporal robustness of early prediction models. There have been a few lines of research that aim to improve the robustness of prediction models. One utilizes EHR representation learning models trained with largescale unlabeled data [Li et al., 2020; Rasmy et al., 2021; Pang et al., 2021] while the other employs data augmentation to address the data scarcity problem from the root by generating extra labeled data [Esteban et al., 2017; Che et al., 2017; Baowaly et al., 2019; Poulain et al., 2022]. However, to our knowledge, no prior work has attempted to unify both worlds for one goal - that is, combining temporal knowledge learned from representation learning with synthetic samples generated from data augmentation to improve temporal robustness.
To summarize, our contributions are: (1) By tackling two levels of data scarcity inherent in EHRs, Multi-TA can build effective early prediction models that are more temporally robust; (2) By integrating a pretrained EHR representation model into the data augmentation process, Multi-TA generates realistic but challenging synthetic time-series data that directly improve temporal robustness; (3) Multi-TA outperforms the baselines on two real-world EHR datasets with various settings for an extremely challenging task.
2 ProposedMethod
Problem Description Our dataset, denoted as Dtrain = {(x1, y1), ..., (xN, yN)}, captures inpatient visits from N different patients, where each visit corresponds to a patient trajectory. The data comprises multivariate irregular time series, with each visit xk being a sequence of events: xk = {x1k , ..., xTk k }, where xtk denotes patient's records at timestamp t and Tk is the number of events in k-th visit, which varies across different visits. Each xtk ∈ RS represents medical data entries collected from clinical measurements at each event, with S being the number of entries. For each visit xk, we have an associated output label yk = {1, 0}, indicating septic shock or non-septic shock, respectively. In addition to the labeled dataset, we leverage an unlabeled dataset Dunlabeled = {x1, ..., xM} for representation learning. This dataset consists of hospital visits that have not been annotated due to budget constraints. The primary objective in early prediction is to learn a prediction function F over Dtrain that best approximates an unknown function f : X → Y , where X represents the true distribution over the entire population. However, when there exists insufficient amount of patient trajectories (small N) in Dtrain or scarce number of events (Tk) that represents each trajectory, it would be difficult to approximate f and temporal robustness cannot be guaranteed.
2.1 Multi-TA: Temporal EHRs Augmentation
We propose Multi-TA, a framework that combines representation learning and data augmentation to address two types of data scarcity. Specifically, as described in Figure 2, MultiTA consists of two stages: (1) Learning EHR representations, which learns the temporal interaction between events within both observation and hold-off window to address event-level data scarcity; (2) Augmenting patient trajectories, which generates sufficiently different synthetic timeseries sequences using constrained worst-case optimization to address trajectory-level data scarcity.
Learning EHR Representations
The goal of this stage is to fill the missing knowledge in the training dataset Dtrain caused by the event-level scarcity. Given that the events within a hold-off window are unknown (refer to Figure 1), the training dataset cannot hold any information from that specific time period, potentially leading to uncertain predictions. In this stage, we utilize the unlabeled dataset Dunlabeled, which spans both observation and hold-off windows, to broaden our knowledge and tackle the eventlevel scarcity.
Step 1: Temporal Abstraction Inspired by [Sohn et al., 2020], we first convert multivariate irregular EHRs into sequences of high-level interval-based concept representations using temporal abstraction [Shahar, 1997], to reduce the random noise inherent in EHRs and implicitly alleviate the effect of irregular time intervals and missing values while preserving temporal information. Specifically, clinical measurements included in the events within each 60 minutes interval are aggregated, and as a result, a visit x = {x1 , ..., xt } composed of t events is transformed into x = {x′1 , ...x′k } in which k < t and x′ = {w1, ...wl} is a list of temporally ordered l abstracted tokens representing a patient health status within each time interval. A token w can be seen as a word concatenating a feature F (e.g., temperature, blood pressure, white blood cell count, etc.) and its state, namely, discretized value V (e.g., low, normal, high, etc.). For example, a token "SystolicBP=H" indicates a certain symptom where systolic blood pressure maintained as high during the time interval. In sum, a visit x can be seen as a document consisting of k events, and an event x′ can be considered as a sentence with l abstracted tokens. The difference between a document in natural language and our visit in EHRs is that ours involves temporal information: (1) temporally ordered token based on the measurement start and end times of each token and (2) time gaps between two consecutive events (x′k-1 , t-hours, x′k ), which could infer hidden knowledge with regard to the progression of a target disease.
Step 2: EHRRepresentation Learning Based on the similarity between our data and texts in natural language, we adopt the original BERT [Devlin et al., 2019] architecture to pretrain EHR representations G. We leverage its ability to understand the context within given sequences, but further, we inject our task-specific temporality into the model. First, we utilize the order of temporally sorted tokens as input to position embeddings to better understand how tokens temporally interact in terms of disease progression. Note that the measurement start and end times can be additionally incorporated in the embeddings, but in this work, we only capture the temporal order. Second, motivated by previous works [Nguyen et al., 2017; Pang et al., 2021] and to fully incorporate temporal aspects of our sequences, we introduce an additional special token ([t-HR]) which represents time intervals between consecutive events. Features (e.g., vital signs) in EHRs are measured irregularly based on their needs and clinicians make such decisions to effectively diagnose patients' conditions and keep track of disease trajectory. That being said, by incorporating time intervals into model training, learned representations could embrace useful information regarding clinicians' practice of measuring patients' conditions. We expect that this would play an important role in understanding the temporal relations between tokens within a visit and benefit the self-attention process inside the BERT framework. In sum, our temporality-injected BERT (t-BERT) utilizes visitlevel input sequences (see Figure 2) that contain (1) the temporal order of each token, which helps the model understand temporal interactions relevant to disease progression, and (2) time gap information between consecutive events, which provides implicit information about patient health status to learn effective EHR representations. Lastly, we inherit "masked language modeling" procedure from the original BERT paper [Devlin et al., 2019] in which the authors mask some percentage of the input tokens at random and then predict those masked tokens based on the encoder output.
Augmenting Patient Trajectories
The second stage of Multi-TA aims to provide sufficient variations of disease progression to a prediction model by augmenting patient trajectories in Dtrain. Motivated by a textual data augmentation work [Sohn and Park, 2022], MultiTA generates synthetic visit sequences that can overcome trajectory-level scarcity with two key steps (see Algorithm 1): (1) constrained worst-case data transformation (lines 5-8), which generates sufficiently different synthetic samples by controlling local changes to a set of selective tokens within a trajectory; (2) robust risk minimization (line 9-11), which interchangeably incorporates newly generated synthetic samples into training.
Step 1: Constrained Worst-Case Data Transformation To provide sufficient variations to a prediction model, we leverage the masked language modeling (MLM) objective [Devlin et al., 2019] for data augmentation, which generates variants of a given sentence by masking and predicting a subset of tokens. However, Multi-TA further optimizes this
- Algorithm 1: Trajectory-level Augmentation Input: Training data Dtrain = {xi, yi}ni=1, pretrained EHRs model G, prediction model F, model weights W, loss function L, learning rate η Parameters : Sampling probability p, transformation level θ, upper bound U Output: Prediction model F with trained weights W 1 Randomly initialize model weights W; 2 while termination criterion not met do 3 Select a random sample pair (x, y) fromDtrain; 4 With probability p: 5 Initialize θ0 ← 0; 6 for i ∈ {1, ..., N} do 7 max θ L(y,F(G(x, θi))), θ ≤ U 8 xθ∗ ← G(x, θ∗ ) 9 W ←W- η∇WL(y,F(xθ∗)) 10 With probability 1-p: 11 W ←W- η∇WL(y,F(x))
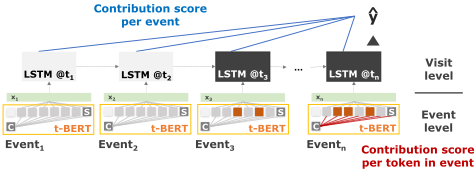
type of local change with a special parameter, transformation level θ that controls the number of tokens and which tokens to transform. By controlling such components, Multi-TA can generate sufficiently different samples, which can mitigate the data scarcity problem. As per line 7 in Algorithm 1, we aim to estimate an optimal θ that can maximize the given prediction model's loss under the upper bound U. This is to generate specific synthetic samples that can maximize the diversity of training dataset at a maximum capacity without any harm (e.g., not flipping its class label). Given the importance of each token in predicting a target disease is different (e.g., a serious condition "WBC=VeryHigh" primarily contributes to the septic shock diagnosis, while other tokens are less important factors), we carefully select tokens to transform aligning with our objective. Specifically, as our goal is to generate a sufficiently different samples with a minimum number of transformations, we select tokens that contribute the most to the target class prediction to quickly maximize the loss value. Note that by selecting the most contributing tokens, instead of the least contributing ones, we can achieve our goal by transforming a minimum number of tokens, and this can prevent the model to generate clinically infeasible samples. Since the MLM predicts a masked token based on its context, if there exist a large number of masked tokens and only a few real tokens are left in context, it would be difficult to reconstruct and form a realistic sequence. However, it is non-trivial to directly calculate token-level contribution scores as EHRs are a multilevel structure similar to documents and we apply sequential model such as LSTM on top (one cell per event) and tBERT on the second level. Figure 3 illustrates our prediction model and the way to calculate token-level contributions in two steps. First, we determine visit-level contribution scores using gradient attribution [Simonyan et al., 2014], that is, calculating the gradient per event and normalize across events to identify top θ ∗ n events in terms of the score, where n is the number of event in a visit. Second, once target events are selected, we use the attention scores of tokens with respect to a special token ([CLS]) as contribution scores, within each selected event. As the [CLS] token contains all information collected from other tokens in a sequence and the token is often used as input for various classification tasks, we assume that the attention scores would represent the contribution level of tokens. Based on the per event token-level scores, we select top θ ∗ l contributing tokens per event where l is the number of tokens in an event. Once the tokens in the chosen events are replaced with [MASK] tokens and all the events in a visit are concatenated to form a visit sequence, a pretrained representation model G predicts the tokens based on the context to generate a realistic visit sequence. At the end of the process, the transformed sequence with the estimated theta is added to the training dataset to update the model weights.
Step 2: Robust RiskMinimization Multi-TA actively and interchangeably generates informative samples and uses them to strengthen a prediction model during each epoch of training. Specifically, this step is analogous to the regular stochastic gradient descent of any differentiable prediction models (lines 9 and 11). Given either the original training samples or transformed samples and their corresponding class labels, Multi-TA updates the model parameters W based on the gradient computed and the learning rate η.
3 Experiment Setup
3.1 Two EHRDatasets
We utilize two real-world EHR datasets collected from 210,289 and 106,844 adult patient visits to Christiana Care Health System (CCHS) and Mayo Clinic (Mayo), respectively. Both datasets comprise 2.5 years (07/2013-12/2015) of anonymized and institutional review board (IRB)-approved EHRs. From the total population, 52,919 visits and 4,224,567 events are selected as our study population to only include the patients with suspected infection, based on the rules designed by the two leading clinicians with extensive experience. Time irregularity and data sparsity are the two major challenges inherent in our datasets. In the study population, time intervals vary from 0.94 seconds to 64.38 hours due to the different measuring frequencies of features, and this causes data sparsity where on average more than 80% of the values are missing. The EHRs from two hospital systems differ in several ways, but the distinct measuring frequencies make the most difference in learning temporal dynamics of EHRs. Compared to Mayo, where the majority of measurements (82%) are carried out within every 1 hour, CCHS measures less frequently - i.e. more distributed time intervals: 1-hour (39%), 2-hour (20%). In addition, to ensure a balanced dataset and avoid bias, we truncated samples from the negative class (non-septic shock) at each prediction hour. We opted not to utilize ICU benchmark datasets such as MIMIC-III and PhysioNet based on our preliminary experiments, which revealed no performance deterioration over time (AUC: 0.961 for 24-hour prediction, 0.980 for 48-hour) and demonstrated near-perfect performance. We believe that this is because of MIMIC-III's higher-quality continuous monitoring, typical of ICUs, which introduces a different type of problem.
3.2 Model Evaluation
We validate our framework in two stages: comparing t-BERT with three representation models for multivariate time-series EHRs, and assessing Multi-TA against mixup and GAN-based augmentation methods. We utilize LSTM for prediction, except with CEHR-GAN-BERT, due to its ability to capture long-term dependencies.
Task Setup Our task involves predicting the onset of septic shock in a patient m hours after receiving their last n hours of Notes: Best results for section are in bold and the best overall results have asterisk. (RL: representation learning, DA: data augmentation)
| Setting | Model | Accuracy | Precision | Recall | F1-Score | AUC |
|---|---|---|---|---|---|---|
| CCHS + RL | EHR MuLan BERT t-BERT (Ours) | 0.706(±.027) 0.748(±.017) 0.789(±.030) 0.821(±.021) | 0.706(±.021) 0.739(±.026) 0.771(±.039) 0.825(±.017) | 0.705(±.044) 0.769(±.040) 0.826(±.020) 0.816(±.041) | 0.705(±.031) 0.753(±.018) 0.797(±.023) 0.820(±.025) | 0.777(±.044) 0.832(±.020) 0.870(±.013) 0.900(±.009) |
| CCHS + DA | EHR+mixup t-BERT+M.Mixup t-BERT+GAN Multi-TA (Ours) | 0.727(±.033) 0.797(±.025) 0.829(±.018) 0.837*(±.010) | 0.737(±.035) 0.784(±.032) 0.800(±.055) 0.828*(±.033) | 0.711(±.097) 0.824(±.057) 0.888*(±.066) 0.854(±.039) | 0.720(±.047) 0.802(±.028) 0.838(±.012) 0.840*(±.009) | 0.796(±.037) 0.884(±.029) 0.829(±.019) 0.909*(±.008) |
| MAYO + RL | EHR MuLan BERT t-BERT (Ours) | 0.697(±.049) 0.680(±.016) 0.771±.017) 0.789(±.015) | 0.682(±.043) 0.648(±.028) 0.744(±.026) 0.769(±.028) | 0.729(±.144) 0.774(±.081) 0.820(±.077) 0.820(±.054) | 0.697(±.079) 0.703(±.024) 0.778(±.027) 0.792(±.019) | 0.768(±.055) 0.759(±.022) 0.852(±.021) 0.869(±.013) |
| MAYO + DA | EHR+mixup t-BERT+M.Mixup t-BERT+GAN Multi-TA (Ours) | 0.689(±.038) 0.774(±.016) 0.782(±.026) 0.801*±.010) | 0.705(±.084) 0.755(±.038) 0.759(±.051) 0.777*(±.010) | 0.668(±.081) 0.808(±.041) 0.825(±.047) 0.836*(±.016) | 0.679(±.025) 0.779(±.007) 0.789(±.020) 0.806*(±.011) | 0.770(±.031) 0.857(±.006) 0.783(±.026) 0.871*(±.012) |
medical records. Here, m ranges from 6 to 48 hours, based on input from clinicians. Shock visits are aligned to their initial onset, while non-shock visits are truncated accordingly. Nonshock visits are further balanced to match the length distribution of shock visits. Given sepsis's rapid progression, our analysis focuses on the initial five days of patient records.
RepresentationModels (1) EHR, raw (continuous) EHRs with the expert rule-based imputation [Kim and Chi, 2018]; (2) MuLan [Sohn et al., 2020], Skipgram-based static model which takes temporally abstracted visit sequences without time gap information; (3) BERT [Li et al., 2020], BERTbased contextualized model which takes MuLan's input; (4) t-BERT (Ours), BERT-based model that incorporates taskspecific temporal information into training.
Data Augmentation Models (1) mixup [Zhang et al., 2018], linear interpolation-based augmentation; (2) Manifold Mixup (M.Mixup) [Verma et al., 2019], variation of mixup, which combines intermediate vector representations; (3) CEHR-GAN-BERT (GAN) [Poulain et al., 2022], GANbased data augmentation approach which utilizes EHR representation model CEHR-BERT [Pang et al., 2021]. For a fair comparison, we substituted t-BERT for CEHR-BERT; (4) Multi-TA (Ours), our proposed EHRs augmentation algorithm which controls transformation level to generate sufficiently different but informative samples to predictions.
Evaluation Strategy We measure model temporal robustness using two evaluation methods: (1) Raw prediction performance is evaluated using five metrics (accuracy, precision, recall, F1-score, and AUC) with a focus on F1 and AUC due to their balanced measure; (2) For lower-bound performance, we identify the lowest performance across all prediction hours, denoted as -LB. A more temporally robust model exhibits higher lower-bound performance. In addition, we report the mean and standard deviation of model performance from six experimental trials (three repetitions for two-fold stratified cross-validation) with critical differences [Benavoli et al., 2016] between models. Hyperparameters, such as p and U, are chosen based on the validation performance.
Evaluation Sets (Regular vs. Robust) We use two test sets to gauge the model's sensitivity to changes in training data size. "Regular" is a commonly used test set for early prediction, in which the numbers of patients in training, validation, and test sets decrease as prediction hour n increases. "Robust" uses the same group of patients across varying prediction hours for model evaluation, in which only the number of training and validation data changes.
4 Result and Discussion
We present two experimental results. 48 hours early prediction reveals the model's static robustness while 6-48 hours prediction uncovers the temporal robustness of the model.
4.1 48 Hours Early Prediction
Representation Models Table 1 (RL sections) shows the performance for four representation models. Firstly, BERT consistently outperforms EHR and MuLan on every metric across both datasets, with approximately a 10% increase in F1 and AUC for both (9.3% of AUC increase in CCHS). This demonstrates BERT's effectiveness in learning contextualized and subtle information inherent in EHRs. Moreover, our proposed t-BERT outperforms BERT and exhibits lower variance across metrics and datasets, except for recall in CCHS. This suggests that incorporating time intervals into training enhances understanding of temporal dynamics in patient trajectories. Notably, the performance improvement fromBERT to t-BERT is more pronounced in CCHS (AUC increase: 3% in CCHS, 1.7% in Mayo), indicating that t-BERT may be more effective on more irregularly measured EHRs.
Data AugmentationModels Table 1 (DA sections) reveals the experiment result for four data augmentation models. Data augmentation models shows mixed results when compared to their counterparts, either EHR or t-BERT. While mixup applied to EHR slightly improves the model performance (AUC increase: 1.9% in CCHS, 0.2% in MAYO), M.Mixup and GAN applied to t-BERT rather degrade the performance in most cases. We hypothesize that this underperformance is derived from their architectural design in which (1) they generate intermediate latent vector representations for augmentation, which may only contain condensed information instead of actual visit sequences; (2) they generate representations without conditioning on class labels and regardless of prediction objective. Furthermore, GAN does not capture temporal dependencies between events due to the lack of LSTM layer and rather depends on its BERT model to capture the information. On the other hand, our proposed Multi-TA consistently outperforms the other models across all metrics and datasets except for recall in CCHS, where GAN performs the best with 88.8%. Further, Multi-TA shows smaller variance than others, demonstrating its robustness to the data changes. This validates the efficacy of optimizing transformation levels in relation to a target prediction task.
4.2 6-48 Hours Early Prediction
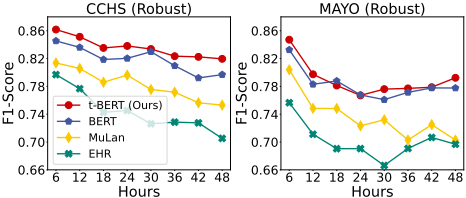
Representation Models Figure 4 shows the model performance (F1) in the robust setting across varying hold-off window sizes, ranging from 6 to 48 hours at 6-hour intervals. The plots exhibit consistent patterns across both datasets: (1) t-BERT outperforms baseline models across different hours, except for 18 hours with Mayo data; (2) t-BERT maintains stable performance from 6 to 48 hours, showing minimal performance decline and indicating robustness to training data Notes: Best results for section are in bold and the best overall results have asterisk. (RL: representation learning, DA: data augmentation)
| Setting | Model | F1 | AUC | F1-LB | AUC-LB |
|---|---|---|---|---|---|
| CCHS + Regular + RL | EHR MuLan BERT t-BERT (Ours) | 0.762(±.016) 0.803(±.008) 0.838(±.006) 0.851(±.007) | 0.831(±.020) 0.879(±.006) 0.909(±.006) 0.925(±.005) | 0.705(±.031) 0.753(±.018) 0.791(±.020) 0.821±.016) | 0.777(±.044) 0.832(±.020) 0.868(±.022) 0.894±.008) |
| CCHS + Regular + DA | EHR+mixup t-BERT+M.Mixup t-BERT+GAN Multi-TA (Ours) | 0.772(±.040) 0.846(±.043) 0.844(±.005) 0.867*(±.005) | 0.846(±.041) 0.915(±.035) 0.836(±.005) 0.936*(±.004) | 0.720(±.047) 0.802(±.028) 0.812(±.012) 0.833*(±.018) | 0.796(±.037) 0.876±.011) 0.796(±.033) 0.907*(±.007) |
| CCHS + Robust + RL | EHR MuLan BERT t-BERT (Ours) | 0.744(±.020) 0.782(±.014) 0.819(±.009) 0.836(±.008) | 0.823(±.026) 0.864(±.008) 0.898(±.009) 0.915(±.005) | 0.705(±.031) 0.753(±.018) 0.792(±.021) 0.822(±.016) | 0.777(±.044) 0.832(±.020) 0.873(±.020) 0.897(±.008) |
| CCHS + Robust + DA | EHR+mixup t-BERT+M.Mixup t-BERT+GAN Multi-TA (Ours) | 0.744(±.020) 0.823(±.025) 0.817(±.013) 0.848*(±.008) | 0.832(±.030) 0.902(±.024) 0.818(±.010) 0.926*(±.004) | 0.720(±.047) 0.801(±.034) 0.775(±.046) 0.834*(±.021) | 0.796(±.037) 0.878(±.010) 0.798(±.027) 0.911*(±.006) |
| MAYO + Regular + RL | EHR MuLan BERT t-BERT (Ours) | 0.736(±.023) 0.765(±.004) 0.810(±.007) 0.814(±.005) | 0.784(±.021) 0.816(±.005) 0.876(±.003) 0.883(±.004) | 0.697(±.023) 0.703(±.024) 0.779(±.011) 0.779(±.005) | 0.727(±.019) 0.759(±.022) 0.845(±.010) 0.849(±.013) |
| MAYO + Regular + DA | EHR+mixup t-BERT+M.Mixup t-BERT+GAN Multi-TA (Ours) | 0.743(±.048) 0.821(±.045) 0.807(±.004) 0.829*(±.008) | 0.796(±.046) 0.884(±.040) 0.794(±.004) 0.891*(±.003) | 0.679(±.025) 0.779(±.007) 0.771(±.027) 0.790*(±.018) | 0.756(±.036) 0.855(±.008) 0.772(±.018) 0.865*(±.005) |
| MAYO + Robust + RL | EHR MuLan BERT t-BERT (Ours) | 0.701(±.031) 0.736(±.009) 0.782(±.013) 0.790(±.013) | 0.768(±.028) 0.801(±.007) 0.860(±.006) 0.869(±.006) | 0.666 (±.045) 0.703(±.024) 0.768(±.011) 0.767(±.011) | 0.740(±.030) 0.759(±.022) 0.838(±.004) 0.849(±.007) |
| MAYO + Robust + DA | EHR+mixup t-BERT+M.Mixup t-BERT+GAN Multi-TA (Ours) | 0.706(±.017) 0.795(±.031) 0.770(±.006) 0.803*(±.011) | 0.777(±.022) 0.868(±.032) 0.769(±.012) 0.875*(±.004) | 0.679 (±.025) 0.767(±.014) 0.742(±.012) 0.779*(±.020) | 0.763(±.060) 0.836(±.010) 0.753(±.012) 0.851*(±.006) |
scarcity. Similar to 48-hour prediction, the biggest performance gap is observed between EHR/MuLan and BERT, emphasizing the importance of capturing contextual information in EHRs. The consistent improvement from BERT to t-BERT reveals the significance of incorporating time gap signals to comprehend temporal dynamics of disease trajectories. Table 2 (RL sections) presents detailed model performance for both settings and lower-bound metrics that measure the worst performance over time. Firstly, compared to the regular setting, the robust setting exhibits slightly lower performance. We hypothesize that the patient group in the robust setting may pose greater challenges possibly due to vague symptoms. Secondly, t-BERT consistently performs better with CCHS across all metrics, as observed in Figure 5. This underscores the significance of modeling time irregularity in disease early prediction and highlights the effectiveness of our proposed t-BERT. Lastly, t-BERT outperforms other models in all settings including robust and lower-bound metrics, establishing it as the most temporally-robust among RL models.
Notes: Models with no statistical difference (P≥.05) are linked.
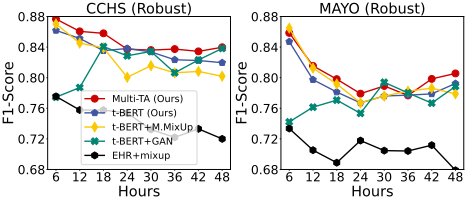
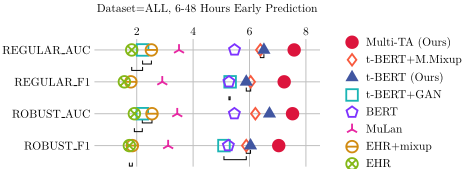
Data Augmentation Models Figure 5 compares F1-scores for data augmentation models in the robust setting, where Multi-TA demonstrates more stable and superior performance over time compared to others. Specifically, GAN exhibits unstable performance, degrading even with more training data (as hour n decreases), highlighting its ineffectiveness in ensuring temporal robustness. M.Mixup produces relatively stable predictions and performs better than t-BERT on Mayo, but its inconsistent performance across varying prediction hours and datasets suggests sensitivity to changes. In contrast, Multi-TA consistently improves performance over time with its target-oriented sample generation, even when n is large and training data is the scarcest. Table 2 (DA sections) underscores the temporal robustness of the four data augmentation models. Across eight prediction hours, Multi-TA outperforms other models consistently, with higher lower-bound scores (F1-LB and AUC-LB), indicating greater reliability, especially for early prediction tasks. Finally, Figure 6 demonstrates that Multi-TA significantly outperforms other models.
4.3 Analysis of Data Augmentation
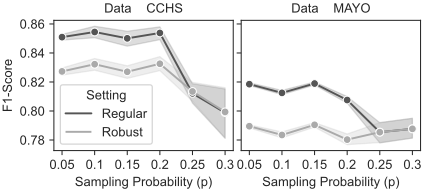
Quantity of Data Multi-TA determines optimal data augmentation levels. Unlike methods that assumes more random data enhances model performance, our approach augments training data specifically tailored to the current model by adding fewer samples. Specifically, a sampling probability p in Algorithm 1 controls the augmented dataset size efficiently. Figure 7 addresses the question of "how many new samples are sufficient?" and demonstrates that excessive data addition (≥ 0.25) rather harms performance.
Quality of Data Multi-TA optimizes the quality of augmented data by determining the optimal transformation level θ to maximize diversity. For example, larger θ values indicate more extensive token transformation, increasing distance from the original sample. Figure 8 (left) displays the distributions of estimated θ values for both datasets, which are neither uniform nor skewed, showing Multi-TA's ability to adaptively set transformation levels for target datasets and prediction models, unlike fixed or random approaches.
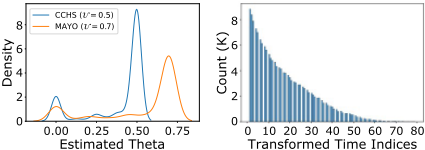
Transformation, Where? By design, Multi-TA transforms most contributing time steps within a visit. Figure 8 (right) shows the distribution of the indices of transformed time steps on its x-axis, and we denote the most recent time step as 0. As expected, the results show that more recent time steps (which are close to 0) were transformed more, indicating that they contributed more to predictions and increasing diversity.
5 RelatedWork
Representation Learning for EHRs Given the significance of contextualized vector representations, [Richardson et al., 2020; Tonelli et al., 2018], BERT [Devlin et al., 2019] has gained widespread adoption for EHRs, including variants like BEHRT [Li et al., 2020] incorporating patient ages to imply temporal code orders, G-BERT [Shang et al., 2019] enhancing clinical context with a graph neural network, Med-BERT [Rasmy et al., 2021] utilizing domain-specific pretraining and a large dataset (20M patients), and CEHRBERT [Pang et al., 2021], akin to our t-BERT, training a temporal BERT with visit type prediction and time-indicative tokens. Despite these advancements, prior works may not effectively capture rapid disease progression like sepsis due to discrete and coarse-grained medical codes [Lee et al., 2020], nor address temporal robustness in early prediction tasks. While recent advances in Large Language Models (LLMs) offer promising capabilities for learning representations from medical corpora [Singhal et al., 2023], their application to specialized tasks like septic shock prediction remains limited.
DataAugmentation for EHRs While time-series data augmentation shows promise [Wen et al., 2021; Iglesias et al.,
2023], deep learning-based methods for healthcare prediction remain limited. Firstly, simple yet effective linear interpolation techniques like mixup [Zhang et al., 2018] and Manifold Mixup [Verma et al., 2019] can augment both continuous and discrete inputs by combining a pair of training samples, and the generated samples act as a regularization that enhances model robustness. Secondly, GAN-based approaches are divided into two groups: (1) generation-focused models for preserving privacy in data [Mogren, 2016; Choi et al., 2017b; Esteban et al., 2017; Yoon et al., 2019; Baowaly et al., 2019; Li et al., 2021]; (2) prediction-focused model with semisupervised learning [Che et al., 2017; Yu et al., 2019; Cui et al., 2020], but both approaches have not shown their effectiveness in improving temporal robustness for early disease prediction. CEHR-GAN-BERT [Poulain et al., 2022] shares similarities with our approach by integrating a EHR representation model with a discriminator for robust predictions. However, it lacks capturing temporal dependencies and generates only unlabeled vector representations.
6 Limitations and FutureWork
Time Complexity Multi-TA's iterative transformation process increases training time. Training for 48-hour early prediction spans around 3-min for EHR, 7-min for t-BERT, and 100-min for Multi-TA. We expect enhanced efficiency with parallel processing like distributed optimization.
BERT as a Transformation Function When the majority of tokens in a visit is masked, it is challenging for BERT to fill in the spots due to the lack of context. However, we expect that causal language models such as GPTs can address this issue and generate more diverse and creative patient trajectories.
Comparison with Existing Approaches Multi-TA has not yet been comprehensively compared to other existing methods for septic shock prediction or handling time gap information [Ma et al., 2020; Wei et al., 2023]. We plan to conduct further experiments to facilitate a comparative analysis.
Binary Prediction We followed established literature precedents [Gao et al., 2022; Yang et al., 2023; Fleuren et al., 2020; Yan et al., 2022], which use binary prediction models with manually designated windows up to 48-hour. Yet, we admit that a regression model capable of predicting the exact onset hour would significantly benefit healthcare providers.
7 Conclusion
Accurate early disease predictions face challenges due to inherent data scarcity at trajectory and event levels. This paper introduces Multi-TA, a unified temporal augmentation framework, which addresses these challenges by integrating EHR representation learning with data augmentation. Multi-TA mitigates event-level scarcity by learning temporal dynamics from unlabeled events and enhances trajectory diversity by generating new samples via constrained worst-case transformations. Experiment results on two real-world EHR datasets reveal the temporal robustness of Multi-TA compared to various state-of-the-art models, affirming its efficacy in improving early prediction for enhanced clinical decision-making.
Acknowledgments
This research was supported by the NSF Grants: #1726550, #1651909, and #2013502.
@inproceedings{ijcai2024p667,
  title     = {Multi-TA: Multilevel Temporal Augmentation for Robust Septic Shock Early Prediction},
  author    = {Sohn, Hyunwoo and Park, Kyungjin and Park, Baekkwan and Chi, Min},
  booktitle = {Proceedings of the Thirty-Third International Joint Conference on
               Artificial Intelligence, {IJCAI-24}},
  publisher = {International Joint Conferences on Artificial Intelligence Organization},
  editor    = {Kate Larson},
  pages     = {6035--6043},
  year      = {2024},
  month     = {8},
  note      = {Main Track},
  doi       = {10.24963/ijcai.2024/667},
  url       = {https://doi.org/10.24963/ijcai.2024/667},
}
TY - CPAPER TI - Multi-TA: Multilevel Temporal Augmentation for Robust Septic Shock Early Prediction AU - Sohn, Hyunwoo AU - Park, Kyungjin AU - Park, Baekkwan AU - Chi, Min T2 - Proceedings of the Thirty-Third International Joint Conference on Artificial Intelligence, IJCAI-24 PB - International Joint Conferences on Artificial Intelligence Organization PY - 2024 SP - 6035 EP - 6043 DO - 10.24963/ijcai.2024/667 UR - https://doi.org/10.24963/ijcai.2024/667 ER -Copied
Machine-readable versions of this paper, for tools and AI agents:





