
Clustering Financial Time Series: How Long Is Enough?
Proceedings of the Twenty-Fifth International Joint Conference on Artificial Intelligence. Pages 2583-2588.
Abstract
Researchers have used from 30 days to several years of daily returns as source data for clustering financial time series based on their correlations. This paper sets up a statistical framework to study the validity of such practices. We first show that clustering correlated random variables from their observed values is statistically consistent. Then, we also give a first empirical answer to the much debated question: How long should the time series be? If too short, the clusters found can be spurious; if too long, dynamics can be smoothed out.
- [Ao et al., 2005] Sio Iong Ao, Kevin Yip, Michael Ng, David Cheung, Pui-Yee Fong, Ian Melhado, and Pak C Sham. Clustag: hierarchical clustering and graph methods for selecting tag snps. Bioinformatics, 21(8):1735-1736, 2005.
- [Balakrishnan et al., 2011] Sivaraman Balakrishnan, Min Xu, Akshay Krishnamurthy, and Aarti Singh. Noise thresholds for spectral clustering. In Advances in Neural Information Processing Systems, pages 954-962, 2011.
- [Basalto et al., 2007] Nicolas Basalto, Roberto Bellotti, Francesco De Carlo, Paolo Facchi, Ester Pantaleo, and Saverio Pascazio. Hausdorff clustering of financial time series. Physica A: Statistical Mechanics and its Applica- tions, 379(2):635-644, 2007.
- [Bien and Tibshirani, 2011] Jacob Bien and Robert Tibshi- rani. Hierarchical clustering with prototypes via minimax linkage. Journal of the American Statistical Association, 106(495):1075-1084, 2011.
- [Borysov et al., 2014] Petro Borysov, Jan Hannig, and JS Marron. Asymptotics of hierarchical clustering for growing dimension. Journal of Multivariate Analysis, 124:465-479, 2014.
- [Chen and Van Ness, 1996] Zhenmin Chen and John W Van Ness. Space-conserving agglomerative algorithms. Journal of classification, 13(1):157-168, 1996.
- [Cont, 2001] Rama Cont. Empirical properties of asset re- turns: stylized facts and statistical issues. 2001.
- [Han and Liu, 2013] Fang Han and Han Liu. Optimal rates of convergence for latent generalized correlation matrix estimation in transelliptical distribution. arXiv preprint arXiv:1305.6916, 2013.
- [Hartigan, 1981] John A Hartigan. Consistency of single linkage for high-density clusters. Journal of the American Statistical Association, 76(374):388-394, 1981.
- [Hu and Kercheval, 2010] Wenbo Hu and Alec N Kercheval. Portfolio optimization for student t and skewed t returns. Quantitative Finance, 10(1):91-105, 2010.
- [Katsavounidis et al., 1994] Ioannis Katsavounidis, C-C Jay Kuo, and Zhen Zhang. A new initialization technique for generalized Lloyd iteration. Signal Processing Letters, IEEE, 1(10):144-146, 1994.
- [Khaleghi et al., 2012] Azadeh Khaleghi, Daniil Ryabko, Jérémie Mary, and Philippe Preux. Online clustering of processes. In International Conference on Artificial Intel- ligence and Statistics, pages 601-609, 2012.
- [Kleinberg, 2003] Jon Kleinberg. An impossibility theorem for clustering. Advances in neural information processing systems, pages 463-470, 2003.
- [Krishnamurthy et al., 2012] Akshay Krishnamurthy, Sivaraman Balakrishnan, Min Xu, and Aarti Singh. Efficient active algorithms for hierarchical clustering. International Conference on Machine Learning, 2012.
- [Liu et al., 2012a] Han Liu, Fang Han, Ming Yuan, John Lafferty, Larry Wasserman, et al. High-dimensional semi- parametric gaussian copula graphical models. The Annals of Statistics, 40(4):2293-2326, 2012.
- [Liu et al., 2012b] Han Liu, Fang Han, and Cun-hui Zhang. Transelliptical graphical models. In Advances in Neural Information Processing Systems, pages 809-817, 2012.
- [Mantegna and Stanley, 1999] Rosario N Mantegna and H Eugene Stanley. Introduction to econophysics: corre- lations and complexity in finance. Cambridge university press, 1999.
- [Mantegna, 1999] Rosario N Mantegna. Hierarchical struc- ture in financial markets. The European Physical Journal B-Condensed Matter and Complex Systems, 11(1):193- 197, 1999.
- [Marti et al., 2015] Gautier Marti, Philippe Very, Philippe Donnat, and Frank Nielsen. A proposal of a methodologi- cal framework with experimental guidelines to investigate clustering stability on financial time series. In 14th IEEE International Conference on Machine Learning and Appli- cations, ICMLA 2015, Miami, FL, USA, December 9-11, 2015, pages 32-37, 2015.
- [Murtagh and Contreras, 2012] Fionn Murtagh and Pedro Contreras. Algorithms for hierarchical clustering: an overview. Wiley Interdisciplinary Reviews: Data Mining and Knowledge Discovery, 2(1):86-97, 2012.
- [Pollard and others, 1981] David Pollard et al. Strong con- sistency of k-means clustering. The Annals of Statistics, 9(1):135-140, 1981.
- [Ryabko, 2010] D. Ryabko. Clustering processes. In Proc. the 27th International Conference on Machine Learning (ICML 2010), pages 919-926, Haifa, Israel, 2010.
- [Terada, 2013] Yoshikazu Terada. Strong consistency of fac- torial k-means clustering. Annals of the Institute of Statis- tical Mathematics, 67(2):335-357, 2013.
- [Terada, 2014] Yoshikazu Terada. Strong consistency of re- duced k-means clustering. Scandinavian Journal of Statis- tics, 41(4):913-931, 2014.
- [Tola et al., 2008] Vincenzo Tola, Fabrizio Lillo, Mauro Gal- legati, and Rosario N Mantegna. Cluster analysis for port- folio optimization. Journal of Economic Dynamics and Control, 32(1):235-258, 2008.
- [Tropp, 2015] Joel A Tropp. An introduction to matrix con- centration inequalities. arXiv preprint arXiv:1501.01571, 2015.
- [Tumminello et al., 2007] Michele Tumminello, Fabrizio Lillo, and Rosario N Mantegna. Kullback-leibler distance as a measure of the information filtered from multivariate data. Physical Review E, 76(3):031123, 2007.
- [Von Luxburg et al., 2008] Ulrike Von Luxburg, Mikhail Belkin, and Olivier Bousquet. Consistency of spectral clustering. The Annals of Statistics, pages 555-586, 2008.
References were extracted automatically from the PDF and may contain errors.
Full text extracted automatically from the PDF; figures, tables and equations may differ. The PDF is the version of record.
1 Introduction
Clustering can be informally described as the task of grouping objects in subsets (also named clusters) in such a way that objects in the same cluster are more similar to each other than those in different clusters. Since the clustering task is notably hard to formalize [Kleinberg, 2003], designing a clustering algorithm that solves it perfectly in any cases seems farfetched. However, under strong mathematical assumptions made on the data, desirable properties such as statistical consistency, i.e. more data means more accuracy and in the limit a perfect solution, have been shown: Starting from Hartigan's proof of Single Linkage [Hartigan, 1981] and Pollard's proof of k-means consistency [Pollard and others, 1981] to recent work such as the consistency of spectral clustering [Von Luxburg et al., 2008], or modified k-means [Terada, 2013; 2014]. These research papers assume that N data points are independently sampled from an underlying probability distribution in dimension T fixed. Clusters can be seen as regions of high density. They show that in the large sample limit, N ! 1, the clustering sequence constructed by the given algorithm converges to a clustering of the whole underlying space. When we consider the clustering of time series, another asymptotics matter: N fixed and T ! 1. Clusters gather objects that behave similarly through time. To the best of our knowledge, much fewer researchers have dealt with this asymptotics: [Borysov et al., 2014] show the consistency of three hierarchical clustering algorithms when dimension T is growing to correctly gather N = n+m observations from a mixture of two T dimensional Gaussian distributions N(θ1↪ σ2 1 IT ) and N(θ2↪ σ2 2 IT ). [Ryabko, 2010;
Khaleghi et al., 2012] prove the consistency of k-means for clustering processes according to their distribution. In this work, motivated by the clustering of financial time series, we will instead consider the consistency of clustering N random variables from their T observations according to their observed correlations.
For financial applications, clustering is usually used as a building block before further processing such as portfolio selection [Tola et al., 2008]. Before becoming a mainstream methodology among practitioners, one has to provide theoretical guarantees that the approach is sound. In this work, we first show that the clustering methodology is theoretically valid, but when working with finite length time series extra care should be taken: Convergence rates depend on many factors (underlying correlation structure, separation between clusters, underlying distribution of returns) and implementation choice (correlation coefficient, clustering algorithm). Since financial time series are thought to be approximately stationary for short periods only, a clustering methodology that requires a large sample to recover the underlying clusters is unlikely to be useful in practice and can be misleading. In section 5, we illustrate on simulated time series the empirical convergence rates achieved by several clustering approaches.
Notations
- ÷ X1↪ ▷ ▷ ▷ ↪XN univariate random variables
- ÷ X(t) i is the tth sorted observation of Xi
- ÷ Xt i is the tth observation of variable Xi
- ÷ FX is the cumulative distribution function of X
- ÷ dij = d(Xi↪Xj) distance between Xi↪Xj
- ÷ ⇢ij = ⇢(Xi↪Xj) correlation between Xi↪Xj
- ÷ Dij = D(Ci↪ Cj) distance between clusters Ci↪ Cj
- ÷ C (k) (Xi) denotes the cluster of Xi in partition Pk
- ÷ Pk = ¶C (k) 1 ↪ ▷ ▷ ▷ ↪C (k) lk ♦ is a partition of X1↪ ▷ ▷ ▷ ↪XN
- ÷ k⌃k1 =maxij ⌃ij
- ÷ X = Op(k) means X◁k is stochastically bounded, i.e. 8" > 0↪ 9M > 0↪ P (♣X◁k♣ > M) < ".
2 The Hierarchical Correlation BlockModel
2.1 Stylized facts about financial time series
Since the seminal work in [Mantegna, 1999], it has been verified several times for different markets (e.g. stocks, forex, credit default swaps [Marti et al., 2015]) that price time series of traded assets have a hierarchical correlation structure. Another well-known stylized fact is the non-Gaussianity of daily asset returns [Cont, 2001]. These empirical properties motivate both the use of alternative correlation coefficients described in section 2.2 and the definition of the Hierarchical Correlation Block Model (HCBM) presented in section 2.3.
2.2 Dependence and correlation coefficients
The most common correlation coefficient is the Pearson correlation coefficient defined by
which can be estimated by
where X = 1 T PTt=1 Xt is the empirical mean of X. This coefficient suffers from several drawbacks: it only measures linear relationship between two variables; it is not robust to noise and may be undefined if the distribution of one of these variables have infinite second moment. More robust correlation coefficients are copula-based dependence measures such as Spearman's rho
and its statistical estimate
These correlation coefficients are robust to noise (since rank statistics normalize outliers) and invariant to monotonous transformations of the random variables (since copula-based measures benefit from the probability integral transform FX(X) ⇠ U[0↪ 1]).
2.3 The HCBMmodel
We assume that the N univariate random variables X1↪ ▷ ▷ ▷ ↪ XN follow a Hierarchical Correlation Block Model (HCBM). This model consists in correlation matrices having a hierarchical block structure [Balakrishnan et al., 2011], [Krishnamurthy et al., 2012]. Each block corresponds to a correlation cluster that we want to recover with a clustering algorithm. In Fig. 1, we display a correlation matrix from the HCBM. Notice that in practice one does not observe the hierarchical block diagonal structure displayed in the left picture, but a correlation matrix similar to the one displayed in the right picture which is identical to the left one up to a permutation of the data. The HCBM defines a set of nested partitions P = ¶P0 ◆ P1 ◆ ▷ ▷ ▷ ◆ Ph♦ for some h 2 [1↪ N], where P0 is the trivial partition, the partitions Pk = ¶C (k) 1 ↪ ▷ ▷ ▷ ↪C (k) lk ♦, and Flk i=1 C (k) i = ¶X1↪ ▷ ▷ ▷ ↪XN♦. For all 1 k h, we define ⇢k and ⇢k such that for all 1 i↪ j N, we have ⇢k ⇢ij ⇢k when C (k) (Xi) = C (k) (Xj) and C (k+1) (Xi) 6= C (k+1) (Xj), i.e. ⇢k and ⇢k are the minimum and maximum correlation respectively within all the clusters C (k) i in the partition Pk at depth k. In order to have a proper nested correlation hierarchy, we must have ⇢k < ⇢k+1 for all k. Depending on the context, it can be a Spearman or Pearson correlation matrix.
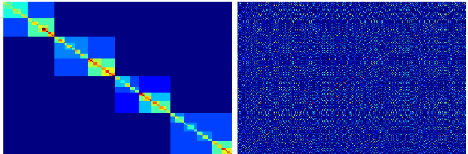
Without loss of generality and for ease of demonstration we will consider the one-level HCBM with K blocks of size n1↪ ▷ ▷ ▷ ↪ nK such that PKi=1 ni = N. We explain later how to extend the results to the general HCBM. We also consider the associated distance matrix d, where dij = 1-⇢ij 2 . In practice, clustering methods are applied on statistical estimates of the distance matrix d, i.e. on ˆ dij = dij +✏ij , where ✏ij are noises resulting from the statistical estimation of correlations.
3 Clustering methods
3.1 Algorithms of interest
Many paradigms exist in the literature for clustering data. We consider in this work only hard (in opposition to soft) clustering methods, i.e. algorithms producing partitions of the data (in opposition to methods assigning several clusters to a given data point). Within the hard clustering family, we can classify for instance these algorithms in hierarchical clustering methods (yielding nested partitions of the data) and flat clustering methods (yielding a single partition) such as k-means.
We will consider the infinite Lance-Williams family which further subdivides the hierarchical clustering since many of the popular algorithms such as Single Linkage, Complete Linkage, Average Linkage (UPGMA), McQuitty's Linkage (WPGMA), Median Linkage (WPGMC), Centroid Linkage (UPGMC), and Ward's method are members of this family (cf. Table 1 [Murtagh and Contreras, 2012]). It will allow us a more concise and unified treatment of the consistency proofs for these algorithms. Interesting and recently designed hierarchical agglomerative clustering algorithms such as Hausdorff Linkage [Basalto et al., 2007] and Minimax Linkage [Ao et al., 2005] do not belong to this family [Bien and Tibshirani, 2011], but their linkage functions share a convenient property for cluster separability.
| D(Ci [ Cj ↪ Ck) | = ↵iDik + ↵i | ↵jDjk + βDij + γ♣Dik β | - Djk♣ γ |
|---|---|---|---|
| Single | 1/2 | 0 | -1/2 |
| Complete | 1/2 | 0 | 1/2 |
| Average | ♣Ci ♣ ♣Ci ♣+♣Cj ♣ | 0 | 0 |
| McQuitty | 1/2 | 0 | 0 |
| Median | 1/2 | -1/4 | 0 |
| Centroid | ♣Ci ♣ ♣Ci♣+♣Cj♣ | - ♣Ci♣♣Cj♣ (♣Ci ♣+♣Cj ♣)2 | 0 |
| Ward | ♣Ci ♣+♣Ck ♣ | - ♣Ck♣ | 0 |
3.2 Separability conditions for clustering
In our context the distances between the points we want to cluster are random and defined by the estimated correlations. However by definition of the HCBM, each point Xi belongs to exactly one cluster C (k) (Xi) at a given depth k, and we want to know under which condition on the distance matrix we will find the correct clusters defined by Pk. We call these conditions the separability conditions. A separability condition for the points X1↪ ▷ ▷ ▷ ↪XN is a condition on the distance matrix of these points such that if we apply a clustering procedure whose input is the distance matrix, then the algorithm yields the correct clustering Pk = ¶C (k) 1 ↪ ▷ ▷ ▷ ↪C (k) lk ♦, . For example, for ¶X1↪X2↪X3♦ if we have C(X1) = C(X2) 6= C(X3) in the one-level two-block HCBM, then a separability condition is d1↪2 < d1↪3 and d1↪2 < d2↪3.
Separability conditions are deterministic and depend on the algorithm used for clustering. They are generic in the sense that for any sets of points that satisfy the condition the algorithmwill separate them in the correct clusters. In the LanceWilliams algorithm framework [Chen and Van Ness, 1996], they are closely related to "space conserving" properties of the algorithm and in particular on the way the distances between clusters change during the clustering process.
Space-conserving algorithms
In [Chen and Van Ness, 1996], the authors define what they call a semi-space-conserving algorithm.
Definition 1 (Semi-space-conserving algorithms). An algorithm is semi-space-conserving if for all clusters Ci, Cj, and Ck,D(Ci [ Cj ↪ Ck) 2 [min(Dik↪ Djk)↪ max(Dik↪ Djk)]
Among the Lance-Williams algorithms we study here, Single, Complete, Average and McQuitty algorithms are semispace-conserving. Although Chen and Van Ness only considered Lance-Williams algorithms the definition of a space conserving algorithm is useful for any agglomerative hierarchical algorithm. An alternative formulation of the semispace-conserving property is:
Definition 2 (Space-conserving algorithms). A linkage agglomerative hierarchical algorithm is space-conserving if
Such an algorithm does not "distort" the space when points are clustered which makes the sufficient separability condition easier to get. For these algorithms the separability condition does not depend on the size of the clusters.
The following two propositions are easy to verify.
Proposition 1. The semi-space-conserving Lance-Williams algorithms are space-conserving.
Proposition 2. Minimax linkage and Hausdorff linkage are space-conserving.
For space-conserving algorithms we can now state a sufficient separability condition on the distance matrix.
Proposition 3. The following condition is a separability condition for space-conserving algorithms:
The maximum distance is taken over any two points in a same cluster (intra) and the minimum over any two points in different clusters (inter).
Proof. Consider the set ¶dsij ♦ of distances between clusters after s steps of the clustering algorithm (therefore ¶d0ij ♦ is the initial set of distances between the points). Denote ¶dsinter ♦ (resp. ¶dsintra ♦) the sets of distances between subclusters belonging to different clusters (resp. the same cluster) at step s. If the separability condition is satisfied then we have the following inequalities:
Then the separability condition implies that the separability condition S2 is verified for all step s because after each step the updated intra distances are in the convex hull of the intra distances of the previous step and the same is true for the inter distances. Moreover since S2 is verified after each step, the algorithm never links points from different clusters and the proposition entails. ⇤
Ward algorithm
The Ward algorithm is a space-dilating Lance-Williams algorithm: D(Ci [ Cj↪Ck) > max(Dik↪Djk). This is a more complicated situation because the structure
is not necessarily preserved under the condition max d0inter < mind0intra . Points which are not clustered move away from the clustered points. Outliers, which will only be clustered at the very end, will end up close to each other and far from the clustered points. This can lead to wrong clusters. Therefore a generic separability condition for Ward needs to be stronger and account for the distortion of the space. Since the distortion depends on the number of steps the algorithm needs, the separability condition depends on the size of the clusters.
Proposition 4 (Separability condition for Ward). The separability condition for Ward reads:
where n = maxi ni is the size of the largest cluster.
Proof. Let A and B be two subsets of the N points of size a and b respectively. Then
is a linkage function for the Ward algorithm. To ensure that the Ward algorithm will never merge the wrong subsets it is sufficient that for any sets A and B in a same cluster, and A0 , B0 in different clusters, we have:
Since
we obtain the condition:
k-means
The k-means algorithm is not a linkage algorithm. For the k-means algorithm we need a separability condition that ensures that the initialization will be good enough for the algorithm to find the partition. In [Ryabko, 2010] (Theorem 1), the author proves the consistency of the one-step farthestpoint initialization k-means [Katsavounidis et al., 1994] with a distributional distance for clustering processes. The separability condition S1 of Proposition 3 is sufficient for k-means.
4 Consistency of well-known clustering algorithms
In the previous section we have determined configurations of points such that the clustering algorithm will find the right partition. The proof of the consistency now relies on showing that these configurations are likely. In fact the probability that our points fall in these configurations goes to 1 as T !1.
The precise definition of what we mean by consistency of an algorithm is the following:
Definition 3 (Consistency of a clustering algorithm). Let (Xt1 ↪ ▷ ▷ ▷ ↪XtN ), t = 1↪ ▷ ▷ ▷ ↪ T , be N univariate random variables observed T times. A clustering algorithm A is consistent with respect to the Hierarchical Correlation Block Model (HCBM) defining a set of nested partitions P if the probability that the algorithm A recovers all the partitions in P converges to 1 when T ! 1.
As we have seen in the previous section the correct clustering can be ensured if the estimated correlation matrix verifies some separability condition. This condition can be guaranteed by requiring the error on each entry of the matrix ˆRT to be smaller than the contrast, i.e. ⇢1-⇢0 2 , on the theoretical matrix R. There are classical results on the concentration properties of estimated correlation matrices such as:
Theorem 1 (Concentration properties of the estimated correlation matrices [Liu et al., 2012a]). If ⌃ and ˆ⌃ are the population and empirical Spearman correlation matrix respectively, then with probability at least 1- 1 T 2 , forN ≥ 24 log T +2, we have
The concentration bounds entails that if T ≫ log(N) then the clustering will find the correct partition because the clusters will be sufficiently separated with high probability. In financial applications of clustering, we need the error on the estimated correlation matrix to be small enough for relatively short time-windows. However there is a dimensional dependency of these bounds [Tropp, 2015] that make them uninformative for realistic values of N and T in financial applications, but there is hope to improve the bounds using the special structure of HCBM correlation matrices.
4.1 From the one-level to the general HCBM
To go from the one-level HCBM to the general case we need to get a separability condition on the nested partition model. For both space-conserving algorithms and the Ward algorithm, this is done by requiring the corresponding separability condition for each level of the hierarchy.
For all 1 k h, we define dk and dk such that for all 1 i↪ j N, we have dk dij dk when C (k) (Xi) = C (k) (Xj) and C (k+1) (Xi) 6= C (k+1) (Xj). Notice that dk = (1 - ⇢k)◁2 and dk = (1 - ⇢k )◁2.
Proposition 5. [Separability condition for space-conserving algorithms in the case of nested partitions] The separability condition reads:
This condition can be guaranteed by requiring the error on each entry of the matrix ˆ⌃ to be smaller than the lowest contrast. Therefore the maximum error we can have for spaceconserving algorithms on the correlation matrix is
Proposition 6. [Separability condition for the Ward algorithm in the case of nested partitions] Let nk be the size of the largest cluster at the level k of the hierarchy.
The separability condition reads:
Therefore the maximum error we can have for spaceconserving algorithms on the correlation matrix is
where nk is the size of the largest cluster at the level k of the hierarchy.
We finally obtain consistency for the presented algorithms with respect to the HCBM from the previous concentration results.
5 Empirical rates of convergence
We have shown in the previous sections that clustering correlated random variables is consistent under the hierarchical correlation block model. This model is supported by many empirical studies [Mantegna, 1999] where the authors scrutinize time series of returns for several asset classes. However, it was also noticed that the correlation structure is not fixed and tends to evolve through time. This is why, besides being consistent, the convergence of the methodology needs to be fast enough for the underlying clustering to be accurate. For now, theoretical bounds such as the ones obtained in Theorem 1 are uninformative for realistic values of N and T . For example, for N = 265 and T = 2500 (roughly 10 years of historical daily returns) with a separation between clusters of d = 0▷2, we are confident with probability greater than 1-2N 2 e-Td2 ◁24 ⇡ -2176 that the clustering algorithm has recovered the correct clusters. These bounds will eventually converge to 0 with rate OP (plogN◁pT). In addition, the convergence rates also depend on many factors, e.g. the number of clusters, their relative sizes, their separations, whose influence is very specific to a given clustering algorithm, and thus difficult to consider in a theoretical analysis.
To get an idea of the minimal amount of data one should use in applications to be confident with the clustering results, we suggest to design realistic simulations of financial time series and determine the sample critical size from which the clustering approach "always" recovers the underlying model. We illustrate such an empirical study in the following section.
5.1 Financial time series models
For the simulations, implementation and tutorial available at www.datagrapple.com/Tech, we will consider two models:
- ÷ The standard but debated model of quantitative finance, the Gaussian random walk model whose increments are realizations from a N-variate Gaussian: X ⇠ N (0↪ ⌃).
The Gaussian model does not generate heavy-tailed behavior (strong unexpected variations in the price of an asset) which can be found in many asset returns [Cont, 2001] nor does it generate tail-dependence (strong variations tend to occur at the same time for several assets). This oversimplified model provides an empirical convergence rate for clustering that is unlikely to be exceeded on real data.
- ÷ The increments are realizations from a N-variate Student's t-distribution, with degree of freedom ⌫ = 3: X ⇠ t⌫(0↪ ⌫-2 ⌫ ⌃).
The N-variate Student's t-distribution (⌫ = 3) captures both the heavy-tailed behavior (since marginals are univariate Student's t-distribution with the same parameter ⌫ = 3) and the tail-dependence. It has been shown that this distribution yields a much better fit to real returns than the Gaussian distribution [Hu and Kercheval, 2010].
The Gaussian and t-distribution are parameterized by a covariance matrix ⌃. We define ⌃ such that the underlying correlation matrix has the structure depicted in Figure 2. This correlation structure is inspired by the real correlations between credit default swap assets in the European "investment grade", European "high-yield" and Japanese markets. More precisely, this correlation matrix allows us to simulate the returns time series for N = 265 assets divided into
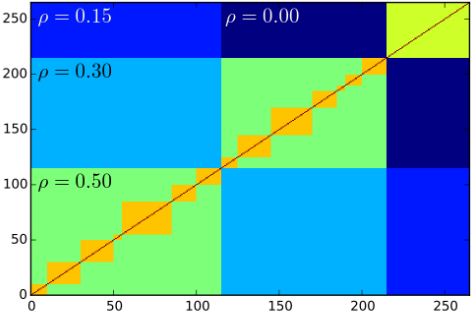
- ÷ a "European investment grade" cluster composed of 115 assets, subdivided into
- 7 industry-specific clusters of sizes 10, 20, 20, 5, 30, 15, 15; the pairwise correlation inside these 7 clusters is 0▷7;
- ÷ a "European high-yield" cluster composed of 100 assets, subdivided into
- 7 industry-specific clusters of sizes 10, 20, 25, 15, 5, 10, 15; the pairwise correlation inside these 7 clusters is 0▷7;
- ÷ a "Japanese" cluster composed of 50 assets whose pairwise correlation is 0▷6.
We can then sample time series from these two models.
5.2 Experiment: Recovering the initial clusters
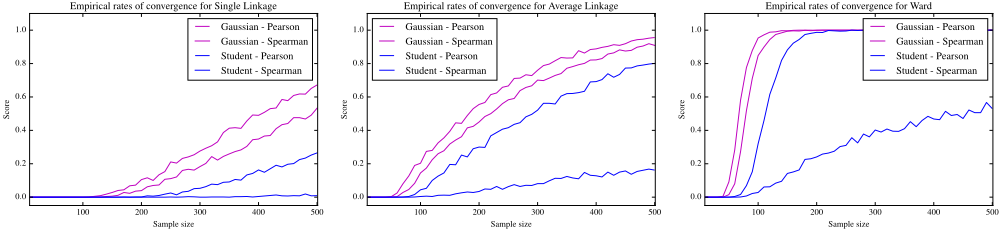
For each model, for every T ranging from 10 to 500, we sample L = 103 datasets of N = 265 time series with length T from the model. We count how many times the clustering methodology (here, the choice of an algorithm and a correlation coefficient) is able to recover the underlying clusters defined by the correlation matrix. In Figure 3, we display the results obtained using Single Linkage (motivated in Mantegna et al.'s research [Mantegna and Stanley, 1999] by the ultrametric space hypothesis and the related subdominant ultrametric given by the minimum spanning tree), Average Linkage (which is used to palliate against the unbalanced effect of Single Linkage, yet unlike Single Linkage, it is sensitive to monotone transformations of the distances dij) and the Ward method leveraging either the Pearson correlation coefficient or the Spearman one.
5.3 Conclusions from the empirical study
As expected, the Pearson coefficient yields the best results when the underlying distribution is Gaussian and the worst when the underlying distribution is heavy-tailed. For such elliptical distributions, rank-based correlation estimators are more relevant [Liu et al., 2012b; Han and Liu, 2013]. Concerning clustering algorithm convergence rates, we find that Average Linkage outperforms Single Linkage for T ⌧ N and T ' N. One can also notice that both Single Linkage and Average Linkage have not yet converged after 500 realizations (roughly 2 years of daily returns) whereas the Ward method, which is not mainstream in the econophysics literature, has converged after 250 realizations (about a year of daily returns). Its variance is also much smaller. Based on this empirical study, a practitioner working with N = 265 assets whose underlying correlation matrix may be similar to the one depicted in Figure 2 should use the Ward + Spearman methodology on a sliding window of length T = 250.
6 Discussion
In this contribution, we only show consistency with respect to a model motivated by empirical evidence. All models are wrong and this one is no exception to the rule: random walk hypothesis, real correlation matrices are not that "blocky". We identified several theoretical directions for the future:
- ÷ The theoretical concentration bounds are not sharp enough for usual values of N↪ T. Since the intrinsic dimension of the correlation matrices in the HCBM is low, there might be some possible improvements [Tropp, 2015].
- ÷ "Space-conserving", "space-dilating" is a coarse classification that does not allow to distinguish between several algorithms with different behaviors. Though Single Linkage (which is nearly "space-contracting") and Average Linkage have different convergence rates as shown by the empirical study, they share the same theoretical bounds.
And also directions for experimental studies:
- ÷ It would be interesting to study spectral clustering techniques which are less greedy than the hierarchical clus-
- tering algorithms. In [Tumminello et al., 2007], authors show that they are less stable with respect to statistical uncertainty than hierarchical clustering. Less stability may imply a slower convergence rate.
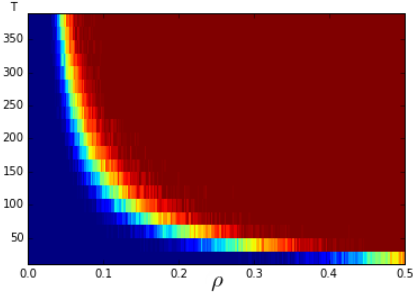
- ÷ We notice that there are isoquants of clustering accuracy for many sets of parameters, e.g. (N↪ T), (⇢↪ T). Such isoquants are displayed in Figure 4. Further work may aim at characterizing these curves. We can also observe in Figure 4 that for ⇢ 0▷08, the critical value for T explodes. It would be interesting to determine this asymptotics as ⇢ tends to 0.
Finally, we have provided a guideline to help the practitioner set the critical window-size T for a given clustering methodology. One can also investigate which consistent methodology provides the correct clustering the fastest. However, much work remains to understand the convergence behaviors of clustering algorithms on financial time series.
@inproceedings{ijcai2016p367,
  title     = {Clustering Financial Time Series: How Long Is Enough?},
  author    = {Marti, Gautier and Andler, Sébastien and Nielsen, Frank and Donnat, Philippe},
  booktitle = {Proceedings of the Twenty-Fifth International Joint Conference on
               Artificial Intelligence, {IJCAI-16}},
  publisher = {AAAI Press / International Joint Conferences on Artificial Intelligence},
  editor    = {Subbarao Kambhampati},
  pages     = {2583--2588},
  year      = {2016},
  month     = {7},
  url       = {https://ijcai.org/proceedings/2016/367},
}
TY - CPAPER TI - Clustering Financial Time Series: How Long Is Enough? AU - Marti, Gautier AU - Andler, Sébastien AU - Nielsen, Frank AU - Donnat, Philippe T2 - Proceedings of the Twenty-Fifth International Joint Conference on Artificial Intelligence, IJCAI-16 PB - AAAI Press / International Joint Conferences on Artificial Intelligence PY - 2016 SP - 2583 EP - 2588 UR - https://ijcai.org/proceedings/2016/367 ER -Copied
Machine-readable versions of this paper, for tools and AI agents:





