
Why We Go Where We Go: Profiling User Decisions on Choosing POIs
Proceedings of the Twenty-Ninth International Joint Conference on Artificial Intelligence. Main track. Pages 3459-3465.
https://doi.org/10.24963/ijcai.2020/478
Keywords
- Data Mining: Applications
- Multidisciplinary Topics and Applications: Ubiquitous Computing Systems
- Multidisciplinary Topics and Applications: Other
Abstract
While Point-of-Interest (POI) recommendation has been a popular topic of study for some time, little progress has been made for understanding why and how people make their decisions for the selection of POIs. To this end, in this paper, we propose a user decision profiling framework, named PROUD, which can identify the key factors in people's decisions on choosing POIs. Specifically, we treat each user decision as a set of factors and provide a method for learning factor embeddings. A unique perspective of our approach is to identify key factors, while preserving decision structures seamlessly, via a novel scalar projection maximization objective. Exactly solving the objective is non-trivial due to a sparsity constraint. To address this, our PROUD adopts a self projection attention and an L2 regularized sparse activation to directly estimate the likelihood of each factor to be a key factor. Finally, extensive experiments on real-world data validate the advantage of PROUD in preserving user decision structures. Also, our case study indicates that the identified key decision factors can help us to provide more interpretable recommendations and analyses.
- [Abdollahi and Nasraoui, 2017] Behnoush Abdollahi and Olfa Nasraoui. Using explainability for constrained ma- trix factorization. In RecSys, pages 79-83, 2017.
- [Bao et al., 2012] Tengfei Bao, Huanhuan Cao, Enhong Chen, Jilei Tian, and Hui Xiong. An unsupervised approach to modeling personalized contexts of mobile users. Knowledge and Information Systems, 31(2):345- 370, 2012.
- [Dong et al., 2017] Yuxiao Dong, Nitesh V. Chawla, and Ananthram Swami. metapath2vec: Scalable representa- tion learning for heterogeneous networks. In SIGKDD, pages 135-144, 2017.
- [Donkers et al., 2017] Tim Donkers, Benedikt Loepp, and Jürgen Ziegler. Sequential user-based recurrent neural net- work recommendations. In RecSys, pages 152-160, 2017.
- [Feng et al., 2015] Shanshan Feng, Xutao Li, Yifeng Zeng, Gao Cong, Yeow Meng Chee, and Quan Yuan. Person- alized ranking metric embedding for next new poi recom- mendation. In IJCAI, pages 2069-2075, 2015. IJCAI
- [He et al., 2015] Xiangnan He, Tao Chen, Min-Yen Kan, and Xiao Chen. Trirank: Review-aware explainable recom- mendation by modeling aspects. In CIKM, pages 1661- 1670, 2015.
- [Heckel et al., 2017] Reinhard Heckel, Michail Vlachos, Thomas Parnell, and Celestine Dünner. Scalable and in- terpretable product recommendations via overlapping co- clustering. In ICDE, 2017. [Hoomans, 2015] Joel Hoomans. 35,000 decisions: The great choices of strategic leaders. https://go.roberts.edu/ leadingedge/the-great-choices-of-strategic-leaders, 2015. Accessed: 2019-09-04. Link
- [Hu et al., 2016] Renjun Hu, Charu C. Aggarwal, Shuai Ma, and Jinpeng Huai. An embedding approach to anomaly detection. In ICDE, pages 385-396, 2016.
- [Khalil et al., 2017] Elias B. Khalil, Hanjun Dai, Yuyu Zhang, Bistra Dilkina, and Le Song. Learning combinato- rial optimization algorithms over graphs. In NIPS, pages 6348-6358, 2017.
- [Martins and Astudillo, 2016] André F. T. Martins and Ramón Fernández Astudillo. From softmax to sparsemax: A sparse model of attention and multi-label classification. In ICML, pages 1614-1623, 2016.
- [Massimo and Ricci, 2018] David Massimo and Francesco Ricci. Harnessing a generalised user behaviour model for next-poi recommendation. In RecSys, pages 402-406, 2018.
- [Natarajan, 1995] Balas Kausik Natarajan. Sparse approxi- mate solutions to linear systems. SIAM journal on com- puting, 24(2):227-234, 1995.
- [Seo et al., 2017] Sungyong Seo, Jing Huang, Hao Yang, and Yan Liu. Interpretable convolutional neural networks with dual local and global attention for review rating pre- diction. In RecSys, pages 297-305, 2017.
- [Tang et al., 2015] Jian Tang, Meng Qu, Mingzhe Wang, Ming Zhang, Jun Yan, and Qiaozhu Mei. LINE: large- scale information network embedding. In WWW, pages 1067-1077, 2015.
- [Vinyals et al., 2015] Oriol Vinyals, Meire Fortunato, and Navdeep Jaitly. Pointer networks. In NIPS, pages 2692- 2700, 2015.
- [Wang et al., 2018a] Daheng Wang, Meng Jiang, Qingkai Zeng, Zachary Eberhart, and Nitesh V. Chawla. Multi- type itemset embedding for learning behavior success. In SIGKDD, pages 2397-2406, 2018.
- [Wang et al., 2018b] Xiang Wang, Xiangnan He, Fuli Feng, Liqiang Nie, and Tat-Seng Chua. Tem: Tree-enhanced em- bedding model for explainable recommendation. In WWW, pages 1543-1552, 2018.
- [Wu and Ester, 2015] Yao Wu and Martin Ester. Flame: A probabilistic model combining aspect based opinion min- ing and collaborative filtering. In WSDM, pages 199-208, 2015.
- [Xie et al., 2016] Min Xie, Hongzhi Yin, Hao Wang, Fan- jiang Xu, Weitong Chen, and Sen Wang. Learning graph- based poi embedding for location-based recommendation. In CIKM, pages 15-24, 2016.
- [Yang et al., 2015] Dingqi Yang, Daqing Zhang, Vincent W Zheng, and Zhiyong Yu. Modeling user activity prefer- ence by leveraging user spatial temporal characteristics in lbsns. IEEE Transactions on Systems, Man, and Cybernet- ics: Systems, 45(1):129-142, 2015.
- [Yang et al., 2017] Carl Yang, Lanxiao Bai, Chao Zhang, Quan Yuan, and Jiawei Han. Bridging collaborative fil- tering and semi-supervised learning: a neural approach for poi recommendation. In SIGKDD, pages 1245-1254, 2017.
- [Zhang and Chen, 2018] Yongfeng Zhang and Xu Chen. Ex- plainable recommendation: A survey and new perspec- tives. arXiv preprint arXiv:1804.11192, 2018.
- [Zhang et al., 2014] Yongfeng Zhang, Guokun Lai, Min Zhang, Yi Zhang, Yiqun Liu, and Shaoping Ma. Explicit factor models for explainable recommendation based on phrase-level sentiment analysis. In SIGIR, pages 83-92, 2014.
- [Zhang et al., 2020] Weijia Zhang, Hao Liu, Yanchi Liu, Jingbo Zhou, and Hui Xiong. Semi-supervised hierarchi- cal recurrent graph neural network for city-wide parking availability prediction. In AAAI, 2020.
- [Zhou et al., 2019] Jingbo Zhou, Shan Gou, Renjun Hu, Dongxiang Zhang, Jin Xu, Xuehui Wu, Airong Jiang, and Hui Xiong. A collaborative learning framework to tag re- finement for points of interest. In SIGKDD, pages 1752- 1761, 2019.
- [Zhu et al., 2012] Hengshu Zhu, Huanhuan Cao, Enhong Chen, Hui Xiong, and Jilei Tian. Exploiting enriched contextual information for mobile app classification. In CIKM, pages 1617-1621, 2012.
References were extracted automatically from the PDF and may contain errors.
Full text extracted automatically from the PDF; figures, tables and equations may differ. The PDF is the version of record.
1 Introduction
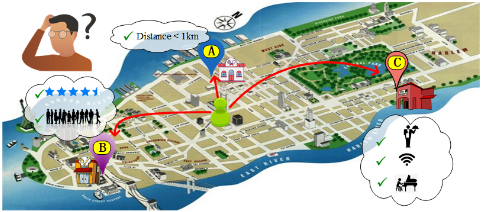
Decision-making is an inevitable part of our life. As estimated by various sources, an adult makes about 35,000 remotely conscious decisions each day [Hoomans, 2015]. With this number, understanding the reasons behind people's decisions is of great importance and benefit. In this paper, we study user decision profiling which aims to identify the key factors of people's decisions. An example of user decision profiling is illustrated in Fig. 1, in which a user has made three decisions on choosing Point-of-Interests (POIs). More specifically, POI A is chosen mainly due to distance reasons. POI B locates in downtown and its popularity and food quality are attracting factors. Finally, the user chooses POI C for better user experience, e.g., low waiting time and quiet environment. These reasons/factors provide a deeper understanding of user behaviors, which can in turn facilitate numerous applications, such as user profiling, product recommendation, business intelligence, etc.
∗ equal contribution
The advances of location-based services enable us to investigate large-scale human mobile behaviors. We thus focus on profiling POI-choosing decisions. In literature, most related studies consider POI recommendation [Feng et al., 2015; Yang et al., 2017; Massimo and Ricci, 2018]. Despite the effectiveness, these methods usually have troubles in explaining their results. Efforts have also been made to interpretable POI recommendation [Wu and Ester, 2015; Wang et al., 2018b]. However, the interpretability comes from external data [Wu and Ester, 2015] and the effectiveness might be sacrificed owing to feature selection [Wang et al., 2018b]. Therefore, they are not suitable for our task.
The challenges of our problem also arise from the unique characteristics of user decisions. To start with, decision profiling needs to unify heterogeneous factors, e.g., the basic spatiotemporal influence and the hidden preference and functionality impacts for choosing POIs. Second, the contributions of factors can differ greatly from one decision to another, which is hard to pre-define. Instead, it is more desired to determine the various factor contributions automatically. Finally, although our goal is to identify key factors, the complex decision structures need to be preserved at the same time to ensure the goodness of the identified key factors.
To this end, in this paper, we propose a novel framework, named PROUD, for PROfiling User Decisions. We collect multifaceted decision factors from different aspects and model factors via representation learning. In this way, all factors are organically integrated. To cope with the diverse factor contributions, i.e., each decision is mainly contributed by a few key factors, we propose a novel objective: For each decision, we maximize the sum of scalar projection of all factor embeddings on an aggregated embedding of key factors. By projection, the impacts of non-key factors are reduced. However, exactly solving the objective is non-trivial due to a sparsity constraint. We show that the optimization is non-convex and, worse still, the problem involves sparsityconstrained linear system, which is often NP-hard [Natarajan, 1995]. Thus, we turn to find the desired aggregated embedding in a purely data-driven manner and directly estimate the likelihood of each factor to be a key factor. As a side effect, our approach can identify key factors and preserve decision structures at the same time by maximizing scalar projection. Finally, using two real-world data sets, we conduct extensive experiments. We find that PROUD outperforms baselines by at least 30% for preserving decision structures. Also, our case study demonstrates that the identified key factors are reasonable and insightful. Our main contributions are as follows:
- We study user decision profiling to provide explanations for people's decisions.
- We propose a novel scalar projection maximization objective for the problem.
- We devise a framework PROUD which is able to directly estimate the likelihood of each factor to be a key factor.
- We demonstrate the effectiveness of PROUD quantitatively and qualitatively through extensive experiments.
2 User Decision Profiling
In this section, we first formally define user decision profiling. Afterward, we introduce our main idea to attack the problem. We start by defining several concepts.
Definition 1 (Factor). A factor f is a concrete and explainable item that has impacts on decision-making.
Definition 2 (Decision). A decision D is represented as a set of factors, i.e., D = {f1, . . . , fn}.
Factors should be well designed, e.g., by domain experts, to ensure their impacts on user decisions and interpretability. In this work, we consider factors of POI-choosing decisions from three aspects: user, POI, and context [Zhu et al., 2012; Bao et al., 2012]. User-related factors are user identifier and frequently-visited areas/POIs. POI-related factors contain POI identifier, category, brand, and POI popularity. Finally, those context-related ones are decision time (i.e., hour) and the distance to home, work, and POI at the decision time, respectively. We incorporate user and POI identifiers to model the distinct impacts of individual users and POIs. Besides, according to our statistics, we discretize the continuous popularity into six levels based on the standard scores z of log-scaled popularity: (i) strongly unpopular if z ≤ -1, (ii) unpopular if z ∈ (-1,-0.5], (iii) weakly unpopular if z ∈ (-0.5, 0], (iv) weakly popular if z ∈ (0, 0.5], (v) popular if z ∈ (0.5, 1], and (vi) strongly popular if z > 1. We also discretize distance into five levels: (i) 1km and less, (ii) 1 to 3 km, (iii) 3 to 7 km, (iv) 7 to 15 km, and (v) 15 km and more.
To better understand user behaviors, we profile user decisions to discover the reasons behind.
Problem 1 (User decision profiling). Given each decision D, identify a small subset of key factors that actively contribute to D and determine the contributing weights of key factors.
A scalar projection maximization perspective. We next present our main idea, i.e., scalar projection maximization, to tackle user decision profiling. Recall that we use factors from various aspects to represent user decisions. This is to avoid missing any possible clues. However, in practice, it is unlikely that all factors play a role in the decision-making process. Typically, each decision is mainly contributed by a few (e.g., 2 to 5) key factors that we aim to identify, while the rest are supporting factors of minor impacts.
Inspired by this, we propose to distinguish key factors from supporting ones for user decision profiling. More specifically, we learn hidden representations for factors and, for each decision, compute an aggregated key embedding as a weighted combination of the embeddings of its key factors. We then maximize the sum of scalar projection of each factor embedding on the aggregated key embedding to preserve decision structures. By scalar projection, the impacts of supporting factors are reduced. Finally, the optimal aggregated embeddings reveal key decision factors.
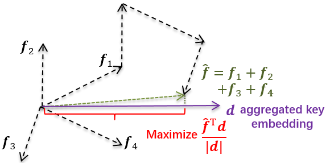
The idea is further illustrated by an example in Fig. 2. Suppose we aim to profile a decision D = {f1, . . . , f4} by identifying up to two key factors. We learn factor embeddings f1, . . . , f4, and the core is to compute an aggregated key embedding d, e.g., along the direction of f1 + f4 in our case, such that the sum of scalar projection ˆ f ᵀd/|d| is maximized, where ˆ f = ∑4i=1 fi and | · | is the Euclidean norm. Finally, f1 and f4 are selected as key factors, while factors f2 and f3 only have limited (or opposite) impacts to the decision.
Optimization details. Let F = [f1, . . . , fn]ᵀ ∈ Rn×d be the factor embedding matrix of decision D and a ∈ Rn be an n-dimensional vector. Formally, the objective of scalar projection maximization for decision D is as follows:
Here, a ⪰ 0 means that ai ≥ 0 for every i ∈ {1, . . . , n}, nzr(a) is the number of non-zero items in a, and λ is a sparsity threshold to bound the number of key factors. That is, vector a indicates the contributions of key factors in the aggregated embedding, i.e., d = ∑i (aifi). For simplicity, scalar projection is not normalized with | ∑i fi| since an L2 regularization will be used on all factor embeddings.
The sparsity constraint makes the optimization problem challenging. First, it is easy to verify that the optimization is non-convex, e.g., the mean of two sparse a might be non-sparse. Second, even fixing F, Eq. (1) remains as a sparsity-constrained linear system [Natarajan, 1995], which is often NP-hard. To solve this combinatorial optimization problem efficiently, we apply machine learning techniques to learn good heuristics from data [Vinyals et al., 2015; Khalil et al., 2017]. Specifically, instead of explicitly optimizing a, we estimate the likelihood of each factor to be a key factor given the factor embeddings which will be updated to maximize the scalar projection.
3 ProposedModel
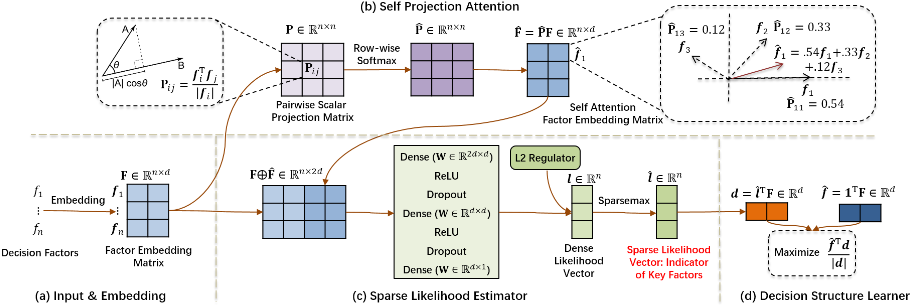
In this section, we present our decision profiling framework PROUD, which learns to identify key factors and preserve decision structures simultaneously. The overview is illustrated in Fig. 3, which consists of four components:
- Input & embedding takes a decision as input and assigns a d-dimensional embedding to each of the factors.
- Self projection attention assigns another attention embedding to each factor in which projection information is well encoded. It computes a pairwise scalar projection matrix and uses it as attention weights.
- Sparse likelihood estimator evaluates the likelihood of each factor to be a key factor. It combines the initial and attention factor embeddings via a multilayer perceptron (MLP) and adopts an L2 regularized sparse activation.
- Decision structure learner computes the aggregated key embedding given likelihood and preserves decision structures by maximizing the sum of scalar projection of factor embeddings on that aggregated embedding.
3.1 Self Projection Attention
Our PROUD learns to directly evaluate the likelihood of each factor to be a key factor in a purely data-driven manner. Observe that, for each factor, whether it is a key factor or not depends much on the scalar projection of other factors on it. Intuitively, a key factor ought to be well supported by a number of other factors whose scalar projection on that factor is large. Thus, we adopt a self projection attention to compute another embedding for each factor, which encodes projection information for learning likelihood in subsequent steps.
Formally, given factors f1, . . . , fn in a decision and the corresponding factor embedding matrix F = [f1, . . . , fn]ᵀ , it first computes a pairwise scalar projection matrix P ∈ Rn×n , in which Pij = f ᵀ i fj/|fi| is the scalar projection of fj on fi. It then normalizes P with row-wise softmax:
Afterward, it computes an attention embedding ˆ fi = ∑nj=1 ˆPijfj ∈ Rd for each factor fi, which is the sum of all factor embeddings fj weighted by ˆPij. An example is illustrated at the upper-right of Fig. 3. As can be seen, projection information is well encoded in ˆ f1 such that factors with higher scalar projection, i.e., f1 and f2, contribute more to ˆ f1. The corresponding matrix form is ˆF = ˆPF ∈ Rn×d .
3.2 Sparse Likelihood Estimator
With both initial and attention factor embeddings, the sparse likelihood estimator component evaluates the likelihood of each factor to be a key factor. We first concatenate the two factor embedding matrices into F ⊕ ˆF ∈ Rn×2d and feed it to a three-layer MLP to derive an unnormalized likelihood vector l ∈ Rn for the n factors:
Here W1 ∈ R2d×d , W2 ∈ Rd×d , W3 ∈ Rd×1 , b1 ∈ Rd , and b2 ∈ Rd are trainable MLP parameters. The unnormalized likelihood li of factor fi is determined by both fi and ˆ fi. In other words, the likelihood of each factor has considered both the factor itself and other factors, with an emphasis on those having high scalar projection on fi.
We then adopt a sparse activation to normalize l. We consider sparsemax [Martins and Astudillo, 2016] which is similar to softmax except for outputting sparse probabilities:
where ∆n-1 = {p ∈ Rn | 1ᵀp = 1, p ⪰ 0} is the ndimensional probability simplex and sparsity is ensured by Euclidean projection onto ∆n-1 . In practice, sparsemax(l) can be easily computed in O(n log n) time.
Finally, ˆ l = sparsemax(l) ∈ Rn is the valid likelihood vector indicating which factors are key factors and their contributing weights. The number of non-zero entries in ˆ l is not controllable given its definition. However, there is usually a need to provide flexibility for the number of key factors, e.g., parameter λ of Eq. (1). Thus, we further equip an L2 regulator on the unnormalized l before sparsemax. The larger the L2 weight is, the more key factors ˆ l identifies. However, we note that our L2 regularized sparse activation is a relaxed version and cannot guarantee that the number of key factors is bounded by some threshold.
3.3 Decision Structure Learner
Given likelihood vector ˆ l, the aggregated key embedding d ∈ Rd of decision D is computed as d = ∑ni=1 ˆ lifi = ˆ lᵀF. We then preserve decision structures by maximizing the sum of scalar projection of all related factor embeddings on d:
Recall that ˆ f = ∑ni=1 fi and, compared with Eq. (1), this objective does not need to search for vector a.
To train factor embeddings, we need both positive and negative decision instances [Wang et al., 2018a]. The decisions D we refer to by far are all positive: The user chooses the POI to visit under certain context. We then denote the empirical visit rate ˆ VR(D) = 1. For each positive decision D, we can generate several negative instances D- by replacing the POI-related factors with factors of other POIs that the user does not decide to visit. Typical alternative POIs for negative instances can be those near the visited one or those of the same category as the visited POI. Similarly, we denote ˆ VR(D-) = 0. The predictive visit rates VR(D) and VR(D-) are determined by scalar projection, i.e., σ( ˆ f ᵀd/|d|), where σ(x) = 1/(1+e-x ) is the sigmoid function. Note that VR(·) and ˆ VR(·) can be regarded as the predictive and empirical distributions of visit rates of decision instances. We then learn to preserve decision structures via minimizing the distance dist(VR(·), ˆ VR(·)) between the two distributions. Replacing dist(·, ·) with KL-divergence and ignoring the constants, we have the following to minimize [Tang et al., 2015]:
That is, the objective sums over all decision instances and maximizes VR(D) for positive ones while minimizes VR(D-) for negative ones. Note that maximizing VR(D) (or, minimizing VR(D-)) is indeed maximizing (or, minimizing) the corresponding scalar projection ˆ f ᵀd/|d|.
| Description | BEIJING | NYC |
|---|---|---|
| time spanning | 3/20/18∼8/30/18 | 4/12/12∼2/16/13 |
| # of users | 90,090 | 1,083 |
| # of POIs | 169,528 | 109,018 |
| # of positive D | 199,106 | 146,325 |
| # of negative D- | 1,694,365 | 1,282,302 |
| # of factors per D/D- | 20.5 | 45 |
4 Experiments
In this section we conduct extensive experiments to evaluate our PROUD. Due to the unavailability of decision records with ground-truth key factors, we evaluate the effectiveness of PROUD for preserving user decision structures. Besides, we also present a case study for qualitatively assessing the key factors identified by PROUD.
4.1 Experimental Setups
Data sets. We chose two data sets to test our approach.
(1) BEIJING was produced using the map query and POI-visit record data provided by a third-party map service platform. Each query was associated with an anonymous user identifier, a location, a time stamp, and a list of related POIs. For each query, we constructed a positive decision instance if the user visited one POI in the list in following two days, and constructed negative instances with those unvisited POIs. We discarded a map query if no POIs in the list were visited. (2) NYC was produced based on a public Foursquare checkin data set [Yang et al., 2015]. We collected POIs of NYC and the numbers of likes to POIs (for evaluating POI popularity) with Foursquare developers APIs. We treated each checkin as a positive decision and generated negative instances by replacing the POI with (i) those nearby and (ii) those of the same categories. We did not consider distance factors since decision locations were unknown.
For each data set, we randomly split the data into 70% for training, 10% for validation, and 20% for testing. The statistics of our data are illustrated in Table 1.
Metrics. We adopted Prec (Precision), Recall, F1, and AUC (Area Under the ROC Curve) to evaluate the performance. We used the optimal threshold on validation set to compute Prec, Recall, and F1 on test data.
Algorithms. We compared our approach with various baselines that could be used to preserve decision structures.
- LINE [Tang et al., 2015] is a classic network embedding method. We constructed a co-visiting POI graph to apply LINE for preserving user decision structures.
- GE [Xie et al., 2016] is a graph embedding approach to location recommendation. It adopts a logistic regression to combine the proximities between different entities.
- MP2VEC [Dong et al., 2017] is a heterogeneous network embedding method. We considered the follow-
| Algorithm | BEIJING | NYC | ||||||
|---|---|---|---|---|---|---|---|---|
| Prec | Recall | F1 | AUC | Prec | Recall | F1 | AUC | |
| LINE | 0.2684 | 0.2433 | 0.2552 | 0.5827 | 0.3528 | 0.3835 | 0.3261 | 0.6459 |
| GE | 0.3005 | 0.3499 | 0.3234 | 0.6271 | 0.3767 | 0.5262 | 0.4391 | 0.7134 |
| MP2VEC | 0.4594 | 0.4180 | 0.4377 | 0.6801 | 0.4665 | 0.5247 | 0.4939 | 0.7281 |
| LEARNSUC | 0.2222 | 0.5849 | 0.3221 | 0.6791 | 0.3984 | 0.4011 | 0.3993 | 0.5600 |
| PROUD | 0.7637* | 0.6375* | 0.6949* | 0.9248* | 0.5487* | 0.7743* | 0.6422* | 0.9439* |
ing metapath: POI-X-user-X-POI-· · · , where X could be any types except for user and POI.
- LEARNSUC [Wang et al., 2018a] denotes behavior records as multi-type itemsets and learns behavior success by preserving itemset structures.
Implementation. We used the Adam optimizer and a batch size of 512 to train PROUD. The learning rate γ was set to 0.01 at first and decayed to 0.7γ after each epoch. We employed (i) an L2 regularization with weight 10-5 , (ii) a dropout with Pdrop = 0.2 in Eq. (3), and (iii) an early stopping if the F1 on validation set did not increase in 5 epochs. The number d of dimensions was fixed to 64. When quantity measures were evaluated, the test was repeated over 5 times using different data splits and the average was reported.
4.2 Experimental Results
Exp-1: Preserving decision structures. We first evaluate the overall performance of considered approaches for distinguishing positive and negative user decision instances. Its relationship to decision profiling is that PROUD preserves decision structures via identifying key factors and maximizing scalar projection, and the effectiveness of PROUD for preserving decision structures directly relies on the goodness of identified key factors. The results are reported in Table 2.
With Prec, Recall, and F1, i.e., predicting each instance as either positive or negative, PROUD significantly outperforms all baselines at the 0.01 level with paired t-test. Notably, PROUD is the only method whose majority of predicted positive instances are true positive. This is achieved without sacrificing Recall. Indeed, PROUD also recalls the most positive instances. As a result, the F1 of PROUD is on average (172%, 115%, 59%, 116%) and (97%, 46%, 30%, 61%) higher than (LINE, GE, MP2VEC, LEARNSUC) on BEIJING and NYC, respectively. The task is hard since positive and negative decision instances only partially differ in POI-related factors. The advantage of PROUD comes from our novel objective which
0
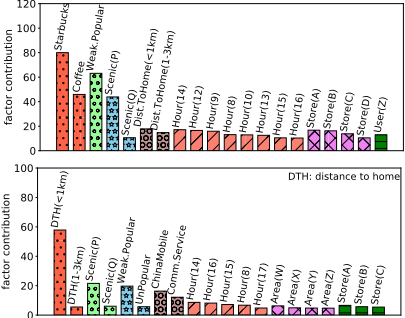
Figure 5: Top-20 key factors of Starbucks and ChinaMobile
distinguishes key and non-key factors and our entire model to effectively achieve the objective.
With AUC, i.e., ranking instances according to their likelihood of being positive, PROUD also dominates the comparison on both data sets. Indeed, the AUC of PROUD is on average (59%, 47%, 36%, 36%) and (46%, 32%, 30%, 69%) higher than (LINE, GE, MP2VEC, LEARNSUC) on BEIJING and NYC, respectively. According to the meaning of AUC, PROUD can rank a random positive instance higher than a random negative instance with probability 0.92.
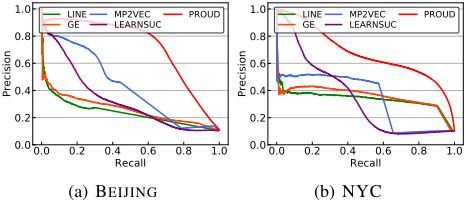
To give a comprehensive understanding of how these approaches preserve user decision structures, we present the precision-recall curves in Fig. 4. The Prec of LINE and GE soon drops to between 0.4 and 0.5 when the Recall slightly exceeds 0, and then keeps decreasing with the increment of Recall. The situation of MP2VEC on NYC is similar. On the other hand, the Prec of MP2VEC on BEIJING and of LEARNSUC remains at a relatively high level when Recall is small. In other words, they can identify a fraction of positive instances with a high accuracy. Finally, the Prec of PROUD is consistently higher than others at all levels of Recall. The gap between PROUD and other approaches clearly confirms its superiority for preserving user decision structures.
Exp-2: Case study. We next present a case study on the identified key factors to further evaluate PROUD. We collected all positive decisions for Starbucks and ChinaMobile (a major communication service provider in China) on BEIJING and listed their top-20 key factors in Fig. 5.
For Starbucks, the top-1 key factor is the brand. Note that nowadays Starbucks has become the most popular chain coffee brand in Beijing. Similarly, the category Coffee is another main key factor. Moreover, people also consider the popular-
(a) F1 and AUC
(b) Entropy of vector ˆ l
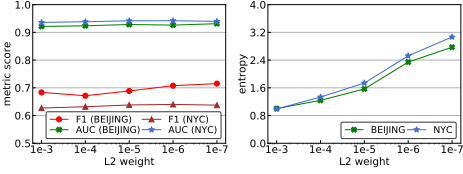
Figure 6: Impacts of L2 regulator for likelihood vectors
ity of stores when making decisions. Besides, we identify two scenic spots and, inspired, Starbucks may consider to expand its business in their surrounding areas. We also find that distance and time are two key factors: People make decisions for Starbucks when they are near their homes and usually visit stores in late morning and afternoon hours. Finally, stores themselves can be an important factor. The identified four stores are located in business areas or popular residence areas of foreigners and, thus, attract a large number of regular customers. For ChinaMobile, the impacts of brand and service decrease while distance and popularity factors play a more crucial role. Similarly, time such as early morning and afternoon remains influential. Moreover, we identify four resident areas as key factors for ChinaMobile.
Exp-3: Impacts of L2 regulator. We adopt an L2 regulator on the unnormalized likelihood vector to control the number of key factors. We finally evaluate the impacts of the regulator. The results of F1, AUC, and the entropy of the normalized likelihood vector ˆ l are reported in Fig. 6.
When increasing the L2 weight from 10-7 to 10-3 , both F1 and AUC keep stable in general, with an exception that the F1 on BEIJING is slightly better with larger L2 weights. We omit Prec and Recall, and their results are similar. On the other hand, the entropy keeps increasing: More key factors are identified with a stronger L2 regulator. To conclude, the regulator can provide flexibility for key factors without sacrificing the overall effectiveness.
5 RelatedWork
Explainable recommender systems aim to yield both recommendations and explanations [Zhang and Chen, 2018]. As such, user satisfaction as well as system effectiveness and transparency can be improved. The popular matrix factorization methods usually have troubles in interpreting the meanings of representation vectors. To tackle the issue, several models, such as explicit factor models [Zhang et al., 2014] and explainable matrix factorization [Abdollahi and Nasraoui, 2017], have been developed. In addition, graph learning is also leveraged, such as graph-based propagation [He et al., 2015] and graph clustering [Heckel et al., 2017]. More recently, deep learning is widely exploited for recommendation [Seo et al., 2017; Donkers et al., 2017].
Although explainable recommendation has been applied in many scenarios, the progress for POIs is limited. In [Wu and Ester, 2015], the authors propose a probabilistic model which combines aspect-based opinion mining and collaborative filtering to provide explainable recommendations. Besides, [Wang et al., 2018b] exploits a tree-enhanced embedding model for interpretable tourist and restaurant recommendation. In this paper, we study how to identify the key factors contributing to people's decisions on choosing POIs. We learn representations for interpretable factors to preserve decision structures, which differentiates our work from priors. With this "decision profiling" capability, we are able to make recommendations and, at the same time, provide the key factors behind as explanations.
Contextual representation learning proposes to tackle relationship-centric tasks and combinational problems via learning latent representations, and has been proven effective for various tasks [Hu et al., 2016; Zhou et al., 2019; Zhang et al., 2020]. Network embedding is among the most successful for capturing semantics of item interactions, e.g., LINE [Tang et al., 2015] and MetaPath2Vec [Dong et al., 2017]. Recently, [Wang et al., 2018a] represents a behavior as a multi-type itemset and learns the collective interactions of items to preserve the success rate of each behavior. Moreover, by learning good heuristics automatically from data, representation learning approaches have been exploited for combinatorial optimization problems [Vinyals et al., 2015; Khalil et al., 2017]. Our work also learns representations for a set of factors. However, we devise a novel scalar projection maximization objective, which has not been considered before. The self projection attention and L2-regularized sparse activation are also deeply coupled with our problem.
6 Concluding Remarks
In this paper, we studied user decision profiling to provide explanations for people's decisions. We represented each user decision as a set of factors and identified key factors. By learning factor representations, we showed that maximizing the sum of scalar projection of related factor embeddings on the aggregated embedding of key factors is a good objective to tackle the problem. Exactly solving the objective is not easy due to a sparsity constraint. We proposed to directly learn the likelihood of each factor to be a key factor, with a self projection attention and an L2-regularized sparse activation. Using real-world data, we conducted extensive experiments to demonstrate the advantage of our approach. It achieved the best performance for preserving user decision structures, which indirectly verified the goodness of the identified key factors. We also presented a case study to show the interpretability and usefulness of key factors.
Our solution could profile decisions in various domains as long as the decision factors are well defined. In the future, we are to explore automatic decision factor identification, which further enhances the practical applicability of our framework, and to construct benchmarks for user decision profiling.
Acknowledgments
This work is supported in part by National Key R&D Program of China 2018AAA0102301, NSFC 71531001 & 61925203 & U1636210 & 61421003. For any correspondence, please refer to Shuai Ma and Hui Xiong.
@inproceedings{ijcai2020p478,
  title     = {Why We Go Where We Go: Profiling User Decisions on Choosing POIs},
  author    = {Hu, Renjun and Lu, Xinjiang and Liu, Chuanren and Li, Yanyan and Liu, Hao and Gu, Jingjing and Ma, Shuai and Xiong, Hui},
  booktitle = {Proceedings of the Twenty-Ninth International Joint Conference on
               Artificial Intelligence, {IJCAI-20}},
  publisher = {International Joint Conferences on Artificial Intelligence Organization},
  editor    = {Christian Bessiere},
  pages     = {3459--3465},
  year      = {2020},
  month     = {7},
  note      = {Main track},
  doi       = {10.24963/ijcai.2020/478},
  url       = {https://doi.org/10.24963/ijcai.2020/478},
}
TY - CPAPER TI - Why We Go Where We Go: Profiling User Decisions on Choosing POIs AU - Hu, Renjun AU - Lu, Xinjiang AU - Liu, Chuanren AU - Li, Yanyan AU - Liu, Hao AU - Gu, Jingjing AU - Ma, Shuai AU - Xiong, Hui T2 - Proceedings of the Twenty-Ninth International Joint Conference on Artificial Intelligence, IJCAI-20 PB - International Joint Conferences on Artificial Intelligence Organization PY - 2020 SP - 3459 EP - 3465 DO - 10.24963/ijcai.2020/478 UR - https://doi.org/10.24963/ijcai.2020/478 ER -Copied
Machine-readable versions of this paper, for tools and AI agents:





