
RM-CVaR: Regularized Multiple β-CVaR Portfolio
Proceedings of the Twenty-Ninth International Joint Conference on Artificial Intelligence. Special Track on AI in FinTech. Pages 4562-4568.
https://doi.org/10.24963/ijcai.2020/629
Keywords
- Other areas: Financial decision-support system
- AI for trading: General
- AI for wealth: AI for roboadvising
- AI for risk and security: AI for financial risk analytics
- AI for trading: AI for portfolio analytics
- AI for risk and security: AI for institutional risk modeling
Abstract
The problem of finding the optimal portfolio for investors is called the portfolio optimization problem. Such problem mainly concerns the expectation and variability of return (i.e., mean and variance).
Although the variance would be the most fundamental risk measure to be minimized, it has several drawbacks.
Conditional Value-at-Risk (CVaR) is a relatively new risk measure that addresses some of the shortcomings of well-known variance-related risk measures, and because of its computational efficiencies, it has gained popularity.
CVaR is defined as the expected value of the loss that occurs beyond a certain probability level (β).
However, portfolio optimization problems that use CVaR as a risk measure are formulated with a single β and may output significantly different portfolios depending on how the β is selected.
We confirm even small changes in β can result in huge changes in the whole portfolio structure.
In order to improve this problem, we propose RM-CVaR: Regularized Multiple β-CVaR Portfolio.
We perform experiments on well-known benchmarks to evaluate the proposed portfolio.
Compared with various portfolios, RM-CVaR demonstrates a superior performance of having both higher risk-adjusted returns and lower maximum drawdown.
- [Ardia et al., 2017] David Ardia, Guido Bolliger, Kris Boudt, and Jean-Philippe Gagnon-Fleury. The impact of covariance misspecification in risk-based portfolios. An- nals of Operations Research, 254(1-2):1-16, 2017.
- [Artzner et al., 1999] Philippe Artzner, Freddy Delbaen, Jean-Marc Eber, and David Heath. Coherent measures of risk. Mathematical finance, 9(3):203-228, 1999.
- [Brandt, 2010] Michael W Brandt. Portfolio choice prob- lems. In Handbook of financial econometrics: Tools and techniques, pages 269-336. Elsevier, 2010.
- [DeMiguel et al., 2007] Victor DeMiguel, Lorenzo Gar- lappi, and Raman Uppal. Optimal versus naive diversi- fication: How inefficient is the 1/n portfolio strategy? The review of Financial studies, 22(5):1915-1953, 2007.
- [DeMiguel et al., 2009] Victor DeMiguel, Lorenzo Gar- lappi, Francisco J Nogales, and Raman Uppal. A gener- alized approach to portfolio optimization: Improving per- formance by constraining portfolio norms. Management science, 55(5):798-812, 2009.
- [Fama and French, 1992] Eugene F Fama and Kenneth R French. The cross-section of expected stock returns. the Journal of Finance, 47(2):427-465, 1992.
- [Fan et al., 2012] Jianqing Fan, Jingjin Zhang, and Ke Yu. Vast portfolio selection with gross-exposure con- straints. Journal of the American Statistical Association, 107(498):592-606, 2012.
- [Gotoh and Takeda, 2005] Jun-ya Gotoh and Akiko Takeda. A linear classification model based on conditional geomet- ric score. Pacific Journal of Optimization, pages 277-296, 2005.
- [Gotoh and Takeda, 2011] Jun-ya Gotoh and Akiko Takeda. On the role of norm constraints in portfolio selection. Computational Management Science, 8(4):323, 2011.
- [Gotoh et al., 2014] Jun-ya Gotoh, Akiko Takeda, and Rei Yamamoto. Interaction between financial risk measures and machine learning methods. Computational Manage- ment Science, 11(4):365-402, 2014.
- [Magdon-Ismail and Atiya, 2004] Malik Magdon-Ismail and Amir F Atiya. Maximum drawdown. Risk Magazine, 17(10):99-102, 2004.
- [Mansini et al., 2015] Renata Mansini, Włodzimierz Ogryczak, and M Grazia Speranza. Portfolio optimization with transaction costs. In Linear and Mixed Integer Programming for Portfolio Optimization, pages 47-62. Springer, 2015.
- [Markowitz, 1952] Harry Markowitz. Portfolio selection. The journal of finance, 7(1):77-91, 1952.
- [McNeil et al., 2005] Alexander J McNeil, Rüdiger Frey, Paul Embrechts, et al. Quantitative risk management: Concepts, techniques and tools, volume 3. Princeton uni- versity press Princeton, 2005.
- [Michaud, 1989] Richard O Michaud. The markowitz opti- mization enigma: Is 'optimized'optimal? Financial Ana- lysts Journal, 45(1):31-42, 1989.
- [Nakagawa et al., 2018] Kei Nakagawa, Mitsuyoshi Ima- mura, and Kenichi Yoshida. Risk-based portfolios with large dynamic covariance matrices. International Journal of Financial Studies, 6(2):52, 2018.
- [Pflug, 2000] Georg Ch Pflug. Some remarks on the value- at-risk and the conditional value-at-risk. In Probabilistic constrained optimization, pages 272-281. Springer, 2000.
- [Rockafellar et al., 2000] R Tyrrell Rockafellar, Stanislav Uryasev, et al. Optimization of conditional value-at-risk. Journal of risk, 2:21-42, 2000.
- [Shen and Wang, 2016] Weiwei Shen and Jun Wang. Port- folio blending via thompson sampling. In IJCAI, pages 1983-1989, 2016. IJCAI
- [Shen and Wang, 2017] Weiwei Shen and Jun Wang. Portfo- lio selection via subset resampling. In Thirty-First AAAI Conference on Artificial Intelligence, 2017.
- [Shen et al., 2014] Weiwei Shen, Jun Wang, and Shiqian Ma. Doubly regularized portfolio with risk minimization. In Twenty-Eighth AAAI Conference on Artificial Intelligence, 2014.
- [Shen et al., 2015] Weiwei Shen, Jun Wang, Yu-Gang Jiang, and Hongyuan Zha. Portfolio choices with orthogonal bandit learning. In Twenty-Fourth International Joint Con- ference on Artificial Intelligence, 2015. IJCAI
- [Shen et al., 2019] Weiwei Shen, Bin Wang, Jian Pu, and Jun Wang. The kelly growth optimal portfolio with ensemble learning. In Proceedings of the AAAI Conference on Arti- ficial Intelligence, volume 33, pages 1134-1141, 2019.
- [Takeda and Sugiyama, 2008] Akiko Takeda and Masashi Sugiyama. ν-support vector machine as conditional value- at-risk minimization. In Proceedings of the 25th interna- tional conference on Machine learning, pages 1056-1063, 2008.
- [Tibshirani, 1996] Robert Tibshirani. Regression shrinkage and selection via the lasso. Journal of the Royal Statistical Society: Series B (Methodological), 58(1):267-288, 1996.
- [Zou and Yuan, 2008] Hui Zou and Ming Yuan. Regular- ized simultaneous model selection in multiple quantiles regression. Computational Statistics & Data Analysis, 52(12):5296-5304, 2008.
References were extracted automatically from the PDF and may contain errors.
Full text extracted automatically from the PDF; figures, tables and equations may differ. The PDF is the version of record.
1 Introduction
The problem of finding the optimal portfolio for investors is called the portfolio optimization problem. Such problem mainly concerns the expectation and variability of return (i.e., mean and variance [Markowitz, 1952]). Although the variance would be the most fundamental risk measure to be minimized, it has several drawbacks. Controlling the variance leads to low deviation from the expected return with regard to both the downside and the upside. Hence, quantile-based risk measures, such as the Value-at-Risk (VaR) measure, which manages and controls the risk in terms of percentiles of the loss distribution, have been suggested. Instead of contemplating both the upside and downside of the expected return, the VaR measure considers only the downside of the expected return as the risk and represents the predicted maximum loss with a specified confidence level (e.g., 95%). The VaR measure has already been incorporated into several regulatory requirements, such as the Basel Accord II. Hence, it plays a particularly important role in risk analysis. However, the VaR measure, if studied in the framework of coherent risk measures [Artzner et al., 1999], lacks subadditivity, and, therefore, convexity in the case of general loss distributions (although it may be subadditive for special classes of the latter, e.g., normal distributions). This drawback entails both inconsistencies with the well-accepted principle of diversification, i.e., diversification reduces risk. For example, VaR output of two different investment portfolios may be greater than the sum of the individual VaR outputs. Also, the VaR measure is non-convex and non-smooth. It also has multiple local minimums, while the ideal is the global minimum [McNeil et al., 2005]. Besides, both variance and VaR ignore the magnitude of extreme or rare losses by their definition.
The Conditional Value-at-Risk (CVaR) measure addresses the abovementioned shortcomings of variance and VaR. This method is a relatively new risk measure, which has gained popularity. CVaR is defined as the expected value of the loss that occurs beyond a certain probability level (β). [Pflug, 2000] proved that the CVaR measure is a coherent risk measure which exhibits subadditivity and convexity. Additionally, [Rockafellar et al., 2000] showed that the minimization of CVaR results in a tractable optimization problem. For example, when the loss is defined as the minus return, and a finite number of historical observations of returns are used in estimating CVaR, its minimization can be presented as a linear program and solved efficiently.
However, portfolio optimization problems that use CVaR as a risk measure are formulated with a single β and are able to output significantly different portfolios depending on how the β is selected. We evaluated how the portfolio changes as the β level changes with well-known benchmarks. This is similar to the "error maximization" that [Michaud, 1989] pointed out in the case of the mean-variance portfolio. [Ardia et al., 2017; Nakagawa et al., 2018] empirically showed that the minimum variance portfolio weights are highly sensitive to the inputs. We confirmed that even small changes in β can result in huge changes in the whole portfolio structure.
On the other hand, several studies have either ignored transaction costs or only subtracted ad hoc transaction costs afterward [Shen et al., 2014]. When buying and selling assets on the markets, the investors incur payments of commissions and other costs, such as globally defined transaction costs that are charged by the brokers or the financial institutions serving as intermediaries. Transaction costs represent the most important feature to consider when selecting a real portfolio, given that they diminish net returns and reduce the amount of capital available for future investments [Mansini et al., 2015].
In order to address these problems, in this paper, we propose the RM-CVaR: Regularized Multiple β-CVaR portfolio to bridge the gap between risk minimization and cost reduction. To control transaction cost, we imposed the L1-regularization term as stated in [DeMiguel et al., 2009; Shen et al., 2014]. We were able to prove that the RM-CVaR Portfolio optimization problem is written as a linear programming problem like the single β-CVaR portfolio. We also performed experiments to evaluate the proposed portfolio. Compared with other portfolios, the RM-CVaR portfolio demonstrates a superior performance in terms of having higher riskadjusted returns and lower maximum drawdown.
2 RelatedWork
Because of these regularization and sparsity-inducing properties, there has been recent substantial interest in L1regularization in statistics and optimization, beginning with [Tibshirani, 1996]. Our approach is similar in spirit to that of [Zou and Yuan, 2008], given that our approach estimates the simultaneously approximating multiple conditional quantiles.
The more conventional regularization models have been investigated for the Markowitz's portfolio optimization problem by [DeMiguel et al., 2009; Fan et al., 2012; Shen et al., 2014]. They demonstrated superior portfolio performances when various types of norm regularities are combined. Analogously, [Gotoh and Takeda, 2011] considered L1 and L2norms for the mean-CVaR problem. Our paper extends this literature to multiple CVaR.
It is not hard to see that there is a connection between the portfolio optimization (risk minimization) and the optimization in machine learning [Gotoh et al., 2014]. Both methods estimate models that would achieve good out-of-sample performance.
[Shen et al., 2015; Shen and Wang, 2016] proposed to employ the bandit learning framework to attack portfolio problems. [Shen et al., 2015] presented a bandit algorithm for conducting online portfolio choices by effectually exploiting correlations among multiple arms. [Shen and Wang, 2016] proposed an online algorithm that leverages Thompson sampling into the sequential decision-making process for portfolio blending. Also, [Shen and Wang, 2017; Shen et al., 2019] applied a subset resampling algorithm into the mean-variance portfolio and the Kelly growth optimal portfolio to obtain promising results. Through resampling subsets of the original large datasets, [Shen and Wang, 2017; Shen et al., 2019] constructed the associated subset portfolios with more accurately estimated parameters without requiring additional data. However, these studies did not take transaction costs or turnover into account.
Interactions from portfolio optimization to machine learning include [Gotoh and Takeda, 2005; Takeda and Sugiyama,
2008]. [Gotoh and Takeda, 2005] were the first to point out the common mathematical structure employed both in the class of machine learning methods, known as ν-support vector machines (ν-SVMs), and in the CVaR minimization. However, [Takeda and Sugiyama, 2008] were the first to point out that the model of [Gotoh and Takeda, 2005] is equivalent to the machine learning methods called Eν-SVC.
Applying our method to machine learning algorithms is an important future task.
3 Preliminary
In this section, we define VaR and CVaR. After which, we formulate a portfolio optimization problem using both of them.
Let ri be the return of stock i (1 ≤ i ≤ n) and wi be the portfolio weight for stock i. wi is the portfolio weight for stock i. Here, ri is a random variable and follows the continuous probability density function p(r).
We denote r = (r1, ..., rn)⊤ and w = (w1, ...,wn)⊤. L(w, r) refers to loss function, e.g., L(w, r) = -w⊤r. The probability that the loss function is less than α is
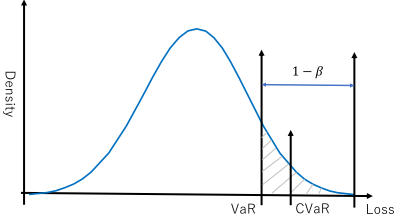
When w is fixed, Φ(w, α), as a function of α, is nondecreasing and is continuous from the right, but is generally non-continuous from the left. For simplicity, we assumed that Φ(w, α) is a continuous function with respect to α. Thereafter, VaR and CVaR were defined as follows (Figure 1).
Definition 3.1.
Definition 3.2.
It is difficult to directly optimize the foregoing CVaR because the integration interval depends on VaR. Therefore, to calculate φβ(w), we also defined F (w, α|β) as
Definition 3.3.
After which, the following relationship holds between φ (w|β) and F (w, α|β).
Lemma 3.1. For an arbitrarily fixed w, F (w, α|β) is convex and continuously differentiable as a function of α. φ (w|β) is given by minimizing F (w, α|β) with respect to α.
In this formula, the set consisting of the values of α for which the minimum is attained, i.e.,
is a non-empty closed bounded interval.
Proof. Proof is given in [Rockafellar et al., 2000].
CVaR is defined using the value of VaR, however, it is possible to obtain the CVaR value without obtaining VaR, according to this lemma. If X is a constraint that the portfolio must satisfy, the following lemma holds for the formulation of a portfolio optimization problem using CVaR as the risk measure.
Lemma 3.2. Minimizing the CVaR overall w ∈ X is equivalent to minimizing F (w, α|β) overall (w, α) ∈ X×R, in the sense thatmin
Furthermore, if f(w, r) is convex with respect to w, then F (w, α|β) is convex with respect to (w, α), and φ(w|β) is convex with respect to w. If X is a convex set, the minimization problem of φ(w|β) on w ∈ X can be formulated as a convex programming problem.
We approximated the function F (w, α|β) by sampling a random variable r from the density function p(r). When r[1], r[2], ..., r[q] are obtained through sampling or simple historical data, the function F (w, α|β) is approximated as follows.
Finally, we formulated the portfolio optimization problem with CVaR as a linear programming problem, as shown below.
Here, 1⊤w = 1 indicates the sum of all the portfolio weights, which is always equal to one. The 1 (left side) denotes a column vector with ones. In addition, wj ≥ 0 indicates that investors take a long position of the j-th asset.
4 RM-CVaR: RegularizedMultiple β-CVaR Portfolio
In this section, we propose a model that takes into account the multiple CVaR values. The purpose of the formulation is to minimize the margin between multiple β levels of CVaR.
Cβk is the value of CVaR obtained by solving Eq. (9)- (13). Then, we minimized C, considering that Cβk is a main problem of this research.
Problem 1.
F (w, α|β) is the function similar to the foregoing lemma 3.1
Using Eq. (16), Problem 1 can be written as follows.
Problem 2.
(18)
α = (α1, · · · , αK)⊤. Thereafter, we considered the following Problem 3.
Problem 3.
Here, the following lemma holds between Problem 2 and 3.
Lemma 4.1. (1)If (w∗ ,C ∗ ) is the optimal value for Eq. (2), then (w∗ ,C ∗ , α∗ ) is the optimal value of Eq. (3). (2)If (w∗∗ ,C ∗∗ , α∗∗ ) is the optimal value for Eq. (3), then (w∗∗ ,C ∗∗ ) is the optimal value for Eq. (2).
Proof. We assumed that (w∗ ,C ∗ ) is the optimal value for Problem 2. Given that (w∗ , C ∗ ) is a feasible solution of Problem 2, minαi F (w∗ , αk|βk) ≤ C ∗ + Cβk holds. We defined α∗ = (α1, . . . , αK)⊤ as α∗k := argminαk F (w∗ , αk|βk). Then, (w∗ ,C ∗ , α∗ ) became a feasible solution of Problem 3 since F (w∗ , α∗k |βk) ≤ C ∗ + Cβk holds. If (w∗ ,C ∗ , α∗ ) is not the optimal solution of Problem 3, there exists a feasible solution ( ˆw, ˆ C, ˆα) satisfying ˆ C < C ∗ . Then, minαk F ( ˆw, ˆαk|βk) ≤ ˆ C +Cβk (k = 1, ..., K) holds. Therefore ( ˆw, ˆ C) is a feasible solution of Problem 2, thereby contradicting that C∗ is the optimal solution of Problem 2. We assumed that (w∗∗ ,C ∗∗ , α∗∗ ) is the optimal value for Problem 3. Then, because (w∗∗ ,C ∗∗ , α∗∗ ) is a feasible solution of Problem 3, F (w∗∗ , α∗∗ i |βi) ≤ C ∗∗ + Cβi (i = 1, ...,m) holds. (w∗∗ ,C ∗∗ ) is a feasible solution for Problem 2 given that minαi F (w∗∗ , αi|βi) ≥ F (w∗∗ , α∗∗ i |βi) ≤
C ∗∗ +Cβi (i = 1, ...,m) holds. if (w∗∗ ,C ∗∗ ) is not the optimal solution of Problem 2, there exists a feasible solution ( ˆw, ˆ C) satisfying ˆ C < C ∗∗ . We defined ˆα = (ˆα1, ..., ˆαm)⊤ as ˆαi := arg min αi Fβi ( ˆw, αi). Then, ( ˆw, ˆ C, ˆα) became a feasible solution of Problem 3, thereby contradicting that C ∗∗ is
the optimal solution of Problem 3.
According to the lemma 4.1, Problem 1 and 3 are equivalent. When r[1], . . . , r[Q] are obtained through sampling, the function F (w, α|β) is approximated as follows.
Finally, we derived the Regularized Multiple β-CVaR Portfolio, where the objectives are minimizing multiple CVaR values and controlling the portfolio turnover. The changes of the turnover during each rebalancing period are directly related to transaction costs, market impacts, and taxes. Controlling the portfolio turnover is realized through imposing the L1-regularization term as
where wi denotes the portfolio weight before rebalancing.
Based on the foregoing, the Regularized Multiple β-CVaR Portfolio optimization problem can be formulated as follows:
Problem 4.
We can easily prove that Problem is a linear programming problem similar to the usual CVaR minimization problem.
Theorem 4.1. The Regularized Multiple β CVaR Portfolio optimization problem is equivalent to the following linear programming problem.
Proof. Using a standard approach in optimization, we replaced each absolute value term λ‖w-w-‖1 with sof tmax. Thereafter, the objective and constraints all became linear.
5 Experiment
In this section, we report the results of our empirical studies with well-known benchmarks. First, we evaluated how the portfolio changes as the β level changes. Depending on how β is chosen, a completely different portfolio may be constructed. Next, we compared the out-of-sample performance among several portfolio strategy, including our proposed portfolio strategy.
5.1 Dataset
In the experiments, we used well-known academic benchmarks called Fama and French (FF) datasets [Fama and French, 1992] to ensure the reproducibility of the experiment. This FF dataset is public and is readily available to anyone. The FF datasets have been recognized as standard datasets and heavily adopted in finance research because of their extensive coverage of asset classes and very long historical data series. We used the FF25 dataset and the FF48 dataset. For example, the FF25 dataset includes 25 portfolios formed on the basis of size and book-to-market ratio; while the FF48 dataset contains monthly returns of 48 portfolios representing different industrial sectors. We used both datasets as monthly data from January 1989 to December 2018.
5.2 Experimental Settings
In our empirical studies, the tested portfolio models have the following meanings:
- "1/N" stands for equally-weighted (1/N) portfolio [DeMiguel et al., 2007].
- "MV" stands for minimum-variance portfolio. We used the latest 10 years (120 months) to compute for the covariance matrix.
- "DRP" stands for the doubly regularized minimumvariance portfolio [Shen et al., 2014]. We used the latest 10 years (120 months) to compute for the covariance matrix. We set combinations of two coefficients for regularization terms to λ1 = {0.001, 0.005, 0.01, 0.05} and λ2 = {0.001, 0.005, 0.01, 0.05}.
- "EGO" stands for the Kelly growth optimal portfolio with ensemble learning [Shen et al., 2019]. We set n1 (number of resamples) = 50, n2 (size of each resample) = 5τ, τ (number of periods of return data) = 120, n3 (number of resampled subsets) = 50, n4 (size of each subset) = n0.7 , where n is number of assets.
- "CVaR" stands for minimum CVaR portfolio with β. We implemented five patterns of β = {0.95, 0.96, 0.97, 0.98, 0.99}. We used the latest 10 years (120 months) to calculate each model.
- "ACVaR" stands for the average portfolio calculated by the average of minimum CVaR portfolio of different β = {0.95, 0.96, 0.97, 0.98, 0.99} at each time point.
- "RM-CVaR" stands for our proposed portfolio. We set K = 5 (k = 1, ...,K) as five patterns of βk = {0.95, 0.96, 0.97, 0.98, 0.99} to calculate Cβk . We also set Q (number of sampling periods of return data) as {10
Algorithm 1 RM-CVaR Portfolio
Input: K probability levels βk ∈ (0, 1) (k = 1, . . . ,K),
a coefficient of the regularization term λ ∈ R+ and
- a sample size Q ∈ Z+
- a return matrix Y ∈ Rn×Tall
Output: a weight matrixW ∈ Rn×T
1: for t = Tall -T +1, . . . , Tall do
- 2: R← Y [1 : t]
- 3: Resample Q samples fromR
- 4: Solve the linear programming introduced in Theorem 4.1
- 5: Contain the solution w∗ toW [t]
- 6: end for
- 7: return W
years (120 months), 7 years (84 months)}. For the coefficient of the regularization term, we implemented four patterns of λ = {0.001, 0.005, 0.01, 0.05}. We likewise implemented λ = 0 to compare with the best RM-CVaR. The RM-CVaR portfolio presented in Algorithm 1 was straightforward in terms of implementation.
We used the first-half period, i.e., from January 1989 to December 2003, as the in-sample period in terms of deciding the hyper-parameters of each model. After that, we used the second half-period, i.e., from January 2004 to December 2018, as the out-of-sample period. Each portfolio was updated by sliding one-month-ahead.
5.3 Performance Measures
In the first experiment, we defined the weight difference of two minimum CVaR portfolios, which have βi and βj , as the following:
We set βi and βj as {0.96, 0.95}, {0.97, 0.96}, {0.98, 0.97}, and {0.99, 0.98}. A large Diff indicates that the two portfolios are different. This measure is similar to turnover, as defined below.
Next, we compared the out-of-sample performance of the portfolios. In evaluating the portfolio strategy, we used the following measures that are widely used in the field of finance [Brandt, 2010].
The portfolio return at time t is defined as
where rit is the return of i asset at time t, wit-1 is the weight of i asset in the portfolio at time t - 1, and n is the number of assets. We evaluated the portfolio strategy using its annualized return (AR), the risk as the standard deviation of return (RISK), and the risk/return (R/R) (return divided by risk) as the portfolio strategy. R/R is a risk-adjusted return measure for a portfolio strategy.
| β | {96,95} | {97,96} | {98,97} | {99,98} | Avg |
| FF25 | 42.66% | 43.72% | 48.77% | 57.61% | 48.19% |
| FF48 | 23.95% | 36.13% | 25.20% | 72.28% | 39.39% |
| Avg | 33.31% | 39.93% | 36.99% | 64.95% | 43.79% |
Here, µ = (1/T ) ∑Tt=1 Rt is the average return of the portfolio.
We also evaluated the maximum drawdown (MaxDD), which is another widely used risk measure [Magdon-Ismail and Atiya, 2004; Shen and Wang, 2017], for the portfolio strategy. In particular, MaxDD is defined as the largest drop from an extremum:
where Wk is the cumulative return of the portfolio until time k.
The turnover (TO) indicates the volumes of rebalancing. Since a high TO inevitably generates high explicit and implicit trading costs, the portfolio return is reduced. The foregoing has been recognized as an important performance metric. The one-way annualized turnover is calculated as an average absolute value of the rebalancing trades over all the trading periods:
where T - 1 indicates the total number of the rebalancing periods and wt-1 is the re-normalized portfolio weight vector before rebalance.
where rt is the return vector of the assets at time t, wt-1 is the weight vector at time t - 1, and the operator ⊗ denotes the Hadamard product.
5.4 Experimental Results
Table 1 shows the weight difference of two minimum CVaR portfolios in the out-of-sample period. Only 1% difference in the β level changes the portfolio weight on average by 48%
| FF25 | EW | MV | DRP | EGO | ACVaR | CVaR | RM-CVaR | |||||
|---|---|---|---|---|---|---|---|---|---|---|---|---|
| 95 | 96 | 97 | 98 | 99 | λ = 0 | Best λ | ||||||
| AR [%] | 8.27 | 8.45 | 8.48 | 8.58 | 8.48 | 8.46 | 8.36 | 8.35 | 8.73 | 8.42 | 9.03 | 8.95 |
| RISK [%] | 18.13 | 15.24 | 15.67 | 18.71 | 15.62 | 16.15 | 15.42 | 15.54 | 15.64 | 15.74 | 16.23 | 15.11 |
| R/R | 0.46 | 0.55 | 0.54 | 0.46 | 0.54 | 0.52 | 0.54 | 0.54 | 0.56 | 0.53 | 0.56 | 0.59 |
| MaxDD [%] | -57.63 | -58.14 | -61.21 | -61.76 | -59.44 | -57.75 | -56.75 | -60.81 | -59.54 | -62.21 | -54.14 | -52.81 |
| TO [%] | 16.95 | 31.10 | 8.75 | 71.52 | 22.19 | 17.46 | 19.99 | 24.97 | 21.52 | 29.98 | 1000.98 | 33.57 |
| FF48 | MV | DRP | EGO | ACVaR | CVaR | RM-CVaR | ||||||
| EW | 95 | 96 | 97 | 98 | 99 | λ = 0 | Best λ | |||||
| AR [%] | 8.14 | 8.99 | 9.09 | 11.11 | 11.83 | 11.68 | 10.79 | 11.54 | 11.96 | 12.92 | 15.75 | 17.29 |
| RISK [%] | 19.27 | 11.77 | 11.77 | 20.61 | 12.53 | 12.27 | 11.87 | 12.42 | 13.47 | 14.49 | 16.46 | 15.61 |
| R/R | 0.42 | 0.76 | 0.77 | 0.54 | 0.94 | 0.95 | 0.91 | 0.93 | 0.89 | 0.89 | 0.96 | 1.11 |
| MaxDD [%] | -59.81 | -50.84 | -50.25 | -57.39 | -47.22 | -46.98 | -45.21 | -45.36 | -48.23 | -50.38 | -35.29 | -34.93 |
| TO [%] | 36.73 | 27.48 | 17.15 | 75.80 | 37.04 | 41.31 | 38.87 | 35.37 | 41.57 | 38.36 | 960.03 | 750.48 |
in FF25 and 39% in FF48. We confirmed that the CVaR portfolio weights are highly sensitive to the β levels.
Table 2 reports the overall performance measures of RMCVaR, our proposed portfolio, and the 10 compared portfolios introduced in Section 5.2. Among the comparisons of the various portfolios, the best performance is highlighted in bold. In both datasets, the proposed RM-CVaR with λ achieved the highest R/R and the lowest MaxDD. Unsurprisingly, RM-CVaR differed from ACVaR, which is the simple average of five CVaR portfolios. RM-CVaR likewise exceeded the individual β levels of CVaR in terms of R/R and MaxDD. In the FF25 datasets, RM-CVaR without λ outperformed all the compared portfolios in terms of AR but it had the worst TO. After introducing the regularization term λ, the TO was considerably suppressed, while RISK, R/R, and MaxDD remained as the best values. In the FF48 datasets, RM-CVaR with λ had the best AR, R/R, and MaxDD, but its TO was very high. This is because the λ selected in this experiment was unable to sufficiently suppress TO.
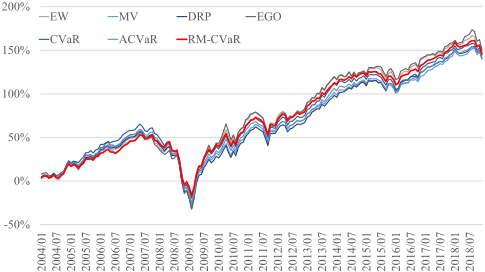
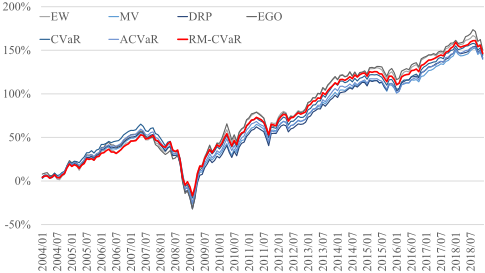
Furthermore, in order to compare the trend and dynamics of each of the portfolio returns, Figures 2 and 3 show the cumulative return over the out-of-sample periods for the FF25 and FF48 datasets. Although there is not much difference in the FF25 dataset, RM-CVaR apparently outperformed the others with the visible margins in the FF48 datasets in most of the time periods. Therefore, we were able to confirm that RM-CVaR avoids a large drawdown.
6 Conclusion
Our study makes the following contributions:
- We propose RM-CVaR: Regularized Multiple β-CVaR Portfolio. We were able to prove that the optimization problem is written as a linear programming.
- We demonstrated that the CVaR portfolio dramatically changes depending on the β level.
- RM-CVaR exhibited a superior performance in terms of having both higher risk-adjusted returns and lower maximum drawdown.
Our future work shall include incorporating the subsampling method such as that in [Shen and Wang, 2017; Shen et al., 2019].
@inproceedings{ijcai2020p629,
  title     = {RM-CVaR: Regularized Multiple β-CVaR Portfolio},
  author    = {Nakagawa, Kei and Noma, Shuhei and Abe, Masaya},
  booktitle = {Proceedings of the Twenty-Ninth International Joint Conference on
               Artificial Intelligence, {IJCAI-20}},
  publisher = {International Joint Conferences on Artificial Intelligence Organization},
  editor    = {Christian Bessiere},
  pages     = {4562--4568},
  year      = {2020},
  month     = {7},
  note      = {Special Track on AI in FinTech},
  doi       = {10.24963/ijcai.2020/629},
  url       = {https://doi.org/10.24963/ijcai.2020/629},
}
TY - CPAPER TI - RM-CVaR: Regularized Multiple β-CVaR Portfolio AU - Nakagawa, Kei AU - Noma, Shuhei AU - Abe, Masaya T2 - Proceedings of the Twenty-Ninth International Joint Conference on Artificial Intelligence, IJCAI-20 PB - International Joint Conferences on Artificial Intelligence Organization PY - 2020 SP - 4562 EP - 4568 DO - 10.24963/ijcai.2020/629 UR - https://doi.org/10.24963/ijcai.2020/629 ER -Copied
Machine-readable versions of this paper, for tools and AI agents:





