
Prediction of Mild Cognitive Impairment Conversion Using Auxiliary Information
Proceedings of the Twenty-Eighth International Joint Conference on Artificial Intelligence. Main track. Pages 4475-4481.
https://doi.org/10.24963/ijcai.2019/622
Keywords
- Machine Learning: Feature Selection ; Learning Sparse Models
- Machine Learning: Multi-instance;Multi-label;Multi-view learning
- Machine Learning: Classification
Abstract
In this paper, we propose a new feature selection method to exploit the issue of High Dimension Low Sample Size (HDLSS) for the prediction of Mild Cognitive Impairment (MCI) conversion. Specially, by regarding the Magnetic Resonance Imaging (MRI) information of MCI subjects as the target data, this paper proposes to integrate auxiliary information with the target data in a unified feature selection framework for distinguishing progressive MCI (pMCI) subjects from stable MCI (sMCI) subjects, i.e., the MCI conversion classification for short in this paper, based on their MRI information. The auxiliary information includes the Positron Emission Tomography (PET) information of the target data, the MRI information of Alzheimer’s Disease (AD) subjects and Normal Control (NC) subjects, and the ages of the target data and the AD and NC subjects. As a result, the proposed method jointly selects features from the auxiliary data and the target data by taking into account the influence of outliers and aging of these two kinds of data. Experimental results on the public data of Alzheimer’s Disease Neuroimaging Initiative (ADNI) verified the effectiveness of our proposed method, compared to three state-of-the-art feature selection methods, in terms of four classification evaluation metrics.
- [Chang and Lin, 2011] Chih-Chung Chang and Chih-Jen Lin. LIBSVM: a library for support vector machines. ACM Transactions on Intelligent Systems and Technology, 2(3):27, 2011.
- [Cheng et al., 2015] Bo Cheng, Mingxia Liu, Daoqiang Zhang, Brent C Munsell, and Dinggang Shen. Domain transfer learning for MCI conversion prediction. IEEE Transactions on Biomedical Engineering, 62(7):1805- 1817, 2015.
- [Coupé et al., 2012] Pierrick Coupé, Simon F Eskildsen, José V Manjón, et al. Scoring by nonlocal image patch estimator for early detection of Alzheimer's disease. Neu- roImage: Clinical, 1(1):141-152, 2012.
- [Eskildsen et al., 2013] Simon F Eskildsen, Pierrick Coupé, Daniel García-Lorenzo, et al. Prediction of Alzheimer's disease in subjects with mild cognitive impairment from the ADNI cohort using patterns of cortical thinning. Neu- roImage, 65:511-521, 2013.
- [Forlenza et al., 2019] Orestes V Forlenza, Márcia Radanovic, Leda L Talib, and Wagner F Gattaz. Clinical and biological effects of long-term lithium treatment in older adults with amnestic mild cognitive impair- ment: randomised clinical trial. The British Journal of Psychiatry, pages 1-7, 2019.
- [Franke et al., 2010] Katja Franke, Gabriel Ziegler, Stefan Klöppel, et al. Estimating the age of healthy subjects from T1-weighted MRI scans using kernel methods: Ex- ploring the influence of various parameters. NeuroImage, 50(3):883-892, 2010.
- [Lei and Zhu, 2018] Cong Lei and Xiaofeng Zhu. Unsu- pervised feature selection via local structure learning and sparse learning. Multimedia Tools and Applications, 77(22):29605-29622, 2018.
- [Misra et al., 2009] Chandan Misra, Yong Fan, and Christos Davatzikos. Baseline and longitudinal patterns of brain at- rophy in MCI patients, and their use in prediction of short- term conversion to AD: results from ADNI. Neuroimage, 44(4):1415-1422, 2009.
- [Moradi et al., 2015] Elaheh Moradi, Antonietta Pepe, Christian Gaser, et al. Machine learning framework for early MRI-based Alzheimer's conversion prediction in MCI subjects. NeuroImage, 104:398-412, 2015.
- [Peng and Fan, 2017] Hanyang Peng and Yong Fan. A gen- eral framework for sparsity regularized feature selection via iteratively reweighted least square minimization. In AAAI, pages 2471-2477, 2017.
- [Spasov et al., 2019] Simeon Spasov, Luca Passamonti, An- drea Duggento, Pietro Lio, Nicola Toschi, Alzheimer's Disease Neuroimaging Initiative, et al. A parameter- efficient deep learning approach to predict conversion from mild cognitive impairment to alzheimer's disease. Neuroimage, 189:276-287, 2019.
- [Wang et al., 2017] Rong Wang, Feiping Nie, Richang Hong, Xiaojun Chang, Xiaojun Yang, and Weizhong Yu. Fast and orthogonal locality preserving projections for di- mensionality reduction. IEEE Transactions on Image Pro- cessing, 26(10):5019-5030, 2017.
- [Weiner et al., 2017] Michael W. Weiner, Dallas P. Veitch, Paul S. Aisen, Laurel A. Beckett, Nigel J. Cairns, Robert C. Green, Danielle Harvey, Clifford R. Jack, William Jagust, John C. Morris, Ronald C. Petersen, Andrew J. Saykin, Leslie M. Shaw, Arthur W. Toga, and John Q. Trojanowski. Recent publications from the alzheimer's disease neuroimaging initiative: Reviewing progress toward improved ad clinical trials. Alzheimer's & Dementia, 13(4):e1 -e85, 2017.
- [Ye et al., 2011] Dong Hye Ye, Kilian M Pohl, and Christos Davatzikos. Semi-supervised pattern classification: appli- cation to structural MRI of Alzheimer's disease. In PRNI, pages 1-4, 2011.
- [Young et al., 2013] Jonathan Young, Marc Modat, Manuel J Cardoso, et al. Accurate multimodal probabilistic predic- tion of conversion to Alzheimer's disease in patients with mild cognitive impairment. NeuroImage: Clinical, 2:735- 745, 2013.
- [Zhu et al., 2014] Hongtu Zhu, Zakaria Khondker, Zhaohua Lu, and Joseph G Ibrahim. Bayesian generalized low rank regression models for neuroimaging phenotypes and ge- netic markers. Journal of the American Statistical Associ- ation, 109(507):977-990, 2014.
- [Zhu et al., 2016] Xiaofeng Zhu, Heung-Il Suk, Seong- Whan Lee, and Dinggang Shen. Subspace regularized sparse multitask learning for multiclass neurodegenerative disease identification. IEEE Transactions on Biomedical Engineering, 63(3):607-618, 2016.
- [Zhu et al., 2017] Xiaofeng Zhu, Heung-Il Suk, Li Wang, Seong-Whan Lee, Dinggang Shen, et al. A novel relational regularization feature selection method for joint regression and classification in ad diagnosis. Medical image analysis, 38:205-214, 2017.
- [Zhu et al., 2018] Xiaofeng Zhu, Hongming Li, and Yong Fan. Parameter-free centralized multi-task learning for characterizing developmental sex differences in resting state functional connectivity. In AAAI, 2018.
- [Zou and Hastie, 2005] Hui Zou and Trevor Hastie. Regular- ization and variable selection via the elastic net. Journal of the Royal Statistical Society: Series B (Statistical Method- ology), 67(2):301-320, 2005.
References were extracted automatically from the PDF and may contain errors.
Full text extracted automatically from the PDF; figures, tables and equations may differ. The PDF is the version of record.
1 Introduction
Alzheimer's Disease (AD) is a chronic neurodegenerative disease to slowly and gradually worsen human brain over time, and has been becoming the most common dementia in many countries. By considering the development and prevalence of AD, the early stage of AD pathology, i.e., Mild Cognitive Impairment (MCI), has been demonstrated to be the optimal stage that clinical treatments could be effectively investigated to prevent MCI conversion [Spasov et al., 2019; Zhu et al., 2016]. Clinically, it is essential to conduct MCI conversion classification by distinguishing pMCI subjects (who possibly progress to AD) from sMCI subjects (who may remain stable in the progress of MCI for a long time) based on their neuroimaging data [Forlenza et al., 2019; Weiner et al., 2017].
It is very challenging to differentiate the pMCI subjects from the sMCI subjects in an individual level based on their neuroimaging data due to the following reasons. First, the pMCI has small inter-group difference from the sMCI so that many studies of AD diagnosis integrate the pMCI with the sMCI as a single category, i.e., MCI. Second, there is high intra-group variations for either pMCI subjects or sMCI subjects. That is, different subjects in the same sub-category (i.e., either the pMCIs or the sMCIs) have high intra-group variations, which makes difficult construct robust classification models. Last but not least, the number of MCI subjects is small, but the dimensions of their features are usually high. In this case, the issue of High Dimension Low Sample Size (HDLSS) is often found so that the MCI conversion classification easily results in the problem of curse of dimensionality. As a result, previous classification models are usually affected by redundant features and subject-level noise. Hence, it is very vital to investigate informative and discriminative patterns to address above issues for achieving high diagnosis accuracy.
In the literature, machine learning techniques based on neuroimaging data, such as Magnetic Resonance Imaging (MRI), Positron Emission Tomography (PET), and CerebroSpinal Fluid (CSF), have been proposed to address a part of above issues [Weiner et al., 2017]. For example, [Zhu et al., 2017] investigated a joint regression and classification model on both the MRI data and the PET data to conduct the MCI conversion classification. [Zhu et al., 2014] considered the influence of ages (e.g., taking the ages of the subjects as a feature) to detect the association between MRI data and genetic data, with the assumption that brain atrophy may be influenced by the normal aging as well as the AD [Moradi et al., 2015]. [Wang et al., 2017] first assumed that the relationship between the AD and the Normal Control (NC) is similar to the relationship between the pMCI (i.e., AD-like) and the sMCI (i.e., NC-like), and then employed the information of AD and NC to improve the robustness of the MCI conversion classification.
Previous machine learning techniques for the MCI conversion classification have the following common characteristics, i.e., the auxiliary information is sequentially or partly used for constructing a prediction model. Normally, by regarding the MRI information of MCI subjects as the target data, the auxiliary information includes the ages of the target data, the MRI information of AD subjects and NC subjects, the PET and genetic information of the target data, etc. Moreover, each kind of auxiliary information is heterogenous to others (including other auxiliary information and the target data) as they are with different data structures and data distributions. Hence, integrating these information for the MCI conversion classification is complex as well as practical for the AD study.
In this paper, we consider the MRI data of the MCI subjects as the target data to propose a new sparse feature selection model for conducting the MCI conversion classification. Specifically, our proposed model integrates all kinds of auxiliary data with the target data for feature selection, it thus makes the best use of auxiliary information to improve the robustness of the classification on the target data. In our method, the auxiliary information includes the ages of both the target data and the auxiliary data (i.e., the AD subjects and NC subjects), the PET information of the target data as the ADNI dataset only provided PET data for some subjects and providedMRI data for all subjects, and the MRI information of AD subjects and NC subjects. To do this, our proposed method includes three key factors, i.e., (1) feature selection: we use all kinds of auxiliary data to select informative features of the target data; (2) outlier influence reduce: our formulation is robust to outliers for both the auxiliary data and the target data; (3) aging effect removal: we regard the ages of the subjects as one feature firstly, and then integrate it with neuroimaging features to form the feature matrix of our prediction model. Finally, we use our proposed feature selection model to select features from the target data, and then use a linear Support Vector Machine (SVM) to conduct the MCI conversion classification.
Compared to previous studies of the MCI conversion classification, the main contributions of our proposed method are summarized as follows.
- Our proposed method considers three kinds of auxiliary information to jointly select features in a unified framework. It is noteworthy that previous methods [Eskildsen et al., 2013; Ye et al., 2011; Cheng et al., 2015; Moradi et al., 2015] only used a part of them sequentially. We argue that auxiliary information can provide complementary information to the target data in some ways, while utilizing a part of all auxiliary information separately and sequentially is limited for the MCI conversion classification.
- Our proposed method conducts feature selection by taking into account the influence of outliers in both the auxiliary data and the target data as well as the relationship between the auxiliary data and the target data. By contrast, [Moradi et al., 2015] used the auxiliary data for feature selection only, while [Cheng et al., 2015] used both the target data and the auxiliary data, but not taking the influence of their outliers into account.
- Our proposed method integrates three kinds of auxiliary data with the target data to remove their heterogeneity. The experimental results on the public data
of Alzheimer's Disease Neuroimaging Initiative (ADNI) verified the effectiveness of our proposed method, compared to the state-of-the-art feature selection methods. Obviously, our proposed framework can be easily applied for other methods for the MCI conversion classification [Zhu et al., 2014; Moradi et al., 2015] and previous methods of the AD study [Zhu et al., 2017].
2 Method
In this paper, we denote matrices, vectors, and scalars, respectively, by boldface uppercase letters, boldface lowercase letters, and normal italic letters. Specifically, we denote the MRI feature matrix, the PET feature matrix, and the label matrix, respectively, for nt subjects of pMCI and sMCI, as Xt ∈ Rnt×d , Xp ∈ Rnt×d , and Yt ∈ {0, 1}nt×ct , where d denotes the number of features and ct is the class number of the target data. We also denote the MRI feature matrix and the label matrix, of na subjects of AD and NC, respectively, as Xa ∈ Rna×d and Ya ∈ {0, 1}na×ca , where ca is the class number of the auxiliary data. We further denote the age factors of the target data and the auxiliary data, as xtg ∈ Rnt and xag ∈ Rna , respectively. In this work, we only focus on the binary classification problem, i.e., ct = ca = 2. However, it is straightforward to extend our proposed framework to a multi-class classification problem.
2.1 Feature Selection on Target Data
Given the target data Xt and its corresponding label information matrix Yt, a robust sparse regression method linearly estimates a coefficient matrixWt ∈ Rd×ct by optimizing the following objective function:
where λ is the non-negative tuning parameter. The ℓ2,1-norm loss function, i.e., a robust loss function in first term of Eq. (1), makes Eq. (1) robust against the subject-level outliers. Specifically, each row of (Yt - XtWt) in Eq. (1) corresponds to the prediction residual of one subject. Under the ℓ2,1-norm operation, the residual values of each row (i.e., subject) are combined via ℓ2-norm, i.e., the square root of the sum of the squares, and thus are less affected by the outliers, compared to the least square loss function [Lei and Zhu, 2018]. The ℓ2,1-norm regularization term on Wt penalizesWt by encouraging the row sparsity, i.e., all elements of some rows ofWt are all zeros, to select the corresponding features in Xt.
2.2 Feature Selection on Target and Auxiliary Data
Using Eq. (1) directly on the target data (i.e., the MRI features of the pMCI and sMCI subjects) for the MCI conversion classification could still be ineffective due to the limited training data. To circumvent the lack of training samples, recent studies [Coup´e et al., 2012; Moradi et al., 2015; Ye et al., 2011; Young et al., 2013] exploited auxiliary information from non-target groups, e.g., AD and NC subjects. The rationale of using such auxiliary data is that in terms of the AD pathological spectrum, i.e., the sMCI is closer to the NC while the pMCI is closer to the AD. Thus, the features that are informative for the AD/NC separation could be also useful for the pMCI/sMCI separation, i.e., the MCI conversion classification [Coup´e et al., 2012; Young et al., 2013]. In this paper, we also utilize such auxiliary data for feature selection. However, unlike previous methods [Ye et al., 2011; Young et al., 2013] that mostly first learned a classification model over only the auxiliary data and then transferred the learned model to build a target-oriented model, we devise a novel sparse feature selection model that jointly exploits both the target data and the auxiliary data.
With the assumption that MRI features selected for the AD/NC classification could be also informative for the MCI conversion classification, we propose to use MRI features of AD and NC subjects (i.e., auxiliary data Xa), to help in selecting MRI features of pMCI and sMCI subjects, as follows:
where Wa ∈ Rd×ca is a coefficient matrix for the auxiliary data, λ1 and λ2 are non-negative tuning parameters. The reason to use ℓ2,1-norm on the loss function of auxiliary data (i.e., the second term in Eq. (2)) is similar to Eq. (1), i.e., for robustness to outliers.
The ℓ2,1-norm regularizer on [Wt,Wa] ∈ Rd×(ct+ca) encourages the row-wise joint sparsity. This sparsity constraint encourages the same set of features to be selected for both Xt and Xa (recall that Xt and Xa denote the feature matrix for the target and auxiliary data, respectively). With the sparsity regularization term ‖[Wt,Wa]‖2,1, the useful features are kept by satisfying the AD/NC separation constraint (viaWa) and the MCI conversion separation constraint (via Wt), simultaneously. The jointly learned model is more robust than the individual models of either only satisfying the AD/NC separation constraint (via Wa) [Coup´e et al., 2012; Moradi et al., 2015] which does not consider the pathological difference in the pMCI and sMCI subjects, or only satisfying the MCI conversion separation constraint (viaWt) in [Ye et al., 2011; Young et al., 2013] which has been reported to have limited performance due to the small number of subjects.
The Frobenius norm on [Wt Wa] in the fourth term of Eq. (2) is used to provide a grouping effect, which tends to select highly correlated features together, by countering for some weaknesses of the sparsity constraint [Zou and Hastie, 2005]. By considering the time-consuming issue of the parameter tuning, we change Eq. (2) to the following objective function which makes the fourth term of Eq. (2) still provide a grouping effect and reduce the model complexity.
Different from Eq. (2), Eq. (3) does not need to tune the parameter λ2 manually and changes the square operation of the Frobenius norm to the Frobenius norm only. To solve the optimization problem of Eq. (3), i.e., optimizing either the variable Wt or the variable Wa, we could compute the derivatives of the Frobenius norm in Eq. (3) to iteratively optimize the following problems [Zhu et al., 2018].
In the multiple-modality AD study, it has shown that the PET data and the MRI data could provide complementary information to each other [Cheng et al., 2015; Moradi et al., 2015; Young et al., 2013]. In this paper, we use the PET data of the pMCI and sMCI subjects, i.e., Xp, as another kind of auxiliary data, to help learn the coefficient matrixWt of the target data. More specifically, we constrain the predicted values from the PET data and the MRI data to be close to each other, as both modalities share the same label information. As a result, we have the following objective function
where λ3 is a nonnegative tuning parameter andWp ∈ Rd×ct is a coefficient matrix to the PET data. Note that XtWt and XpWp are the predictions of the label matrix using the MRI and PET data, respectively. Thus, their difference, measured by the summation of element-wise similarity, should be as small as possible.
Combining Eq. (3) with Eq. (5), we obtain the following objective function, which learns Wt with the auxiliary MRI data of AD/NC subjects and the PET data of pMCI/sMCI sub-
2.3 Aging Effect Removal
[Franke et al., 2010; Moradi et al., 2015] showed that both the normal aging and the AD pathology contributed to brain atrophy and it is necessary to remove the aging effect to the brain atrophy before analysis. The first method designed for the aging effect removal fits a linear regression model between the features and the age of NC subjects to obtain a coefficient matrix [Franke et al., 2010; Moradi et al., 2015]. This coefficient matrix denotes how the age affects the feature values. The second method directly fits the model by using both features and the age as covariates [Moradi et al., 2015; Zhu et al., 2014]. Actually, both of them assume that there is linear relationship among the labels, features and ages. Hence, we use the ages of the subjects as one feature in both the target data and the auxiliary data to have our final objective function as follows.
where wtg ∈ R1×ct and wag ∈ R1×ca are coefficient matrices, and λ1 and λ3 are non-negative tuning parameters. In Eq.
(7), the fourth and fifth terms help select common useful features for the first two data fitting terms, while the third term imposes label prediction consistency between Xt and Xp. In addition, the use of the ℓ2,1-norm loss function helps to learn Xt, Xp, and Xa by reducing the influence of outliers.
2.4 Optimization
We employ the alternating optimization strategy to solve Eq. (7), by iteratively optimizing each of the parameters (i.e., wtg, wag, Wt, Wa, and Wp) while fixing the other parameters. We list the pseudo of our method in Algorithm 1 and explain the detail as follows.
i) Update wtg and wag by fixing Wt, Wa, and Wp
With the fixedWt, Wa, andWp, the optimization with respect to the variables wtg and wag are independent to each other. Thus we individually set the derivative of Eq. (7) with respect to wtg and wag to zero to obtain
where A ∈ Rn×n and B ∈ Rn×n, respectively, are diagonal matrices and their respective diagonal elements are defined as ajj = 1 2‖(Yt-[Xt ,xtg ][W⊤ t ,w⊤ tg ]⊤)j ‖22 and bjj = 1 2‖(Ya-[Xa,xag][W⊤ a ,w⊤ ag ]⊤)j ‖22 , j = 1, ..., n.
(ii) Update Wt by fixing wtg, wag, Wa, and Wp
Given wtg, wag, Wa, and Wp, we can rewrite Eq. (7) as follows:
By setting the derivative of Eq. (9) with respect toWt to zero and solving the resulting equations, we can obtain
where G = (X⊤t (A + C)Xt + λ1U + λ2Id) and H = (X⊤t A(Yt - xtgwtg) + X⊤t CXpWp), Id ∈ Rd×d is an identity matrix, and C ∈ Rn×n and U ∈ Rd×d are diagonal matrices and their respective diagonal elements are cjj = 1 2‖(XtWt-XpWp)j ‖22 , j = 1, ..., n and ukk = 1 2‖(Wt,Wa)k ‖22 ,
(iii) Update Wa by fixing wtg, wag, Wt, and Wp
With fixed wtg, wag, Wt, andWp, Eq. (7) becomes:
Algorithm 1: The pseudo of solving Eq. (7).
Input: Xt, Xp, Yt, Xa, Ya, xtg, xag, λ1, and λ3; Output: wtg, wag , Wt, Wa, and Wp;
- 1 Randomly initializeWt, wtg, Wp,Wa, and wag;
- 2 Initialize λ2 via λ2 = 1 2‖[Wt,wtg,Wa,wag]‖F ;
3 repeat
By setting the derivative of Eq. (13) with respect toWt to zero and solving the equations, we obtain
where V ∈ Rd×d is a diagonal matrix whose diagonal elements are defined as vkk = 1 2‖(Wp)k ‖22 , k = 1, ..., d.
3 Experiments
We evaluated our proposed method by comparing with three state-of-the-art feature selection methods and one baseline method on two data sets in terms of four classification evaluation metrics.
3.1 Data Sets
By setting the derivative of Eq. (11) with respect toWt to zero and solving the equations, we obtain
In this work, we used the ADNI 1 ('www.adni-info. org') publicly available on the web for research purposes to generate the binary classification task on two data sets: 1) 'Data1' consisted of 93 AD, 99 NC, 55 pMCI, and 59 sMCI subjects, and 2) 'Data2' consisted of 50 AD, 51 NC, 31 pMCI, and 30 sMCI subjects.
We first preprocessed the MRI and PET images by sequentially applying spatial distortion correction, skull-stripping, and cerebellum removal, followed by segmenting the MRI images into gray matter, white matter, and cerebrospinal fluid, and then warped them into the AAL template to obtain 90 regions. We further aligned the PET images to their respective MRI images. We finally obtained 90 gray matter volumes from a MRI image and 90 mean intensities from a PET image and used them for features.
3.2 ComparisonMethods
We defined a baseline model that utilized the original features for classification (thus denoted as 'Original') and also considered other state-of-the-art feature selection methods, namely, general sparsity regularized feature selection (GSR) [Peng and Fan, 2017], Semi-Supervised Learning (SSL) [Moradi et al., 2015], and Domain Transfer Learning (DTL) [Cheng et al., 2015].
The baseline method 'Original' used all target data to perform classification without removing any features. GSR conducted feature selection by optimizing an ℓ2,r-norm (0 < r ≤ 2) loss function and an ℓ2,p-norm (0 < p ≤ 1) regularization term to reduce the influence of subject-level outliers. In our experiments, we considered to form its two variants: 'GSRPre' (using the target data alone) and 'GSR-Aux' (using the auxiliary data of the AD and NC subjects alone [Ye et al., 2011]). The SSL method sequentially performed the aging effect removal and feature selection using the AD and NC subjects. DTL method conducted feature selection using both the target data and the auxiliary data, without taking into account ageing effect removal and the robustness against outliers in the data.
It is noteworthy that all comparison methods did not take age effect removal into account. Hence, we used 'ProNoAge' to denote our method without taking aging effect removal into account, i.e., Eq. (6), and 'Proposed' as our proposedmodel, i.e., Eq. (7).
3.3 Experimental Setting
We repeated the 10-fold cross-validation scheme 100 times on all methods, each of which conducted 5-fold nested crossvalidations for model selection. The ranges of parameters of every comparison method were set by strictly following the corresponding literature so that they outputted the best results in our experiments. We used the method of grid search with the search range of {10-5, ..., 105} to conduct model selection in our two proposed methods.
In this paper, we further partitioned each of two data sets into two subsets of the target data, i.e., 'MRI', and 'MRI + PET', respectively, to indicate single modality targets (only MRI features) and multi-modality targets (MRI and PET features).
In our experiments, after conducting feature selection, we used the Support Vector Machine (SVM) [Chang and Lin, 2011] to conduct the classification tasks, where we set the parameter C as the range of C ∈ {2-5, 2-4 , . . . , 25} in the SVM for all methods. We used classification accuracy (ACC), sensitivity (SEN), specificity (SPE), and area under the receiver operating characteristic curve (AUC), to evaluate the classification performance.
3.4 Results Analysis
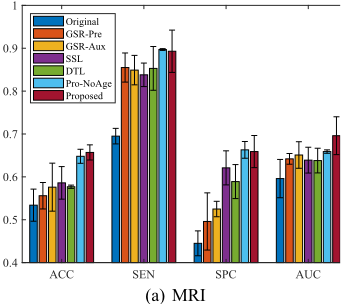
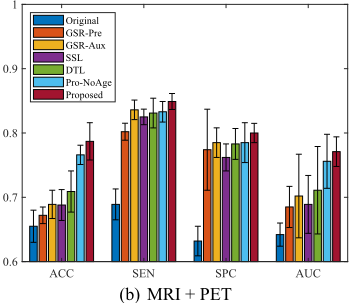
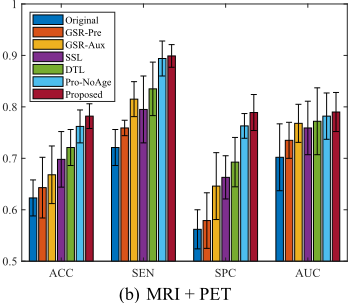
Figures 1 and 2 listed the classification performance of all methods on the data sets 'Data1' and 'Data2', respectively. We listed our observations as follows.
- Our proposed method (i.e., Proposed) achieved the best performance, followed by Pro-NoAge, DTL, SSL, GSR-Aux, GRS-Pre, and Original. Specifically, Proposed improved the classification performance on average by 4.98% compared to the best comparison method, i.e., DTL, while improved on averages by 14.61% compared to the worst comparison method, i.e., Original, in terms of all four evaluation metrics. Moreover, our proposed Pro-NoAge improved the classification performance on average by 3.44%, compared to the best comparison method, i.e., DTL. This demonstrated that either outlier influence reduce or aging effect removal is necessary for the MCI conversion classification.
- All methods achieved larger improvement (in comparison with Original) on Data2, compared to their corresponding improvement on Data1. This may imply that the auxiliary information can improve the prediction ability of the target data, especially when the sample size of the target data is small and the sample size of the auxiliary data are the same
- Proposed outperformed Pro-NoAge method. For example, Proposed improved the classification performance on average by 1.54% compared to Pro-NoAge, in terms of four evaluation metrics. This is consistent with the previous study of [Moradi et al., 2015] that has validated the importance of removing aging effect.
- When regarding the use of the auxiliary data from the AD and NC subjects, GSR-Aux consistently outperformed its counterpart GSR-Pre in all experiments. Specifically, GSR-Aux used the AD and NC subjects to construct the AD/NC classifier to classify the target data, i.e., distinguishing pMCI subjects from sMCI subjects, while GSR-Pre employs the pMCI and sMCI subjects to classify the target data. In our experiments, the AD/NC classifier improves the classification performance by 2.26% in terms of all four evaluation metrics since these two methods select different features to conduct classification tasks. It is noteworthy that the number of features selected by GSR-Pre was larger than the number of features selected by GSR-Aux because GSR-Pre could not capture subtle structure differences among region-of-interests (ROIs) with a limited number of high-dimensional samples.
Finally, we analyzed the selected features by all methods. From our experiments, we could observe that most comparison methods selected similar brain regions as top regions, such as lateral ventricle right, globus palladus left/right, subthalamic nucleus right, uncus right, occipital lobe WM right, nucleus accumbens left, occipital lobe WM left, and fornix right, for the MRI features. Those selected ROIs Original GSR-Pre GSR-Aux SSL
DTL
Pro-NoAge
Proposed
ACC
SEN
SPC
AUC
(a) MRI
were also verified to be related to AD [Cheng et al., 2015; Misra et al., 2009]. It is noteworthy that our method selected some ROIs more often than the comparison methods, such as parahippocampal gyrus left, hippocampal formation right, middle temporal gyrus left, perirhinal cortex left, temporal pole left, entorhinal cortex left, lateral occipitotemporal gyrus right, hippocampal formation left, amygdala left, parahippocampal gyrus right, middle temporal gyrus right, amygdala right, inferior temporal gyrus right, and lateral occipitotemporal gyrus left [Cheng et al., 2015; Misra et al., 2009]. We believe the selection of those ROIs contributed to enhance the performance in our method. In the mean time, none of comparison methods selected the ROIs of angular gyrus right and postcentral gyrus left fromMRI and the ROIs of nucleus accumbens left, lingual gyrus right, and thalamus right from PET.
4 Conclusion
In this paper, we have proposed to use the auxiliary information to improve the diagnostic accuracy in pMCI and sMCI identification. The proposed method used three ways to incorporate the auxiliary data with the target data in a unified framework, i.e., using an ℓ2,1-norm on the weight matrices
(for joint feature selection), using an ℓ2,1-norm loss function (for outliers robustness), and including the age factor in the feature matrix (for removing aging-effect). Finally, experimental results on ADNI 1 verified the effectiveness of our proposed method, compared to the comparison methods, in terms of classification tasks.
Acknowledgments
This work was partially supported by the National Natural Science Foundation of China (Grants No: 61876046 and 61573270), the Guangxi High Institutions Program of Introducing 100 High-Level Overseas Talents, the Strategic Research Excellence Fund at Massey University, and the Marsden Fund of New Zealand (Grant No: MAU1721). The author thanks K. H. Thung and D. Shen for their efforts on the initial draft of this work as well as the Alzheimer's Disease Neuroimaging Initiative for providing the data sets.
@inproceedings{ijcai2019p622,
  title     = {Prediction of Mild Cognitive Impairment Conversion Using Auxiliary Information},
  author    = {Zhu, Xiaofeng},
  booktitle = {Proceedings of the Twenty-Eighth International Joint Conference on
               Artificial Intelligence, {IJCAI-19}},
  publisher = {International Joint Conferences on Artificial Intelligence Organization},
  editor    = {Sarit Kraus},
  pages     = {4475--4481},
  year      = {2019},
  month     = {8},
  note      = {Main track},
  doi       = {10.24963/ijcai.2019/622},
  url       = {https://doi.org/10.24963/ijcai.2019/622},
}
TY - CPAPER TI - Prediction of Mild Cognitive Impairment Conversion Using Auxiliary Information AU - Zhu, Xiaofeng T2 - Proceedings of the Twenty-Eighth International Joint Conference on Artificial Intelligence, IJCAI-19 PB - International Joint Conferences on Artificial Intelligence Organization PY - 2019 SP - 4475 EP - 4481 DO - 10.24963/ijcai.2019/622 UR - https://doi.org/10.24963/ijcai.2019/622 ER -Copied
Machine-readable versions of this paper, for tools and AI agents:





