
Financial Risk Prediction with Multi-Round Q&A Attention Network
Proceedings of the Twenty-Ninth International Joint Conference on Artificial Intelligence. Special Track on AI in FinTech. Pages 4576-4582.
https://doi.org/10.24963/ijcai.2020/631
Keywords
- AI for risk and security: AI for financial risk analytics
- AI for risk and security: AI for financial risk factors and prediction
- Foundation for AI in FinTech: Analyzing big financial data
Abstract
Financial risk is an essential indicator of investment, which can help investors to understand the market and companies better. Among the many influencing factors of financial risk, researchers find the earnings conference call is the most significant one. Predicting financial volatility after the earnings conference call has been critical to beneficiaries, including investors and company managers. However, previous work mainly focuses on the feature extraction from the word-level or document-level.The vital structure of conferences, the alternate dialogue, is ignored. In this paper, we introduced our Multi-Round Q&A Attention Network, which brings into account the dialogue form in the first place. Based on the data of earnings call transcripts, we apply our model to extract features of each round of dialogue through a bidirectional attention mechanism and predict the volatility after the earnings conference call events. The results prove that our model significantly outperforms the previous state-of-the-art methods and other baselines in three different periods.
- [Agarwal et al., 2017] Vikas Agarwal, Y Eser Arisoy, and Narayan Y Naik. Volatility of aggregate volatility and hedge fund returns. Journal of Financial Economics, 125(3):491-510, 2017.
- [Arora et al., 2017] Sanjeev Arora, Yingyu Liang, and Tengyu Ma. A simple but tough-to-beat baseline for sen- tence embeddings. In Proceedings of ICLR, 2017.
- [Bernard and Thomas, 1989] Victor L Bernard and Jacob K Thomas. Post-earnings-announcement drift: delayed price response or risk premium? Journal of Accounting re- search, 27:1-36, 1989.
- [Devlin et al., 2019] Jacob Devlin, Ming-Wei Chang, Ken- ton Lee, and Kristina Toutanova. BERT: Pre-training of deep bidirectional transformers for language understand- ing. In Proceedings of the 2019 Conference of the North American Chapter of the Association for Computational Linguistics: Human Language Technologies, Volume 1 (Long and Short Papers), pages 4171-4186, Minneapo- lis, Minnesota, June 2019. Association for Computational Linguistics.
- [Fama, 1995] Eugene F Fama. Random walks in stock mar- ket prices. Financial analysts journal, 51(1):75-80, 1995.
- [French et al., 1987] Kenneth R French, G William Schw- ert, and Robert F Stambaugh. Expected stock returns and volatility. Journal of financial Economics, 19(1):3-29, 1987.
- [Keith and Stent, 2019] Katherine Keith and Amanda Stent. Modeling financial analysts' decision making via the prag- matics and semantics of earnings calls. In Proceedings of ACL, pages 493-503, Florence, Italy, July 2019. Associa- tion for Computational Linguistics.
- [Kogan et al., 2009] Shimon Kogan, Dimitry Levin, Bryan R Routledge, Jacob S Sagi, and Noah A Smith. Predicting risk from financial reports with regression. In Proceedings of NAACL-HLT, pages 272-280. Association for Compu- tational Linguistics, 2009.
- [Larcker and Zakolyukina, 2012] David F Larcker and Anastasia A Zakolyukina. Detecting deceptive discus- sions in conference calls. Journal of Accounting Research, 50(2):495-540, 2012.
- [Loughran and McDonald, 2011] Tim Loughran and Bill McDonald. When is a liability not a liability? textual analysis, dictionaries, and 10-ks. The Journal of Finance, 66(1):35-65, 2011.
- [Moreira and Muir, 2017] Alan Moreira and Tyler Muir. Volatility-managed portfolios. The Journal of Finance, 72(4):1611-1644, 2017.
- [Qin and Yang, 2019] Yu Qin and Yi Yang. What you say and how you say it matters: Predicting stock volatility us- ing verbal and vocal cues. In Proceedings of ACL, pages 390-401, 2019.
- [Rekabsaz et al., 2017] Navid Rekabsaz, Mihai Lupu, Artem Baklanov, Alexander Dür, Linda Andersson, and Allan Hanbury. Volatility prediction using financial disclosures sentiments with word embedding-based ir models. In Pro- ceedings of ACL, pages 1712-1721, 2017.
- [Sadka, 2006] Ronnie Sadka. Momentum and post-earnings- announcement drift anomalies: The role of liquidity risk. Journal of Financial Economics, 80(2):309-349, 2006.
- [Theil et al., 2019] Christoph Kilian Theil, Samuel Broscheit, and Heiner Stuckenschmidt. Profet: Pre- dicting the risk of firms from event transcripts. In Proceedings of IJCAI, pages 5211-5217. AAAI Press, 2019. IJCAI
- [Wang et al., 2013] Chuan-Ju Wang, Ming-Feng Tsai, Tse Liu, and Chin-Ting Chang. Financial sentiment analysis for risk prediction. In Proceedings of the Sixth Interna- tional Joint Conference on Natural Language Processing, pages 802-808, 2013.
- [Wang et al., 2019] Jingjing Wang, Changlong Sun, Shoushan Li, Xiaozhong Liu, Luo Si, Min Zhang, and Guodong Zhou. Aspect sentiment classification towards question-answering with reinforced bidirectional attention network. In Proceedings of the 57th Annual Meeting of the Association for Computational Linguistics, pages 3548-3557, Florence, Italy, July 2019. Association for Computational Linguistics.
- [Yang et al., 2016] Zichao Yang, Diyi Yang, Chris Dyer, Xi- aodong He, Alex Smola, and Eduard Hovy. Hierarchical attention networks for document classification. In Pro- ceedings of NAACL-HLT, pages 1480-1489, 2016.
- [Yang et al., 2019] Zhilin Yang, Zihang Dai, Yiming Yang, Jaime G. Carbonell, Ruslan Salakhutdinov, and Quoc V. Le. Xlnet: Generalized autoregressive pretraining for lan- guage understanding. CoRR, abs/1906.08237, 2019.
References were extracted automatically from the PDF and may contain errors.
Full text extracted automatically from the PDF; figures, tables and equations may differ. The PDF is the version of record.
1 Introduction
Financial risk, or the volatility of the stock returns in a certain period, has attracted wide attention in financial market research [Agarwal et al., 2017; French et al., 1987; Kogan et al., 2009; Moreira and Muir, 2017; Rekabsaz et al., 2017; Theil et al., 2019; Qin and Yang, 2019]. These researches have proved that some financial disclosures, including 10-K files [Kogan et al., 2009] and earnings conference call materials [Qin and Yang, 2019], are valuable data source for financial risk analysis. Considering the extensive financial influence and arbitrage possibility that stock volatility brings, an accurate prediction may lead to a better understanding of the financial market and a higher return on investment. Moreover, financial disclosures analysis may also help to discover potential operational problems of each company, which may eliminate the information asymmetry in the investment market to a certain extent.
∗Contact Author
In traditional financial market research, the stock price is not predictable [Fama, 1995]. It behaves as a randomwalk in most cases. However, some studies have proved that in certain circumstances, the stock price, at least the volatility of stock price, is predictable. This phenomenon happens when a major financial event called earnings conference call occurrences [Bernard and Thomas, 1989; Sadka, 2006]. During the earnings conference call, company senior managers will release company performance in the last quarter and answer questions raised by analysts. The earnings call transcript will document this information and release to the public. Many of recent research about financial risk prediction is based on these transcripts. Since transcripts are textual material, its analysis is spontaneously an NLP problem. For example, Theil et al. [2019] propose a deep learning model to extract textual information from transcripts and predict stock volatility. Besides, Qin and Yang [2019] extend the earnings conference call analysis as a multimodal problem by incorporating textual and audio information in the same model.
Whereas existing studies may apply different modeling methods and databases, they are all trying to understand these data better and extract meaningful information for financial risk prediction. However, these research fails to consider the structure of earnings call's transcripts. As the recording of the conference, the transcript restores the presentation made by senior managers and the Q&A interaction between senior managers and analysts chronologically. This structure may contain valuable facts since the Q&A section reveals analysts' concerns about the company and managers' reactions to these tough questions. To address this ignored problem, we propose the Multi-Round Q&A attention model, which includes a purposely designed architecture for the detailed analysis of the earnings call's transcripts, especially for the Q&A section. By jointly applying bidirectional LSTM and hard attentionbased reinforced sentence selector, our model learns semantic information from each question-answer round and combines multi-round features to predict volatility. Experiment results indicate the effectiveness of our proposed model. The prediction results of the Multi-Round Q&A attention model outperform several strong baselines and other state-of-the-art models, which also concentrate on the problem of financial risk forecasting. Based on the experiment results, we conclude several financial insights to explain our findings and reveal its application value for the financial industry.
2 RelatedWork
We briefly summarise related work about financial risk prediction and disclosures analysis in this section. As an area receiving full attention both from academia and the industry, financial analysis has been a focused area in the NLP community for a long time. The pioneering work of [Kogan et al., 2009] introduces both financial risk prediction and financial disclosures analysis into the NLP research. They use support vector regression to predict financial volatility based on 10K report corpus. Their work demonstrates the effectiveness of NLP methods in financial document analysis. The following work in this area further discovers the application of NLP techniques for financial-related tasks.
2.1 Financial Risk Prediction
Financial risk has long been considered to be more predictable than stock returns because of the post earnings announcement drift (PEAD) theory [Bernard and Thomas, 1989]. However, it is still a powerful indicator of financial market and arouses the interest of many researchers. Wang et al. [2013] utilize the Loughran and McDonald [2011] sentiment lexicon to confirm the relationship between 10-K reports sentiment and company risk. Rekabsaz et al. [2017] combine the textual features with factual market features to achieve a better prediction result. Theil et al. [2019] and Qin and Yang [2019] first treat earnings call transcripts as a structured document. While Theil et al. separate the transcript into presentations, questions, and answers parts and then combine them with attention mechanism to make the prediction, Qin and Yang focus on the effectiveness of the presentation part and introduce the audio features to formulate this as a multimodal prediction task.
2.2 Financial Disclosures Analysis
Considering the fact that most financial disclosures are textual materials, and some of them even have XML structure which can be easily parsed, it is no wonder that financial disclosures analysis is now a focused area in NLP. Except for the work also studies the 10-K reports and earnings call transcript for risk prediction, the rich information in financial disclosures also supports other findings. Larcker and Zakolyukina [2012] demonstrate that linguistic-based model can expose deceptive discussions during the earnings conference calls. Keith and Stent [2019] point out that the behavior of analysts group after earnings calls is another worth-studying fact.
Recently, research attempts to understand the hierarchical structure of text also contributes to our design to parse the earnings calls transcript. Yang et al. [2016] propose a hierarchical attention network for long document analysis, which address the loss of information in lengthy text analysis. Also, Wang and Sun [2019] proposed a bidirectional attention network with a reinforced selector mechanism in the e-commerce field to classify aspect sentiment of question and answer pair, which achieves better accuracy on both term-level and category-level. To the best of our knowledge, our work first proposes a deep learning framework that takes into account the structure of earnings calls transcripts and design corresponding model component to deal with the distinct multi-round Q&A section.
3 ProposedModel: MR-QA
Following the prior study [Kogan et al., 2009], we formalize the problem as an NLP task, which aims to parse financial textual materials and predict financial risk. Given an earnings conference call transcript, we divide the complete transcript into different rounds of conversations by speaker alternation. Our model accepts these conversations and predicts the volatility of this company's stock returns in a certain period after the released date of this earnings call. As mentioned before, our model not only applies NLP techniques to capture the semantic information in textual materials, but also consider the structure of this particular document. The high-level understanding behind this design is to incorporate analysts' concerns and senior managers' responses to better measure the risk of this company. Our Multi-Round Q&A attention model (MR-QA) is a neural model incorporating BiLSTM, hard attention mechanism and bidirectional attention network. The remaining of this section introduces the overall architecture of our MR-QA model to predict the financial risk according to the distinct Q&A structure from the earnings call transcript. The essential parts of our model are explained in detail to reveal how our model adapts the document structure to achieve the new state-of-the-art performance.
3.1 Architecture
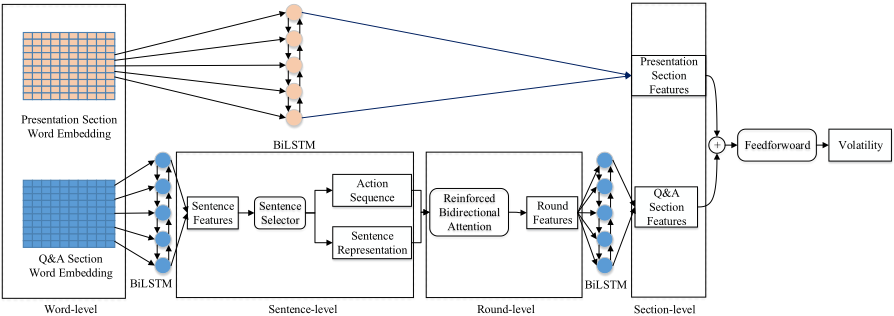
Corresponded to the two relatively independent sections of transcripts of the earnings conference call, the architecture of our Multi-round Q&A Attention model also consists of two parts. As shown in Figure 1, the first part is used to cope with the presentation section of earnings call transcripts, and the other part is used to deal with the question and answer section.
In both parts, we use the bidirectional LSTM (BiLSTM) to capture both forward and backward contextual information and encode the whole sector as a vector to represent features of this section directly. The word-level part embeds each word into a vector to transform the discrete value of words to the continuous value that can be operated by the neural network. The sector-level part represents the section to a vector by the last hidden state of BiLSTM, which can be seen as the features of this section so that these values can be served to the downstream task like prediction here.
However, the architecture of the model dealing with the question and answer section is more complicated, and it is the primary attribution of this paper. In the Q&A section, except for word-level features and section-level features, we design the sentence-level features and round-level features to acquire potential information in this part.
The first part uses the BiLSTM to encode each sentence to a specific vector, which transforms the word-level features to sentence-level features. The second part operates the sentence features further by applying the Reinforced Sentence Selector(RSS) to select sentences with useful information. We set the sentence selector to reduce the noise in earnings call transcripts. Sentences are not always informative for each round. For example, the analysts usually say "Thank you." before they raise questions out of politeness. These kinds of sentences are useless to predict the volatility of company stock. Therefore, we drop them by a hard attention mechanism. This step produces action sequence tagging in which sentences are selected and sentence representations after selection. What's more, the questions and answers are not independent. The answers of managers are likely to depend on the questions of analysts for this round. To explore the interaction between questions and answers, we employ the Reinforced Bidirectional Attention Network(RBAN) in the third part to cope with the output from the second part and get the bidirectional attention between questions and answers. Then we pay attention to the sentences selected in the different degrees to get the features of this round. The fourth part serves as a connection function like the first part, which applies the BiLSTM to transform the round-level features to the sectionlevel features of the Q&A section. Finally, we concatenate the features from the two parts together and regress to predict the volatility after the earnings call.
3.2 Reinforced Sentence Selector(RSS)
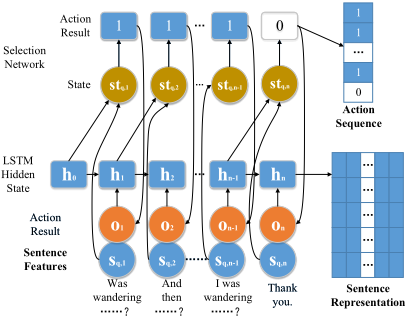
Reinforced sentence selector aims to drop some noisy sentences and select the informative sentences. Given an input sentence features sequence {s1, s2, ..., sn}, RSS outputs an action sequence with equal length {o1, o2, ..., on}, where oi
= 0 means the i-th sentence is dropped while oi = 1 means the i-th sentence is selected and representations of these sentences after selection are {h1, h2, ..., hn}.
In detail, the process of RSS is shown in Figure 2. Firstly, the input sequence of sentence features and the action results are concatenated and fed into LSTM, which produces the hidden states as the features of the sentence with contextual information. The formulation representations of this step are as:
At the same time, we define the state of the i-th step which contains the full information at this step to decide whether the sentence is selected or dropped. Then a policy network is used to calculate the conditional probability of pπ(oi|sti, θr) for each state.The formulas are as:
The Wr and br should be trained by reinforcement learning as it is not differentiable because the sentences are selected according to the hard attention mechanism which produces the discrete values. Therefore, we define the reward to train this part:
where SE means the standard error between the real result y and the predicted result y′ , γ donates the penalty weight, E′ donates the count of sentences selected and E donates the total amount of sentences in the section.
3.3 Reinforced Bidirectional Attention Network(RBAN)
Figure 3 shows the framework of Reinforced Bidirectional Attention Network, which encodes each round of the Q&A section to the features of questions and answers based on the attention between each other and concatenates them together as round features. The input of this network is the action sequences and sentence representations of questions and answers from the RSS.
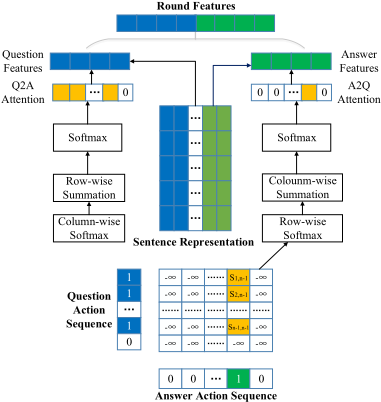
In detail, the network treats sentence representations with action sequences of each round as input and produces the feature presentation of the round. For the question section and answer section, we employ two RSSs with different parameters separately. They are represented as:
After that, we merge sentence representations of questions {hq1 , ..., hqi , ..., hqEq } and answers {ha1 , ..., haj , ..., haEa } to a matrix S ∈ REq×Ea based on the action sequences of questions {oq1 , ..., oqi , ..., oqEq } and answers {oa1 , ..., oaj , ..., oaEa } :
where ω,W1,W2, b should be trained, which is discussed at length in the latter section.
Then the matrix can represent the interaction between the questions and answers selected by RSS. To mine the matching information, we first employ the row/column-wise softmax operation to get two new normalized matrices Sr and Sc .
And we perform the column/row-wise summation operation to these two normalized matrices respectively and get matching score vectors.
After that, we employ the softmax operation again to matching score vectors as the Question-to Answer attention and Answer-to-Question attention. The features of questions or answers of the round are computed based on the attention.
Finally, we concatenate the question features and the answer features together to represent the features of the round, r = vq ⊕ va, which is fed into a BiLSTM to capture the features of the whole Q&A section later.
3.4 Optimismwith Reinforcement Learning
The parameters of MR-QA can be divided into two parts: 1) θr in the policy network of RSS modules. 2) θ for the rest part including BiLSTM, LSTM, bidirectional attention, softmax encoder and final linear regression.
For θq r , we use the policy gradient algorithm to optimize based on the reward we define in section 2. Then the policy gradient about θr is computed by differentiating the maximized expected reward J(θr) as follows:
where ▽θr J(θr) is estimated by Monte Carlo simulation to sample the action sequences over questions and answers.
For θ , we optimise it with back-propagation. The loss function for learning it is MSE, which is as follows:
where M is the size of the data set.
In the model training process, θr is not trained in the initial epochs, which means RSS selects all sentences at first. After the loss function of the development set does not drop significantly, we update θr and θ simultaneously.
4 Experiment and Results
4.1 Data Description
The data set of earnings call transcripts we used is scraped from Seeking Alpha 1 . The textual data online is organized in a specific format so that it is easy to extract the date of earnings call events and the role of speakers with what they said in certain earnings call event. To increase the typicality of our experiment samples, we select earnings call transcripts of Standard & Poor 500 sample stock companies, a good benchmark to value the risk of the US stock market. The final data set contains 6494 samples from 2015 to 2018.
1 https://seekingalpha.com/
| Year | Count | PreSent | PreToken | QASent | QAToken |
|---|---|---|---|---|---|
| 2015 | 1428 | 2220K | 5.258M | 450K | 9.443M |
| 2016 | 1675 | 255K | 6.085M | 558K | 11.374M |
| 2017 | 1604 | 244K | 5.826M | 531K | 10.882M |
| 2018 | 1787 | 276K | 6.588M | 578K | 11.783M |
| Total | 6494 | 995K | 23.758M | 2.116M | 43.483M |
Each transcript consists of a presentation section and a question and answer section. In the presentation section, the senior managers will introduce the state of business in the reporting period. In the question and answer section, the analysts will raise questions about the operation status of the company and the managers will answer these questions to avoid the increase of market concerns. We first split the data into two blocks according to the presentation section and the question&answer section. Then we use the tokenize module of Natural Language Toolkit 2 to split sentences and tokenize documents. Then we statistic the scale of our data set as Table 1.
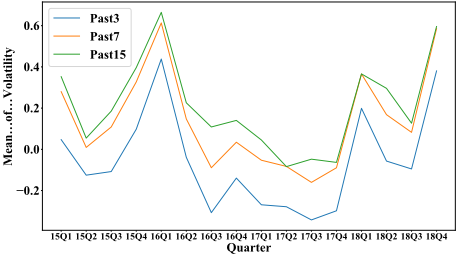
To avoid using later data to predict the formal indicator, we split our data to the training set, validation set, and test set in chronological order. Besides, the volatility of stock market changes with quarters. Our data shows that the volatility is more likely to increase in the first and fourth quarters. To eliminate the influence of imbalance among quarters, which is shown in Figure 4, we split data according to years instead of a specific proportion. We select data of last year to test the effectiveness of the model. And we choose data in 2015 and 2016 to train model and data in 2017 as the validation set.
4.2 Model Training
Our neural network is constructed with the Pytorch 3 architecture. The learning rate is in the set of {10-3 , 10-4 , 10-5 } and the batch size is set to 16 or 32. We train our model on two GPUs separately, Titan V with 12G memory and Tesla V100 with 32G memory. The word-embedding layer is pre-trained Glove-300 word-embedding on 840G corpus and we employ it with torchtext module 4 .
2 http://www.nltk.org/
3 https://pytorch.org/
4 https://pytorch.org/text/
| Model | 3d | 7d | 15d |
|---|---|---|---|
| vpast | 1.0987 | 0.3820 | 0.2129 |
| BERT | 0.5892 | 0.2803 | 0.1913 |
| XLNet | 0.6055 | 0.2896 | 0.1987 |
| IR | 0.6076 | 0.2992 | 0.2037 |
| word-embedding | 0.6234 | 0.3204 | 0.2271 |
| word-embedding+SVR | 0.5801 | 0.2843 | 0.2006 |
| ProFET(text-only) | 0.6477 | 0.3342 | 0.2403 |
| MR-QA-soft | 0.5821 | 0.2677 | 0.1690 |
| MR-QA-without RSS | 0.5774 | 0.2662 | 0.1640 |
| MR-QA | 0.5749 | 0.2632 | 0.1635 |
Considering the volatility of the stock market with a high peak and a fat tail is nonlinear, it is improper to use the standard deviation of the stock price change rate. Therefore, we use its natural logarithmic formation.
where T donates the time, ri donates the change rate on the i-th day and ¯ r represents the average of the change rate in this period. In our experiment, we choose T ∈ {3, 7, 15} to evaluate the applicability in different spans.
To process back-propagation, we set the mean square error as the loss function. And we choose Adam optimizer to optimize our model step by step. As mentioned earlier, we deal with reinforcement learning in two stages. We optimize the parameter of other parts apart from the reinforcement part and then optimize the whole model at the same time. However, our experiment shows that if we process reinforcement learning after the other part is well-trained, it is much easy to overfit. Therefore, we choose the model to reinforce a bit earlier than the other part is well trained and reduce the learning rate when process reinforcement learning.
4.3 Benchmark
To assess the performance of our model, we selected the following baselines to compare with our model.
past volatility Past volatility before earnings calls events is a useful indicator, which represents the recent risk standard. We use the previous volatility as the first baseline, which is recorded as vpast. To ensure the consistency of information, we use the past τ -days' volatility as the prediction of the next τ-days' volatility.
word-embedding This baseline employs the smooth inversed frequency as weights of words and sums up as the features of documents [Arora et al., 2017]. And we use these features to regress with the linear and Support Vector Regression (SVR) [Kogan et al., 2009] method separately.
IR The recent research to predict the financial risk with the information retrieval method [Rekabsaz et al., 2017] tunes the definition of BM25 as the features of documents. We replicate this experiment on our corpus to compare with ours.
BERT&XLNet Bidirectional Encoder Representations from Transformers [Devlin et al., 2019] and XLNet [Yang et al., 2019] encode sentences based on the contextual information, which are suitable for multiple downstream tasks. We make use of the pre-trained module of bert-base-uncased and xlnet-base-uncased with Spacy 5 to encode our corpus, which selects the hidden state of the last layer on the '[CLS]' token as the representation of each sentence. Then we calculate their average as the features of documents and finally regress with SVR to predict the volatility.
| Model | 3d | 7d | 15d | ||||||
|---|---|---|---|---|---|---|---|---|---|
| MAE | r | ρ | MAE | r | ρ | MAE | r | ρ | |
| vpast | 0.8006 | 0.1430 | 0.1664 | 0.4771 | 0.3232 | 0.3218 | 0.3576 | 0.4112 | 0.3853 |
| IR[2017] | 0.6126 | 0.2648 | 0.2487 | 0.4502 | 0.3113 | 0.2995 | 0.3575 | 0.3337 | 0.3240 |
| ProFET(text-only)[2019] | 0.6376 | 0.2986 | 0.2852 | 0.4620 | 0.3128 | 0.2882 | 0.3894 | 0.3067 | 0.2960 |
| MR-QA | 0.5949 | 0.3576 | 0.3345 | 0.4101 | 0.3884 | 0.4302 | 0.3211 | 0.4302 | 0.4134 |
ProFET(text-only) The recent research about the stock volatility prediction with earnings call transcripts [Theil et al., 2019] employs the attention mechanism to section feature extraction. It divides the earnings call transcripts to the presentation section, question section and answer section, and then extracts section features for each section with BiLSTM and attention mechanism. Features of three sections are fed into a 3-layer feed-forward neural network for prediction. Though the method merges the financial features with the textual features got in this way and predicts the volatility with these two types of features, we only use its part for textual feature extraction. Besides, we choose the same setting for hidden state size for three layers with 500, 200, and 100.
4.4 EvaluationMetrics
To evaluate our model comprehensively, apart from our optimization target, MSE, we select these different types of metrics as follows: the mean absolute error(MAE), the linear correlation coefficient Pearson's r, and the non-linear rank correlation coefficient Spearman's ρ used in the formal research [Theil et al., 2019].
4.5 Results and Discussion
Table 2 shows our performance reported in the 4-th decimal compared with several baselines evaluated by MSE and Table 3 provides an overview of the evaluation results in other indicators. Our model outperforms all of the baselines in three different spans. Compared to the most common baseline, past volatility, our model achieves 47% improvement in 3-days span, 31% in 7-days span, and 23% in 15-days span. Besides, the performance of our model outperforms the recent model about earnings call transcripts, ProFET. Apart from a better prediction effect, we find some fun results, which may be helpful for further research.
The interaction between questions and answers exists and influences the volatility in the long term. The robust performance of our model proves that dialogues matter in risk prediction tasks, especially compared with ProFET, which copes with the questions and answers and extracts features separately. This means that our research is meaningful, and the structure of dialogues can help improve the performance of the long-text task as well. We reduce 11%MSE in 3-days span compared to ProFET(0.5749 vs 0.6477, p≤0.01), which uses textual information only, 21% in 7-days span(0.2632 vs 0.3342, p≤0.001) and 32% in 15-days span(0.1635 vs 0.2403, p≤0.001). The results evaluated by other metrics that our model achieves lower MAE and more correlation in the long period compared to the IR method and ProFET model(text-only) are consistent with it. And maybe the influence of the question and answer interaction performs in the long term. The reason may be the evaluation report from analysts is later than earnings call events, but the decision to change the prospect for the company is influenced by the question and answer part, which is proved by the former research [Keith and Stent, 2019].
5 https://spacy.io/
Hard attention mechanism performances better. To understand why the reinforced sentence selector works, we try to change our hard attention mechanism to soft attention mechanism. With soft attention, we choose how much information is feed into the bidirectional attention network instead of letting the model select sentences with a probability. But the model with soft attention does not perform well, even worse than the model without sentence selector. The reason may be that the bidirectional attention network not only gets the attention between questions and answers, but the attention to themselves is also learned in the training process.
5 Conclusion
Predicting financial risk with advanced NLP techniques is one of the focus areas in AI community. In this work, we propose the MR-QA model to detect valuable information from the multi-round Q&A structure of earnings conference call transcripts, which is ignored by other researchers. With significant experimental results, we demonstrate the effectiveness of our model, as well as the importance of this distinct structure. While AI-related financial analysis methods receive much more attention in recent years, we hope that our findings could reveal a better way to understand financial disclosures and brings practical enlightenment to financial practitioners.
Acknowledgments
This work was supported by the National Natural Science Foundation of China (Grant No. U1711262, 71771212). We thank the anonymous reviewers for helpful comments.
@inproceedings{ijcai2020p631,
  title     = {Financial Risk Prediction with Multi-Round Q&A Attention Network},
  author    = {Ye, Zhen and Qin, Yu and Xu, Wei},
  booktitle = {Proceedings of the Twenty-Ninth International Joint Conference on
               Artificial Intelligence, {IJCAI-20}},
  publisher = {International Joint Conferences on Artificial Intelligence Organization},
  editor    = {Christian Bessiere},
  pages     = {4576--4582},
  year      = {2020},
  month     = {7},
  note      = {Special Track on AI in FinTech},
  doi       = {10.24963/ijcai.2020/631},
  url       = {https://doi.org/10.24963/ijcai.2020/631},
}
TY - CPAPER TI - Financial Risk Prediction with Multi-Round Q&A Attention Network AU - Ye, Zhen AU - Qin, Yu AU - Xu, Wei T2 - Proceedings of the Twenty-Ninth International Joint Conference on Artificial Intelligence, IJCAI-20 PB - International Joint Conferences on Artificial Intelligence Organization PY - 2020 SP - 4576 EP - 4582 DO - 10.24963/ijcai.2020/631 UR - https://doi.org/10.24963/ijcai.2020/631 ER -Copied
Machine-readable versions of this paper, for tools and AI agents:





