
SURPRISE! and When to Schedule It.
Proceedings of the Thirtieth International Joint Conference on Artificial Intelligence. Main Track. Pages 252-260.
https://doi.org/10.24963/ijcai.2021/36
Keywords
- Humans and AI: Human Computation and Crowdsourcing
- Agent-based and Multi-agent Systems: Algorithmic Game Theory
- Agent-based and Multi-agent Systems: Computational Social Choice
Abstract
Information flow measures, over the duration of a game, the audience’s belief of who will win, and thus can reflect the amount of surprise in a game. To quantify the relationship between information flow and audiences' perceived quality, we conduct a case study where subjects watch one of the world’s biggest esports events, LOL S10. In addition to eliciting information flow, we also ask subjects to report their rating for each game. We find that the amount of surprise in the end of the game plays a dominant role in predicting the rating. This suggests the importance of incorporating when the surprise occurs, in addition to the amount of surprise, in perceived quality models. For content providers, it implies that everything else being equal, it is better for twists to be more likely to happen toward the end of a show rather than uniformly throughout.
- [Atanasov et al., 2017] Pavel Atanasov, Phillip Rescober, Eric Stone, Samuel A Swift, Emile Servan-Schreiber, Philip Tetlock, Lyle Ungar, and Barbara Mellers. Distilling the wisdom of crowds: Prediction markets vs. prediction polls. Management Science, 63(3):691-706, 2017.
- [Baddeley and Hitch, 1993] Alan D Baddeley and Graham Hitch. The recency effect: Implicit learning with explicit retrieval? Memory & Cognition, 21(2):146-155, 1993.
- [Bizzozero et al., 2016] Paolo Bizzozero, Raphael Flepp, and Egon Franck. The importance of suspense and sur- prise in entertainment demand: Evidence from wimble- don. Journal of Economic Behavior & Organization, 130:47-63, 2016.
- [Brier, 1950] G. W. Brier. Verification of forecasts expressed in terms of probability. Monthly Weather Review, 78:1-3, 1950.
- [Buraimo et al., 2020] Babatunde Buraimo, David Forrest, Ian G McHale, and JD Tena. Unscripted drama: soccer audience response to suspense, surprise, and shock. Eco- nomic Inquiry, 58(2):881-896, 2020.
- [Ely et al., 2015] Jeffrey Ely, Alexander Frankel, and Emir Kamenica. Suspense and surprise. Journal of Political Economy, 123(1):215-260, 2015.
- [Gneiting and Raftery, 2007] Tilmann Gneiting and Adrian Raftery. Strictly proper scoring rules, prediction, and es- timation. Journal of the American Statistical Association, 102:359-378, 03 2007.
- [Goel et al., 2010] Sharad Goel, Daniel M Reeves, Duncan J Watts, and David M Pennock. Prediction without markets. In Proceedings of the 11th ACM conference on Electronic commerce, pages 357-366, 2010.
- [Gurkaynak and Wolfers, 2006] Refet Gurkaynak and Justin Wolfers. Macroeconomic derivatives: An initial analy- sis of market-based macro forecasts, uncertainty, and risk. Technical report, National Bureau of Economic Research, 2006.
- [Hunter, 2007] J. D. Hunter. Matplotlib: A 2d graphics envi- ronment. Computing in Science & Engineering, 9(3):90- 95, 2007.
- [Kahneman et al., 1993] Daniel Kahneman, Barbara L Fredrickson, Charles A Schreiber, and Donald A Re- delmeier. When more pain is preferred to less: Adding a better end. Psychological science, 4(6):401-405, 1993.
- [Lambert et al., 2015] Nicolas S. Lambert, John Langford, Jennifer Wortman Vaughan, Yiling Chen, Daniel M. Reeves, Yoav Shoham, and David M. Pennock. An ax- iomatic characterization of wagering mechanisms. Jour- nal of Economic Theory, 156:389 -416, 2015. Computer Science and Economic Theory.
- [Lucas et al., 2017] Gale M. Lucas, Jonathan Gratch, Niko- laos Malandrakis, Evan Szablowski, Eli Fessler, and Jef- frey Nichols. Goaalll!: Using sentiment in the world cup to explore theories of emotion. Image and Vision Comput- ing, 65:58-65, 2017. Multimodal Sentiment Analysis and Mining in the Wild Image and Vision Computing.
- [Pennock et al., 2001] David M Pennock, Steve Lawrence, Finn Årup Nielsen, and C Lee Giles. Extracting collective probabilistic forecasts from web games. In Proceedings of the seventh ACM SIGKDD international conference on Knowledge discovery and data mining, pages 174-183, 2001.
- [Plott and Chen, 2002] Charles R Plott and Kay-Yut Chen. Information aggregation mechanisms: Concept, design and implementation for a sales forecasting problem. Work- ing paper No. 1131, California Institute of Technology, Di- vision of the Humanities and Social Sciences, 2002.
- [Rieg and Schoder, 2010] Robert Rieg and Ramona Schoder. Forecasting accuracy: Comparing prediction markets and surveys-an experimental study. Journal of Prediction Mar- kets, 4(3), 2010.
- [Rothschild and Wolfers, 2011] David Rothschild and Justin Wolfers. Forecasting elections: Voter intentions versus ex- pectations. Available at SSRN 1884644, 2011.
- [Scarf et al., 2019] Phil Scarf, Rishikesh Parma, and Ian McHale. On outcome uncertainty and scoring rates in sport: The case of international rugby union. European Journal of Operational Research, 273(2):721-730, 2019.
References were extracted automatically from the PDF and may contain errors.
Full text extracted automatically from the PDF; figures, tables and equations may differ. The PDF is the version of record.
1 Introduction
The live streaming industry has been burgeoning around the world in recent years. This includes live streaming games which, in turn, encompasses content like esports (e.g., League of Legends, Dota2, CS:GO, Apex Legends), sports games (e.g., football, tennis), and other games like chess, poker, and virtual casinos. Esports and its related brands occupy 24.2% of the hours watched on Twitch.tv. 1 About 609 million people spent over 5 billion hours watching video game streams in 2016. 2
∗Equal contribution
†Corresponding author
‡Supported by National Natural Science Foundation of China award number 62002001
§Supported by the National Key Research and Development Program of China award number 2018YFB1004503
¶ Supported by (United States) National Science Foundation award number 2007256
1 https://www.pwc.de/en/technology-media-andtelecommunication/digital-trend-outlook-esport-2020/mediabroadcasts.html
Despite the popularity of these live shows, their quality varies significantly. We hypothesize an audience's perceived quality for such live streamed content is, in part, derived from the surprise in the content. One way to capture the effect of surprise is to solicit information flow delivered from the show. Before the game commences, the audience might have an imperfect idea of who will win. As the live game unfolds, the audience learns better about who the winner is likely to be. In particular, the winner is clear by the time the game ends. Information flow measures, over the duration of a game the audience's belief of who will win. Intuitively, the surprise, measures how much information flow fluctuates over time.
A key challenge is to quantify the relationship between the audiences' information flow and audiences' perceived quality. Prior studies either assume such relationship theoretically [Ely et al., 2015] or use a statistical model to generate the theoretic information flow and indirectly measure audiences' perceived quality (e.g., by audience size) [Bizzozero et al., 2016; Scarf et al., 2019; Buraimo et al., 2020]. We instead elicit data directly from the audience to quantify the relationship and provide new insights for the development of such perceived quality models. Specifically, we elicit audiences' real-time beliefs to compute the amount of surprise in a game. We then study the relationship both between the amount of surprise and perceived quality and also the relationship between when the surprise occurs and perceived quality.
We design the Information Flow Elicitation Platform to collect the audiences' continuous beliefs and afterward ratings. Specifically, subjects watch live streaming games and update their beliefs for the games' outcomes as many times as they want. The platform monetarily rewards agents for their information flow reports in such a way that more accurate reports lead to higher payments. Subjects also rate the game quality afterwards.
We use our platform to conduct a study targeting LOL S10. 3
2 Based on Nate Nead's report https://investmentbank.com/ esports-gaming-video-content/
3 The 2020 League of Legends World Championship is the tenth world championship for League of Legends, an esports tournament for the video game developed by Riot Games. It was held from 25
Summary of our results. We find that the second half of the game has a larger amount of surprise compared to the first half and the amount of surprise at the end of the game has the strongest impact on the subjects' average ratings. Moreover, subjects' average ratings are significantly positively correlated with the games' surprise amount. Interestingly, the surprise amount in the first half of the game is negatively correlated with the average ratings, while this correlation in the second half is positive. One conjecture is that subjects overweight their watching experience in later time periods, which is not captured in prior studies. In other words, our results suggest that the perceived quality model should consider the time factor and the designers can use a better information revelation strategy such that the game is more likely to have a twist near the end. Additionally, we conduct robustness checks by considering alternative causes of perceived quality fluctuations, e.g., the favorite (home) team wins, and the results are consistent.
2 Belief Curves, Median Curves, and Surprise
In this section, we formally define the belief curve for each agent, and the aggregation of agent's beliefs into the information flow and median curve to compute the amount of surprise in a game.
We focus on the two-team competition setting.
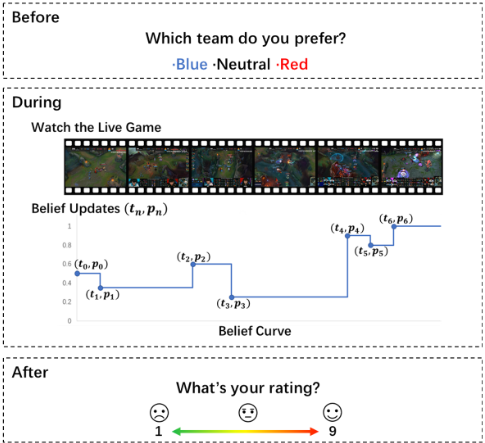
Belief curves and information flow. In game g, subject s has a sequence of belief updates (the blue dots in Figure 2) chronologically {(t0, p0), (t1, p1), ..., (tn, pn)}, where n is the number of times that subject s updates her belief in game g. Furthermore, t0 = startg shows that she reports her prior belief p0 at the start of the game. Then she updates her belief from p0 to p1 at time t1 and keeps updating her belief to the end. For convenience, let tn+1 = endg. For all 0 ≤ i ≤ n, during period [ti, ti+1), subject s's belief remains to be pi.
A subject s's belief curve psg : [startg, endg) ↦→ [0, 1] for a game g represents her continuous belief throughout the game, where psg (t) is her belief for the winning probability of the blue team at time t (Figure 2). The belief curve can be generated from her belief updates. Formally,
Definition 1 (Belief curve). Subject s's belief curve is psg : [startg, endg) ↦→ [0, 1] where
The information flow is the collection of all the belief curves.
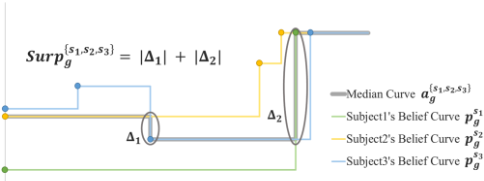
Median curve. To reduce the bias caused by irrational agents who always report extreme beliefs (e.g., 0%, or 100%), we use the median curve to compute the surprise amount. See Figure 1 for illustration of median curve and surprise amount.
Definition 2 (Median curve). For a game g which is watched by a set S of subjects, we define median curve aSg : [startg, endg] ↦→ [0, 1] as the median of the belief curve of all subjects in S for game g, namely
September to 31 October in Shanghai, China. There were 74 rounds of games in total and each game lasts for 30 to 40 minutes.
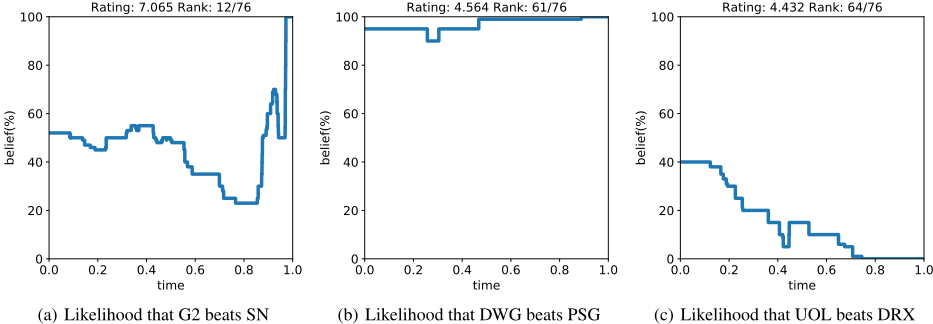
Figure 4 shows the median curves of three different games from our data set.
Surprise. Intuitively, if the median curve fluctuates severely, it suggests that this game has a high degree of surprise. Following Ely et al. [2015], we define the amount of surprise as the sum of the change in the median curve. 4 Formally,
Definition 3 (Surprise amount). Given a curve which is a step function in [x0, xm+1]
We define the surprise amount of this curve as
SurpSg := Surp(aSg ) is the amount of surprise in game g, which is the sum of absolute value of changes of the median curve aSg . 5 We define aSg1 as aSg restricted to [startg,midg] and aSg2 as aSg restricted to [midg, endg] where midg = startg+endg 2 . SurpSg1 := Surp (aSg1 ) is the amount of surprise in the first half of game g and SurpSg2 := Surp (aSg2 ) is the amount of surprise in the second half of game g.
Perceived quality vs. surprise. We estimate g's perceived quality by its average rating rS g over all subjects S who watch game g. To quantify the relationship both between the amount of surprise and perceived quality and also study the relationship between when the surprise occurs and perceived quality, we test the relationship between 1) game g's surprise amount SurpSg and its average rating rS g ; 2) game g's surprise amount in the first half SurpSg1 and rS g ; 3) game g's surprise amount in the second half SurpSg2 and rS g .
4 This is seeming unrelated to the "surprisal score" sometimes used in Machine Learning.
5 Since for all s ∈ S, psg(t) is a step function in [startg, endg] of finite intervals, aSg (t) is also a step function in [startg, endg] of finite intervals.
3 Data CollectionMethods
We first describe our Information Flow Elicitation Platform which was used to collect that data. Second, we describe the data we collected.
3.1 Information Flow Elicitation Platform
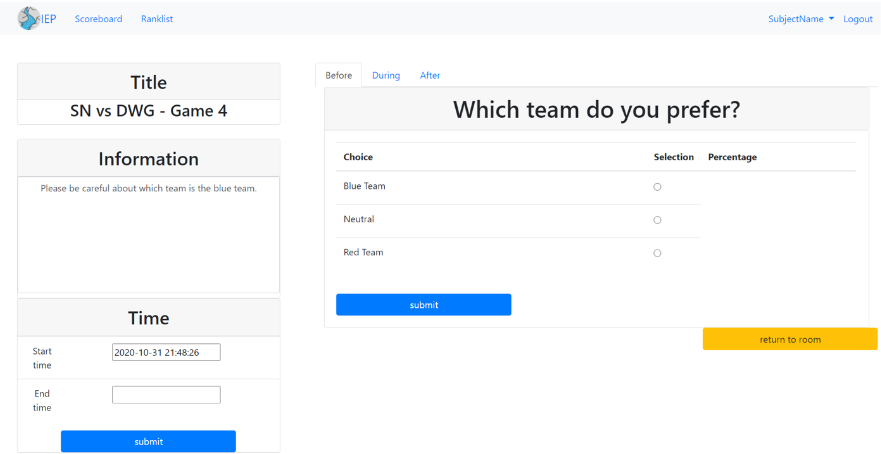
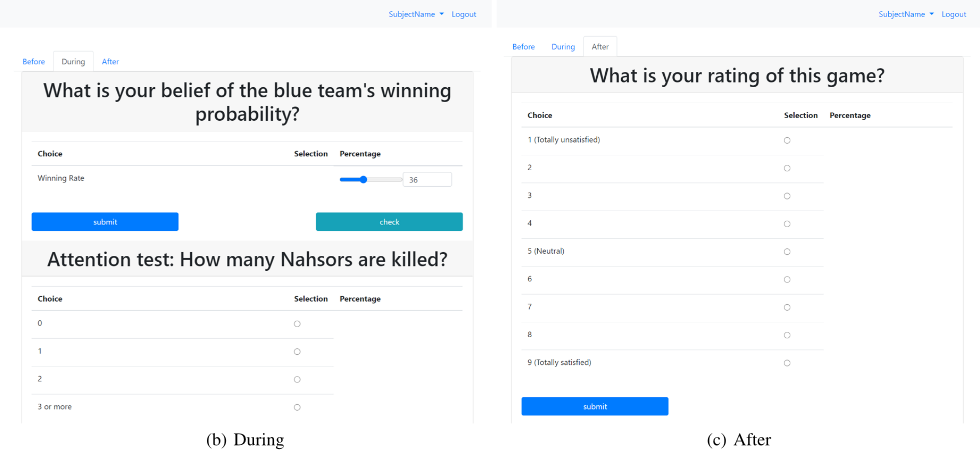
A game is a competition between two teams, e.g., the red team vs. the blue team. For each game, the study aims to collect three types of information from each subject: their team preference, their real-time belief of the blue team's winning probability, and their quality rating for the game. Specifically, there are three stages for each game: before, during, and after. Before the game, subjects report their preferences for the team. They also report their prior belief for the blue team's winning probability. During the game, subjects update their real-time belief of the winning probability whenever they want. After the game, they report their ratings for the game on a Likert scale, i.e., from 1 to 9, how much did you like the game?
Incentives. For each game, subjects receive a monetary reward which depends on their overall prediction accuracy. To measure the overall prediction accuracy, we use the quadratic scoring rule [Brier, 1950; Gneiting and Raftery, 2007] to measure the prediction accuracy at every t and integrate the quadratic score over [startg, endg].
Formally, each subject receives a score which depends on her belief curve. When the game ends, the outcome og for the blue team is either 0 or 1. Subject s's quadratic score at time t is 1 - (psg (t) - og)2 . The overall quadratic score of subject s is:
6 The screenshots of the game is from LOL S10's live streaming platform, https://www.bilibili.com/
For example, we consider a game where the starting time is 00:00, the ending time is 00:50, and the red team wins in the end. A subject reports her prior belief 40% for the winning probability of the blue team at the beginning. Then she updates her belief to 80% at 00:25, 50% at 00:30, and 0% at 00:40. Her score will be [(1-0.42 )×(25-0)-(1-0.82 )× (30 - 25) - (1 - 0.52 ) × (40 - 30) - (1 - 02 ) × (50 - 40)] × (1/50) = 0.86.
For subject s, at every time t, the expected quadratic score is maximized when psg (t) is her true belief at time t. The expected score is maximized when ∀ t, psg (t) is her true belief at time t. Thus, our score is incentive-compatible. However, this leads to non-fixed cost. To fix the budget, following Lambert et al. [2015], we calculate the average score over all subjects in game g, Scoreg. Subject s's reward is then
where Mg denotes the number of subjects in game g. With the aforementioned reward, the total reward for the game is fixed to B. Moreover, the reward is always non-negative and has the same incentive properties as the original score.
3.2 Datasets
League of Legends. League of Legends is a free 5v5 online MOBA (multiplayer online battle arena) game created and published by Riot Games. The goal of the teams is to destroy the enemy team's base. The match ends immediately after one teams' base is destroyed.
Data Properties. We use our platform to conduct a study for LOL S10 which consisted of 76 individual games. We recruited 107 subjects from top Chinese universities. For each game, a link to participate was sent out to all the participants. Subjects could participate in as many or as few games as they like. Additionally, we did not restrict the number of agents that signed up for each game.
We obtained 4,566 observations in total, where an observation consisted of one particular subject participating in one particular game. 5 subjects participated in all 76 games. 3 subjects of them only participate once. The average number of games that a subject participated in was 42.67.
Exploratory Data Analysis. The average score for our subjects in each game was 0.817. The average payment for our subjects in each game was 10.26 CNY (about $1.58 USD), yielding a total payment of 46,850 CNY (about $7,230 USD).
Moreover, the median frequency for belief updating is 5 and the average is 5.87. 68% subjects are majoring in STEM. All subjects report that they have experience watching LOL Live.
For each game, we can measure the number of subjects, the average rating, the duration, the peak time, the surprise in
(a) Before
the first half and the second half, the peak surprise, the end surprise and the overall surprise. The peak time measures the most surprising time in the game which we define as the middle of the time interval of 2.5 minutes that has the maximum amount of surprise. The peak surprise is defined as the surprise amount generated in the peak time. The end surprise is defined as the surprise amount generated in the last 2.5 minutes.
| average | min | max | |
|---|---|---|---|
| number of subjects | 59.974 | 28 | 83 |
| average rating | 5.709 | 3.600 | 8.235 |
| duration (min) | 32.039 | 18.817 | 45.317 |
| peak time (min) | 23.950 | 2.600 | 44.042 |
| 1st half surprise | 0.262 | 0.040 | 0.675 |
| 2nd half surprise | 0.531 | 0.010 | 1.445 |
| peak surprise | 0.278 | 0.090 | 0.790 |
| end surprise | 0.162 | 0 | 0.725 |
| overall surprise | 0.793 | 0.150 | 1.750 |
Table 1 displays the average, minimum, and maximum of each of these quantities. Note that on average, the surprise in the second half is twice the surprise in the first half.
Figure 5 shows a histogram of the first four of these quantities. Observe that the most frequent peak times are between 20 to 30 minutes. This corresponds to a key part of the matches, killing the first dragon (Baron Nashor), which appears exactly at the 20th minute of the match, and is typically killed between the 20 and 30 minute mark and grants the successful team a lasting advantage.
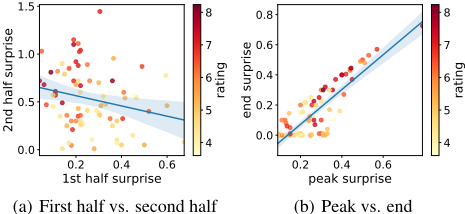
Figure 6(a) shows a scatter plot of the surprise in the first half and second half of each match. The points are colored by how exciting the match was, measured by the match's average rating. We can see that these values are negatively correlated.
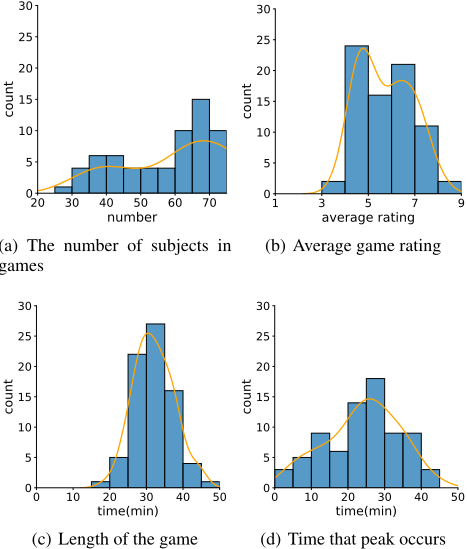
Figure 6(b) is a scatter plot of the surprise in the peak time and end time of each match. These values are positively correlated. We also find that peak is end for 19.7% games.
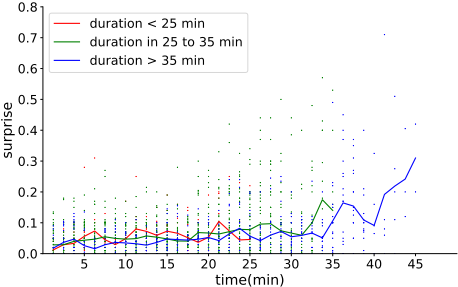
Figure 7 displays the amount of surprise over time. Short games, tend not to have too much surprise, perhaps, because the teams are unevenly matched. Long games tend to start off with less surprise, likely as the teams remain evenly matched, but have a substantial amount of surprise toward the end.
4 Results
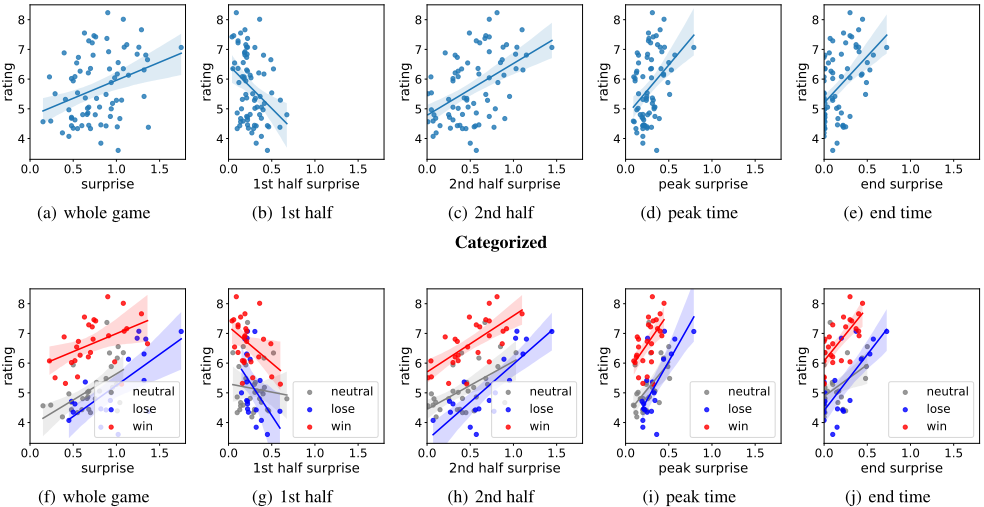
First, we analyze the relationship between the subjects' ratings and the amount of surprise in the game. We find that the average rating is significantly positively correlated with the amount of surprise (Figure 8(a), Table 2, Column (1)). We further divide the game into two halves and observe opposite effects between the two time windows. There is a significantly positive correlation between the ratings and the surprise amount in the second half (Figure 8(c), Table 2, Column (3)), while this correlation is negative in the first half (Figure 8(b), Table 2, Column (2)). This result remains when we regress on both the first half surprise and the second half surprise together (Figure 8(b), Table 2, Column (4)).
| (1) | (2) | (3) | (4) | |
|---|---|---|---|---|
| Surprise | 1.214∗∗∗ (0.399) | |||
| 1st half surprise | -2.921∗∗∗ (0.911) | -2.100∗∗ (0.846) | ||
| 2nd half surprise | 1.743∗∗∗ (0.368) | 1.533∗∗∗ (0.366) | ||
| Constant | 4.746∗∗∗ (0.340) | 6.473∗∗∗ (0.269) | 4.783∗∗∗ (0.227) | 5.444∗∗∗ (0.345) |
| N adj. R2 | 76 | 76 | 76 | 76 |
| 0.099 | 0.110 | 0.222 | 0.273 |
Importantly, the second half surprise better predicts the average rating than the overall surprise: the coefficient value is 1.743 for second half surprise while it is 1.214 for the overall surprise. Moreover, the adjusted R2 value is also greater when using second half surprise than when using the overall surprise. One possibility is that subjects may overweight their watching experiences in the second half of the game. Our result suggests that to optimize the information revelation strategy, the optimization goal should consider time factors and emphasize the later surprise more.
A possible explanation for this result is the peak-end-effect [Kahneman et al., 1993; Baddeley and Hitch, 1993]. That is, people judge an experience mostly based on how they felt at its peak, the most intense point, and at its end, rather than based on the sum of their feeling at all moments of the experience. Thus, we further analyze the effect of the peak surprise and the end surprise in our data (see definition in Section 3.2). Our results show that both of them are highly correlated with the average rating, while the end surprise has the highest correlation (see Table 3). Note that the end surprise explains even more than the second half surprise (the end surprise's adjusted R2 value is 0.232 which is greater than the second half surprise's adjusted R2 value 0.222).
Second, we observe a salient increase (decrease) in ratings for subjects whose preferred team wins (loses). In a game with audiences whose preferences are homogeneous, e.g., a popular team vs. an unpopular team, such individual rating biases lead to an unfairly high (low) average rating for a game depending on the outcome of the game. Therefore, we separate games into three categories: win, lose and neutral. The win (lose) category includes games where the winning (losing) team was preferred by a majority of subjects. The neutral category consists of games where neither team was preferred by the majority (recall that subjects can also be neutral in their
Uncategorized
| (1) | (2) | (3) | |
|---|---|---|---|
| Peak surprise | 3.459∗∗∗ (0.947) | -0.582 (1.637) | |
| End surprise | 3.146∗∗∗ (0.647) | 3.497∗∗∗ (1.183) | |
| Constant | 4.746∗∗∗ | 5.200∗∗∗ | 5.304∗∗∗ |
| (0.290) | (0.156) | (0.335) | |
| N | 76 | 76 | 76 |
| adj. R2 | 0.141 | 0.232 | 0.223 |
team preference). The results are in Figure 8(f) to 8(j) and Table 4. Again, we observe similar results across all three categories of games.
In addition to the amount of surprise, we also explore other factors that may affect the audience's average rating.
Comeback size. It is defined as one minus the minimum winning probability of the winner during the game. This feature characterizes how big the surprise of the outcome is. The coefficient value is 1.737 and the adjusted R2 value is 0.029.
Number of leader changes. It is defined as the number of times when the team with more than 50% winning probability changes. This feature characterizes the teamwith advantage changes. The coefficient value is -0.677 and the adjusted R2 value is 0.017.
Rubbish time. Given a threshold p, the rubbish time is defined as the proportion of time period between the last time that the winner's winning probability ≥ p and the end of the match. p is a parameter from 0.5 to 1. This feature characterizes the unsurprising time before the end. Intuitively, rubbish time is correlated with the end surprise and negatively correlated with the rating. Our results show that p = 0.7 has the best performance which has the coefficient value as -1.524 and the adjusted R2 value as 0.175.
Among the above three factors, the rubbish time is the most relevant factor but is still less effective than the end surprise.
| (1) all | (2) win game | (3) lose game | (4) neutral game | |
|---|---|---|---|---|
| Surprise | 1.692∗∗∗ (0.293) | 1.211∗∗∗ (0.489) | 2.088∗∗∗ (0.557) | 1.760∗∗∗ (0.507) |
| Win | 1.498∗∗∗ (0.198) | |||
| Lose | -0.376 (0.232) | |||
| Constant | 3.928∗∗∗ (0.251) | 5.783∗∗∗ (0.389) | 3.162∗∗∗ (0.585) | 3.879∗∗∗ (0.385) |
| N | 76 | 27 | 19 | 30 |
| adj. R2 | 0.575 | 0.165 | 0.420 | 0.276 |
5 RelatedWork
Surprise vs. perceived quality. Starting from Ely et al. [2015], a growing literature examines the relationship between the surprise and the perceived quality in different games, such as tennis games [Bizzozero et al., 2016], soccer games [Buraimo et al., 2020] and rugby games [Scarf et al., 2019].
However, instead of eliciting belief curves, this literature typically constructs them from existing data. For example, Bizzozero et al. [2016] model the probability of a certain side winning by explicitly using tennis's scoring systems. Similarly, Buraimo et al. [2020] use an in-play model which additionally exploits the information on team strength which is embedded in the pre-match odds. Buraimo et al. [2020] and Scarf et al. [2019] both use the Poisson model to estimate the number of goals scored by the participating teams in order to calculate the probability of the final outcome of the game. Lucas et al. [2017] analyze the tweets during the World Cup and use the emotional changes to measure the surprise. In contrast to these studies which estimate surprise using statistical models, our study measures the perceived surprise amount by dynamically eliciting subjects' beliefs.
These works also use different proxies for perceived quality. Buraimo et al. [2020] analyze the relationship between surprise and the real-time audience size for both halves of soccer games. Instead, we focus on the relationship between surprise and the overall rating. Thus, prior studies do not observe how the timing effects of surprise affect perceived quality.
In addition to surprise, massive literature also studies suspense, which is defined as how much the belief curve is expected to move in the very near future. Since measuring suspense requires the ability to predict what might happen in the near future, the analysis for suspense is beyond the scope of the paper. In the future, it might be possible to learn a model from the data which enables the analysis of suspense.
Prediction markets and polls. Prediction markets are designed to elicit continuously updated forecasts about uncertain events. Prior studies have proved that prediction market can outperform internal sales projections [Plott and Chen, 2002], journalists' forecasts of Oscar winners [Pennock et al., 2001], and expert economic forecasters [Gurkaynak and Wolfers, 2006].
In prediction polls, forecasters express their beliefs by answering questions like "how likely is this event?". In both prediction markets and polls, forecasters can update their predictions whenever they wish. In contrast to prediction markets, in prediction polls, forecasters update their predictions individually. Rothschild and Wolfers [2011]'s work shows that using prediction polls in elections can achieve better accuracy than opinion polls.
A few studies have compared the performance of prediction markets and polls, though there is no conclusive answer [Goel et al., 2010; Rieg and Schoder, 2010; Atanasov et al., 2017]. Both Goel et al. [2010] and Rieg and Schoder [2010] find no significant differences between these two methods. Atanasov et al. [2017] find that the aggregation rules in prediction polls affect its accuracy level. For example, simply averaging all polls performs worse than a prediction market, while weighting the polls properly leads to a better performance than a prediction market. Our elicitation method is more similar to prediction polls.
6 Conclusion
We study the relationship between a game's surprise amount and its perceived quality. We develop a platform that collects audiences' real-time beliefs and ratings of the LOL S10. Our empirical analysis suggests that the level of surprise in the later time of a game has a stronger impact on subjects' ratings. This indicates that the audience would prefer surprise to occur in the end of a game. A future direction is to define a new perceived quality model that considers time factors and theoretically analyze the optimal way to reveal information over time in this model. Future work could similarly optimize suspense.
Moreover, we expect that belief polls could be embedded in live streaming games as an entertainment feature. Last but not least, we can collect other information such as the text in bullet comments to better construct the information flow.
Acknowledgments
We would like to thank our anonymous reviewers for their insightful suggestions which substantially improved the paper. We also thank Kening Ren, Jialun Yang, Xinlun Zhang, Fan Yan and Zheng Zhong for their help and useful discussions. Finally, we thank our participants in our LOL S10 study for their time, attention and effort. Some of the figures are generated with Python Matplotlib [Hunter, 2007].
@inproceedings{ijcai2021p36,
  title     = {SURPRISE! and When to Schedule It.},
  author    = {Huang, Zhihuan and Xu, Shengwei and Shan, You and Lu, Yuxuan and Kong, Yuqing and Liu, Tracy Xiao and Schoenebeck, Grant},
  booktitle = {Proceedings of the Thirtieth International Joint Conference on
               Artificial Intelligence, {IJCAI-21}},
  publisher = {International Joint Conferences on Artificial Intelligence Organization},
  editor    = {Prof. Zhi-Hua Zhou},
  pages     = {252--260},
  year      = {2021},
  month     = {8},
  note      = {Main Track},
  doi       = {10.24963/ijcai.2021/36},
  url       = {https://doi.org/10.24963/ijcai.2021/36},
}
TY - CPAPER TI - SURPRISE! and When to Schedule It. AU - Huang, Zhihuan AU - Xu, Shengwei AU - Shan, You AU - Lu, Yuxuan AU - Kong, Yuqing AU - Liu, Tracy Xiao AU - Schoenebeck, Grant T2 - Proceedings of the Thirtieth International Joint Conference on Artificial Intelligence, IJCAI-21 PB - International Joint Conferences on Artificial Intelligence Organization PY - 2021 SP - 252 EP - 260 DO - 10.24963/ijcai.2021/36 UR - https://doi.org/10.24963/ijcai.2021/36 ER -Copied
Machine-readable versions of this paper, for tools and AI agents:





