
Hierarchical Adaptive Temporal-Relational Modeling for Stock Trend Prediction
Proceedings of the Thirtieth International Joint Conference on Artificial Intelligence. Main Track. Pages 3691-3698.
https://doi.org/10.24963/ijcai.2021/508
Keywords
- Multidisciplinary Topics and Applications: Economic and Finance
- Data Mining: Classification
Abstract
Stock trend prediction is a challenging task due to the non-stationary dynamics and complex market dependencies. Existing methods usually regard each stock as isolated for prediction, or simply detect their correlations based on a fixed predefined graph structure. Genuinely, stock associations stem from diverse aspects, the underlying relation signals should be implicit in comprehensive graphs. On the other hand, the RNN network is mainly used to model stock historical data, while is hard to capture fine-granular volatility patterns implied in different time spans. In this paper, we propose a novel Hierarchical Adaptive Temporal-Relational Network (HATR) to characterize and predict stock evolutions. By stacking dilated causal convolutions and gating paths, short- and long-term transition features are gradually grasped from multi-scale local compositions of stock trading sequences. Particularly, a dual attention mechanism with Hawkes process and target-specific query is proposed to detect significant temporal points and scales conditioned on individual stock traits. Furthermore, we develop a multi-graph interaction module which consolidates prior domain knowledge and data-driven adaptive learning to capture interdependencies among stocks. All components are integrated seamlessly in a unified end-to-end framework. Experiments on three real-world stock market datasets validate the effectiveness of our model.
- [Bacry et al., 2015] Emmanuel Bacry, Iacopo Mastromatteo, and Jean-Franc ¸ois Muzy. Hawkes processes in finance. Market Microstructure and Liquidity, 1(01):1550005, 2015.
- [Chen et al., 2018] Yingmei Chen, Zhongyu Wei, and Xu- anjing Huang. Incorporating corporation relationship via graph convolutional neural networks for stock price pre- diction. In CIKM, pages 1655-1658, 2018.
- [Dauphin et al., 2017] Yann N. Dauphin, Angela Fan, Michael Auli, and David Grangier. Language modeling with gated convolutional networks. In ICML, pages 933- 941, 2017.
- [Ding et al., 2015] Xiao Ding, Yue Zhang, Ting Liu, and Junwen Duan. Deep learning for event-driven stock pre- diction. In IJCAI, pages 2327-2333, 2015. IJCAI
- [Ding et al., 2020] Qianggang Ding, Sifan Wu, Hao Sun, Ji- adong Guo, and Jian Guo. Hierarchical multi-scale gaus- sian transformer for stock movement prediction. In IJCAI, pages 4640-4646, 2020. IJCAI
- [Fawaz et al., 2019] Hassan Ismail Fawaz, Benjamin Lucas, Germain Forestier, Charlotte Pelletier, Daniel F Schmidt, Jonathan Weber, Geoffrey I Webb, Lhassane Idoumghar, Pierre-Alain Muller, and Franc ¸ois Petitjean. Inception- time: Finding alexnet for time series classification. arXiv preprint arXiv:1909.04939, 2019.
- [Feng et al., 2019] Fuli Feng, Xiangnan He, Xiang Wang, Cheng Luo, Yiqun Liu, and Tat-Seng Chua. Temporal re- lational ranking for stock prediction. TOIS, 37(2):1-30, 2019.
- [Kavitha et al., 2013] G Kavitha, A Udhayakumar, and D Nagarajan. Stock market trend analysis using hidden markov models. arXiv preprint arXiv:1311.4771, 2013.
- [Kewei and Hou, 2007] Kewei and Hou. Industry informa- tion diffusion and the lead-lag effect in stock returns. The Review of Financial Studies, 20(4):1113-1138, 2007.
- [Khaidem et al., 2016] Luckyson Khaidem, Snehanshu Saha, and Sudeepa Roy Dey. Predicting the direction of stock market prices using random forest. arXiv preprint arXiv:1605.00003, 2016.
- [Kingma and Ba, 2014] Diederik P Kingma and Jimmy Ba. Adam: A method for stochastic optimization. arXiv preprint arXiv:1412.6980, 2014.
- [Kipf and Welling, 2017] Thomas N. Kipf and Max Welling. Semi-supervised classification with graph convolutional networks. In ICLR, 2017.
- [Lai et al., 2017] Lin Lai, Chang Li, and Wen Long. A new method for stock price prediction based on mrfs and SSVM. In ICDM, pages 818-823, 2017.
- [Laub et al., 2015] Patrick J. Laub, T. Taimre, and P. K. Pol- lett. Hawkes processes. arXiv preprint arXiv:1507.02822, 2015.
- [Li et al., 2018] Yaguang Li, Rose Yu, Cyrus Shahabi, and Yan Liu. Diffusion convolutional recurrent neural net- work: Data-driven traffic forecasting. In ICLR, 2018.
- [Li et al., 2020] Wei Li, Ruihan Bao, Keiko Harimoto, Deli Chen, Jingjing Xu, and Qi Su. Modeling the stock relation with graph network for overnight stock movement predic- tion. In IJCAI, pages 4541-4547, 2020. IJCAI
- [Liu et al., 2018] Qikai Liu, Xiang Cheng, Sen Su, and Shuguang Zhu. Hierarchical complementary attention net- work for predicting stock price movements with news. In CIKM, pages 1603-1606, 2018.
- [Lo and Mackinlay, 2015] Andrew W. Lo and A. Craig Mackinlay. When are contrarian profits due to stock market overreaction? The Review of Financial Studies, 3(2):175-205, 2015.
- [Nayak et al., 2015] Rudra Kalyan Nayak, Debahuti Mishra, and Amiya Kumar Rath. A naïve svm-knn based stock market trend reversal analysis for indian benchmark in- dices. Applied Soft Computing, 35:670-680, 2015.
- [Qin et al., 2017] Yao Qin, Dongjin Song, Haifeng Chen, Wei Cheng, Guofei Jiang, and Garrison W. Cottrell. A dual-stage attention-based recurrent neural network for time series prediction. In IJCAI, pages 2627-2633, 2017. IJCAI
- [Sawhney et al., 2021] Ramit Sawhney, Shivam Agarwal, Arnav Wadhwa, Tyler Derr, and Rajiv Ratn Shah. Stock selection via spatiotemporal hypergraph attention net- work: A learning to rank approach. In AAAI, pages 497- 504, 2021.
- [Shih et al., 2018] Shun-Yao Shih, Fan-Keng Sun, and Hung-Yi Lee. Temporal pattern attention for multivari- ate time series forecasting. Mach. Learn., 108(8-9):1421- 1441, 2018.
- [Srivastava et al., 2014] Nitish Srivastava, Geoffrey Hinton, Alex Krizhevsky, Ilya Sutskever, and Ruslan Salakhutdi- nov. Dropout: a simple way to prevent neural networks from overfitting. JMLR, 15(1):1929-1958, 2014.
- [Vaswani et al., 2017] Ashish Vaswani, Noam Shazeer, Niki Parmar, Jakob Uszkoreit, Llion Jones, Aidan N. Gomez, Lukasz Kaiser, and Illia Polosukhin. Attention is all you need. In NIPS, pages 5998-6008, 2017.
- [Wang et al., 2020] Heyuan Wang, Tengjiao Wang, and Yi Li. Incorporating expert-based investment opinion sig- nals in stock prediction: A deep learning framework. In AAAI, pages 971-978, 2020.
- [Wu et al., 2019] Zonghan Wu, Shirui Pan, Guodong Long, Jing Jiang, and Chengqi Zhang. Graph wavenet for deep spatial-temporal graph modeling. In IJCAI, pages 1907- 1913, 2019. IJCAI
- [Yu and Koltun, 2016] Fisher Yu and Vladlen Koltun. Multi- scale context aggregation by dilated convolutions. In ICLR, 2016.
- [Zhang et al., 2017] Liheng Zhang, Charu Aggarwal, and Guo-Jun Qi. Stock price prediction via discovering multi- frequency trading patterns. In KDD, pages 2141-2149, 2017.
- [Zhao et al., 2016] Bo Zhao, Yongji He, Chunfeng Yuan, and Yihua Huang. Stock market prediction exploiting mi- croblog sentiment analysis. In IJCNN, pages 4482-4488, 2016.
References were extracted automatically from the PDF and may contain errors.
Full text extracted automatically from the PDF; figures, tables and equations may differ. The PDF is the version of record.
1 Introduction
With continual increase of market capitalization, trading of financial securities like stocks has become an important investment avenue [Ding et al., 2020]. However, stock trend prediction is difficult due to the complex dynamics and dependencies of involved corporations. With the rise of artificial intelligence technology, many works about automatic classification or regression of stock prices have been proposed to help investors make better decisions [Feng et al., 2019].
∗Corresponding Author.
Traditional approaches for stock trend prediction are based on time series analyses using machine learning algorithms such as ARIMA, SVM and Kalman Filters [Nayak et al., 2015; Khaidem et al., 2016]. Recently deep neural networks show promising capability of distilling complicated hidden features of stock data [Chen et al., 2018; Ding et al., 2020]. While having exhibited performance improvements, most current methods face limitations in fully exploiting the temporal and relational characteristics of stock market.
A basic assumption of stock trend prediction is that clues of a stock's future change can be revealed from its historical dynamic patterns. As a natural choice, RNN structures are commonly-used to model the stock evolution history (e.g., daily technical records) and update memory states sequentially [Qin et al., 2017; Zhang et al., 2017; Wang et al., 2020]. Nevertheless, the RNNs are ineffective to capture long-term dependences as well as fine-grained feature units of local time spans (e.g., three time steps). Since stock fluctuations are not only conditioned on global profiles but on mixtures of long- and short-term transition regularities, it may hinder precise discrimination of stock trends without localized feature perceptions. Besides, the training process of RNN-based approaches is usually time-consuming and may suffer from gradient vanishing. In contrast, CNNs are able to model local signals and generate high-order representations [Fawaz et al., 2019], while the parameters will increase rapidly to cover long-term receptive fields along deep encoding layers.
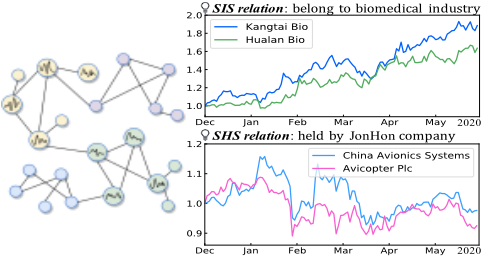
On the other hand, different from general time series classification problems, the evolving trend of stock market has significant internal dependencies, i.e., related stocks tend to exhibit synchronous change patterns, furnishing auxiliary clues to facilitate individual stock prediction. However, current studies mostly treat each stock as isolated for prediction [Ding et al., 2020; Wang et al., 2020], or detect their relations simply based on heuristic rules [Lai et al., 2017] or a prior-fixed graph structure [Chen et al., 2018]. Genuinely, stock associations may stem from various aspects. Figure 1 depicts the price curves of stock objects with different relationships. SIS (Stock-Industry-Stock) and SHS (Stock-HolderStock) refer to stocks belonging to the same industry or held by the same top shareholders respectively. As a result of COVID-19 outbreak, Kangtai and Hualan which are biomedical related stocks demonstrate conspicuous upward trends. Highly similar fluctuation patterns also exist between China Avionics Systems and Avicopter Plc, both of which are held by JonHon, a China's leading aviation manufacturer. More generally, a stock vertex may connect to multiple neighbors via different dependency semantics, imposing the necessity of handling stock correlations with multi-graph settings.
In this paper, we propose a novel Hierarchical Adaptive Temporal-Relational Network (HATR) for stock trend prediction. To remedy the drawbacks of vanilla RNNs and CNNs in temporal modeling, we encapsulate multi-scale dilated causal convolutions [Yu and Koltun, 2016] and gating paths [Dauphin et al., 2017] in a unified module to extract local and long-term volatility patterns of stock history. With hierarchical layers, the receptive fields grow exponentially thereby context features across different time spans are gradually grasped. In light of the unique traits of stocks that some tend to be stable while others are highly volatile, we further introduce a dual attention mechanism with Hawkes process and target-specific query to detect significant temporal points and scales to customize stock representations. For the relational view, we explore the stock interdependences via multigraph diffusion convolution layers, where the adjacency tensors are built from domain knowledge as well as data-driven automatic learning. All components are integrated seamlessly in an end-to-end framework, predicting the stock movements effectively. Our contributions can be summarized as:
- We propose a hierarchical temporal module to capture multi-grained dynamic patterns of stocks. A time- and scale-wise dual attention mechanism is designed to identify salient signals with reference to individual traits.
- We develop a multi-graph interaction module to learn correlations among stocks, for which a data-driven adaptive graph is learned to automatically discover hidden dependencies getting rid of prior domain knowledge.
- The temporal-relational modules are jointly trained to characterize and predict stock evolutions. Experiments on three real-world stock market datasets validate the effectiveness and efficiency of the proposed HATR.
2 RelatedWork
Technical Analysis Conventional financial models focus on technical analysis, extract price-volume indicators from historical transaction data, and use machine learning algorithms such as HMM, SVM, Random Forest to model stock dynamics [Kavitha et al., 2013; Nayak et al., 2015; Khaidem et al., 2016]. However, building effective technical features usually requires massive expertise, and the hypothetical stochastic process may be not optimal for simulating the highly non-linear and non-stationary fluctuations of stock markets. Recently deep neural networks have been employed for stock prediction, where RNN-based models are widely used to capture the sequential dependencies [Qin et al., 2017; Shih et al., 2018]. For instance, Qin et al. [2017] enhanced LSTM with attention mechanisms to extract driving input signals and hidden states. Zhang et al. [2017] adapted LSTM with a state frequency memory to discover and regulate the multi-frequency patterns of stock price changes. Despite advanced memory cells, these models only store limited information while the fine-grained feature signals implied in local temporal segments are not well captured.
Fundamental Analysis As web information grows, some researches exploit alternative data besides technical signals from social media to facilitate the stock prediction [Ding et al., 2015; Liu et al., 2018; Wang et al., 2020]. For instance, Ding et al. [2015] introduced a neural tensor network to extract event embeddings of news to predict stock movement. Zhao et al. [2016] filtered stock-related microblogs based on LDA and used a domain lexicon to derive public emotions. Liu et al. [2018] improved bi-directional GRU network with complementary attentions to identify important segments in financial news. Wang et al. [2020] devised an expert mining procedure to detect high-quality investment opinions.
Market Relation Modeling A new line of work explores graph-structured data to capture the interdependencies among stocks. Lai et al. [2017] figured out related stocks by querying collaboration and competition on search engines, then used a graph-cut algorithm for inference based on unary and binary potentials. Chen et al. [2018] built a corporation graph based on the shareholding relationship, and turned stock prediction into node classification issue with Graph Convolutional Network (GCN) [Kipf and Welling, 2017]. Feng et al. [2019] augmented GCN with LSTM cells to model stock dynamics and interrelations for investment ranking. Despite progresses made in graph-based stock trend prediction, they mainly detect stock relations based on heuristic rules or simplistic graph structures, heavily relying on fixed prior knowledge.
3 ProposedMethod
3.1 ProblemFormulation
We formulate stock prediction as a binary node classification task - discretizing future price movement into Rise or Fall via synthetic temporal-relational modeling. Let S = {s1, s2, . . . , sN} denote N individual stocks, the topological graph is represented as G = (S, E), where E is the set of stock adjacency relations, emij ∈ E indicates the correlated intensity between si and sj w.r.t. the mth -type relation. For each node, its historical technique signals with lag size of ∆T constitute a input tensor X ∈ R∆T×ds , where ds is the initial feature dimension. The aim is to predict the label y = I(pt+ξ > pt), where pt is stock close price at time step t.
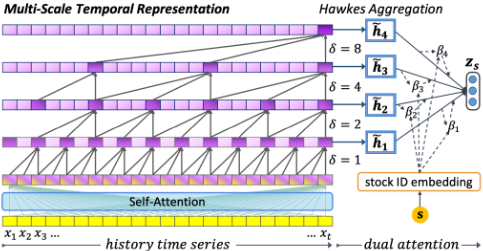
The proposed HATR consists of two major modules, i.e., a temporal module to customize stock representations from historical volatilities; the learned node feature matrix is fed into a relational module to capture stock dependencies. We present detailed mechanisms in the following sections.
3.2 Multi-Scale Temporal Representation
We introduce a multi-scale temporal representation module to extract volatility patterns of stock history. The architecture is shown in Figure 2, which comprises a self-attention layer and stacked gated causal convolution layers with different dilation rates. A Hawkes process is adapted to identify salient points of time axis at each representation layer, and a target-specific attention query is used for scale-wise aggregation.
Encoding Layers
Given the input time series X1:t of a stock object, we first adopt a self-attention layer to model intra step-wise dependencies. Each step in X (query) could be enhanced by attending to other distant similar steps (keys), where the similarity is calculated via scaled dot product [Vaswani et al., 2017]:
where Q, K, V are the same tensors as X, a row Att(i) is a fused vector of the feature sequence weighted by relevance coefficients with the i-th step. We add residual connection to update Xi = Xi + Att(i).
We then consolidate dilated causal convolutions [Yu and Koltun, 2016] and gated linear units (GLU) [Dauphin et al., 2017] in skip-connected layers to capture the features of local contexts. Unlike standard convolution that convolves a contiguous subsequence of input, dilated convolution receives wider receptive fields by skipping interval "holes". Given a kernel Kf of size 2w+1, the dilated convolution is:
where ⊕ is vector concatenation, δ is the dilation rate to control skipping distance. As depicted, by hierarchically stacking the convolution layers with wider dilation rates, the receptive field expands exponentially (e.g., [3-7-15] for kernels Stock Graph Adjacency Tensor Multi-Graph Convolution with size of 3 and dilation rates of [1-2-4]), while the number of parameters grows only linearly. Thereby the information across multi-scale time spans can be gradually harvested with less layers, which is beneficial to save computational consumptions and avoid information loss caused by downsampling operations. Inspired by the success of gating mechanism in RNN structures, we further employ GLU to parcel the convolutional operations, which provides both linear and non-linear computational paths to enable effective information flow through tiered layers:
where Θ1, Θ2 are a group of kernels, b1 and b2 are biases, ∗ is dilated convolution operator, σ is sigmoid function controlling the ratio of transmitted information, and ⊙ is elementwise product between matrices. Starting with δ = 1 (equals to standard convolution) to ensure no loss of coverage on the input, we devise the dilation rates of L layers based on the performance in validation. The feature output of layer l is denoted as h(l) = [h(l) t-τl+1 , . . . , h(l) t ] ∈ Rτl×dc , where dc is the number of gated convolutions applied per layer.
Time and Scale-wise Dual Attention
Intuitively, historical fluctuation patterns have different relevance on stock's future evolution. The literature of temporal point process (e.g., Hawkes process [Laub et al., 2015]) suggests that previous events excite subsequent changes in continuous time. Studies show that in stock markets, the impacts of event stream (i.e., release of earning report, production reform) decay as time goes [Bacry et al., 2015; Sawhney et al., 2021]. To this end, we adapt Hawkes process for time-wise attention to aggregate sequential features of each encoding layer. The weight of time step k at the l-th layer is:
where W is a harmony matrix, ϵ is excitation coefficient, γ is a decay rate and ∆tk is the lag of time k to current step. The l-th layer features are summarized as ˜hl = ∑k λk(l; θ)h(l) k .
In light of different dynamic amplitude and frequency of individual stocks, the transition regularities of different longand short-term scales also exhibit varied impacts. We propose a target-specific attention mechanism to identify the scalewise importance. For each stock s, we employ an embedding layer upon its unique ID to tailor a specific query:
where e1:N ∈ RN×du is a trainable look-up table randomly initialized in [-0.1,0.1]. The weights of stacked representation layers with different feature scales are adaptively computed with the guidance of target-specific stock query:
Then the compact representation of each stock is customized as z = ∑Ll=1 βl ˜hl, all stocks form the tensor Z ∈ RN×dv .
3.3 Stock InterrelationModeling
Using the tensor derived from temporal module as inputs of graph nodes, next we present the relational module to spread information among stocks via multi-aspect relationships.
Graph Construction of Various Relations
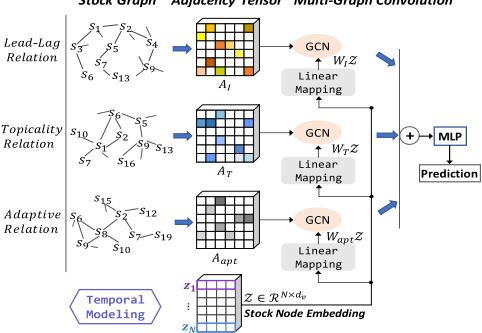
As shown in Figure 3, we extract cross effects among a clique of stocks from three perspectives based on prior knowledge and automatic learning. For each type of relationship r ∈ R, an adjacency matrix Ar =(aij)N×N is built for the graph Gr, indicating the correlated intensity between stock pairs.
(1) Industry Graph GI : The industry concept is essential in stock markets. Stocks in the same industry usually display a pronounced lead-lag structure, i.e., some systematically lead or lag others in the change of returns [Lo and Mackinlay, 2015]. This effect can be explained by the information diffusion hypothesis [Kewei and Hou, 2007] - industry leaders are more responsive to new messages, which mainly depends on the firm size and is rather weak for inter-industry. We use registered capital (C) and turnover (T) to measure the firm size, and set aij = Cj Ci + Tj Ti between intra-industry stocks.
(2) Topicality Graph GT : As web information grows, more hidden topicality associations of listed companies can be found from online resources. The first- and second-order linkages on Wikidata [Feng et al., 2019] provide useful clues. The schema A R -→B indicates that stocks A and B has relation R such as supplier-consumer, while A R1 --→M R2 ←-- B denotes that stocks A and B are connected to entity M, revealing relations such as owned by the same top shareholder. Moreover, many social websites enable millions of investors to post and discuss their portfolios and trading opinions. Stocks co-mentioned in the same review text conform to user-perceived relevance. We follow [Wang et al., 2020] and adopt a financial lexicon to discover stock pairs with consistent bullish/bearish semantics, and retain stable correlations with high co-occurrences. An edge is attached to two matching stocks, weighted by the number of related topicalities.
(3) Self-Adaptive Graph Gapt: Inspired by Wu et al. [2019], predefined graphs that require expert domain knowledge may be insufficient for characterizing sophisticated entity relationships. To discover the hidden dependencies of stocks, we further introduce two ID embedding dictionaries En1,En2 ∈ RN×de , which are randomly initialized and then tuned during model training to represent the source and target stock nodes. In this way, a self-adaptive adjacency matrix is constructed by judging and normalizing the node similarities:
Diffusion Graph Convolution
The graph convolutional network (GCN) distributes information of neighboring nodes along structured connections. The state-of-the-art formulation of a GCN propagation layer is:
where ̂ A = ˜D- 12 ˜ A˜D- 12 , ˜ A = A+IN is the adjacency matrix added with self-loop connections from the identity matrix, ˜Dii = ∑j ˜ Aij, W (k-1) G is a layer-wise trainable weight, and g(·) is the activation operation. Nevertheless, this function can not handle the relational modeling on multiple graphs as well as the Industry Lead-Lag graph with asymmetric adjacency weights. Li et al. [2018] proved that the stationary distribution of graph signal diffusions can be expressed as a combination of power series of the transition matrix. Therefore, the GCN layers can be replaced by diffusion convolutions with K finite steps. Specifically, we follow [Wu et al., 2019] and divide two transition matrices with forward and reverse directions Pf = ˜ A/rowsum( ˜ A), Pv = ˜ AT /rowsum( ˜ AT ) for the case of a directed graph, otherwise we set P = ˜ A/rowsum( ˜ A). Both hand-crafted and self-adaptively learned relationships are then jointly encoded as follows:
where P kψ is the k-power series of the transition matrix of relation type Rψ, ⊕ means row-wise concatenation of matrices, and ΘG is the parameter used for a linear mapping.
3.4 Prediction Layer
We integrate the temporal-relational modules in an end-toend framework. The stock trend prediction is then reformulated as a node classification problem, which passes the graph output to dense layers to derive rise/fall probabilities:
where σ is the sigmoid function. Parameters are learned by minimizing the cross entropy loss over M training samples:
4 Experiments
4.1 Dataset and Experimental Setting
We verify HATR on three real-world datasets for comprehensive evaluation. Table 1 shows the detailed statistics. The first dataset comprises stocks from the well-know CSI-300 Composite Index, which replicates the large-cap corporations with good liquidity in Shanghai & Shenzhen stock exchanges; The second dataset is targeted at stocks from popular S&P500 Composite Index spanning NASDAQ and NYSE markets that have continuous trading records between 07/2015 and 02/2020; The third dataset [Li et al., 2020] is from Tokyo Stock Exchange, including 95 stocks with the largest market capitalization in Japan from the TOPIX-100 Index.
| CSI (China) | SPX (US) | Topix (Japan) | |
|---|---|---|---|
| # Stocks | 300 | 485 | 95 |
| # Period | 2016.05-2020.06 | 2015.07-2020.02 | 2015.11-2020.08 |
| # Split Records | 683:171:139 | 787:197:169 | 814:204:144 |
| GI Sparsity† | 0.9453 | 0.9474 | 0.9419 |
| Avg/Max Degree | 16.36 / 43 | 25.47 / 42 | 5.46 / 11 |
| GT Sparsity† | 0.9759 | 0.9789 | 0.9178 |
| Avg/Max Degree | 7.18 / 44 | 10.23 / 39 | 7.72 / 29 |
We collect the daily quote data, industry and capital information from Wind-Financial Terminal 1 . To mine topicality relations, we detect co-occurrence stock pairs in user reviews from a popular Chinese investment forum Xueqiu 2 for the CSI dataset, and collect first- and second-order linkages from Wikidata 3 for the SPX and Topix datasets. The training/validation/test sets are strictly split in chronological order to avoid data leakage problems. For each sample, we look back 60 consecutive days and predict price change on the next week. Features used in all datasets consist of split-adjusted daily open, high, low, close prices and trading volume, which are normalized following [Feng et al., 2019].
In our experiments, a 4-layer stacking hierarchy with the dilation list of {1-2-3-4} is employed for temporal representations. The window size and the number of gated convolution kernels at each layer were set to 3 and 32. The dimensions of randomly initialized stock ID embeddings and node embeddings were set to 20 for Topix and 30 for CSI and SPX, the target-specific query for attending to important temporal scales has a dimension of 16. The finite step K for graph diffusions is set to 2. We apply dropout [Srivastava et al., 2014] at the end of each layer to mitigate overfitting and the drop rate is 0.3. Parameters are tuned using Adam optimizer [Kingma and Ba, 2014] on a single NVIDIA TitanXp GPU for 100 epochs, the learning rate is 0.0005 and the batch size is 200. We independently repeated each experiment for 5 times and reported average results on ACC, AUC, F1-score and Matthews Correlation Coefficient (MCC).
4.2 Performance Evaluation
We compare the proposed HATR with following baselines:
- SVM & RF [Nayak et al., 2015; Khaidem et al., 2016] are two widely used machine learning algorithms applied for stock prediction based on numeric price indicators.
1 https://www.wind.com.cn/en/wft.html
- DA-RNN [Qin et al., 2017] extracts driving inputs and relevant states using LSTM with attention mechanisms.
- SFM [Zhang et al., 2017] adapts RNNs with state frequency memory to discover multi-frequency trading patterns leveraging Discrete Fourier Transform (DFT).
- GCN [Kipf and Welling, 2017] takes time series data as the input of nodes to spread information on stock graph.
- TPA-LSTM [Shih et al., 2018] transforms time-invariant features of stock dynamics in the frequency domain by combining attentive LSTM and convolution operations.
- TGC [Feng et al., 2019] uses LSTM to encode stock history and feeds the last states to GCN to explore relations.
- InceptionTime [Fawaz et al., 2019] is a deep ensemble of CNN models simulating the Inception-v4 architecture to extract hierarchical time-series features.
- HMG-TF [Ding et al., 2020] enhances the encoder of Transformer with Gaussian prior and trading gap splitter to model the sequential data of each stock.
- HATR-MT is a variant of HATR encoding stock time series by LSTM, w/o multi-scale temporal representations.
- HATR-MR is a variant of HATR, w/o the multi-graph relational module for capturing stock interdependencies.
The evaluation results of different methods are shown in Table 2, from which we have several observations: 1) Neuralbased methods (e.g., DA-RNN, HMG-TF, TGC) generally outperform traditional machine learning models (e.g., SVM and RF), proving that deep learning frameworks with the ability to detect complex hidden features are promising for modeling financial data. Note that the advantage of InceptionTime which adopts deep layers of standard CNNs is not always significant. As the patterns of stock time series are not as distinct and regular as in images, using a too huge ensemble architecture may aggravate the problem of overfitting. 2) Our model achieves conspicuous improvements in terms of most metrics on all datasets. Compared with the RNN-based models and those harvesting multiple local features as well as employing additive attention to learn informative signals, HATR is about 6.4x faster than DA-RNN, 18.2x faster than InceptionTime and 1.5x faster than HMG-TF in training, which exhibits the efficiency of the proposed architecture. Moreover, decomposing HATR into HATR-MT and HATR-MR results in performance degradations, which indicates the synthetic contributions from temporal and relational modules. 3) Exploiting stock interrelations could usually impose positive effect on individual trend predictions. GCN directly feeds time-series indicators as node input for graphs, which is incompetent without capturing the dependencies cross temporal steps. Meanwhile HATR-MT generally surpasses TGC with the guidance of multi-relational graphs. Besides, HATR-MR excels most RNN and CNN adaptations with the help of customized multi-scaled temporal representations.
4.3 Analysis
In this section, we conduct further experimental analyses to understand how different components and hyper-parameters affect the performance of proposed HATR.
| Methods | CSI Dataset | SPX Dataset | Topix Dataset | |||||||||
|---|---|---|---|---|---|---|---|---|---|---|---|---|
| ACC | AUC | F1 | MCC | ACC | AUC | F1 | MCC | ACC | AUC | F1 | MCC | |
| SVM | 55.87 | 54.26 | 54.56 | 6.29 | 54.27 | 52.15 | 51.05 | 4.55 | 54.28 | 51.45 | 53.22 | 3.68 |
| RF | 56.94 | 53.97 | 56.28 | 7.47 | 55.01 | 51.57 | 50.95 | 4.61 | 54.02 | 50.65 | 54.03 | 3.92 |
| DA-RNN | 64.51 | 58.17 | 58.72 | 12.05 | 61.18 | 55.34 | 55.52 | 13.30 | 58.89 | 54.66 | 56.29 | 8.84 |
| SFM | 59.45 | 56.98 | 56.90 | 9.12 | 57.53 | 54.93 | 56.38 | 9.88 | 56.51 | 53.32 | 55.69 | 6.05 |
| TPA-LSTM | 63.63 | 61.23 | 58.49 | 10.64 | 59.77 | 57.08 | 55.41 | 8.97 | 59.71 | 56.11 | 57.23 | 10.08 |
| InceptionTime | 58.46 | 56.17 | 57.16 | 7.82 | 56.46 | 54.44 | 56.12 | 7.07 | 56.28 | 54.04 | 58.71 | 7.21 |
| HMG-TF | 65.13 | 59.87 | 59.03 | 13.27 | 59.06 | 56.81 | 57.04 | 11.50 | 61.55 | 56.23 | 57.57 | 9.66 |
| GCN† | 61.28 | 59.01 | 57.37 | 10.89 | 56.78 | 54.28 | 53.97 | 6.22 | 57.54 | 53.78 | 57.24 | 7.03 |
| TGC† | 64.56 | 61.26 | 59.07 | 12.11 | 59.21 | 56.20 | 56.26 | 10.03 | 61.67 | 57.83 | 58.21 | 10.17 |
| HATR-MT | 65.22 | 62.06 | 59.60 | 12.21 | 59.84 | 56.97 | 56.59 | 11.81 | 63.86 | 56.87 | 59.08 | 9.56 |
| HATR-MR | 65.97 | 62.28 | 60.15 | 14.33 | 61.10 | 57.28 | 57.16 | 12.77 | 62.05 | 55.69 | 58.11 | 9.95 |
| HATR | 67.70∗ | 63.64∗ | 62.59∗ | 15.19∗ | 61.47 | 57.78∗ | 57.80∗ | 13.03 | 65.78∗ | 57.77 | 62.06∗ | 10.86 |
- (a) Temporal module ablation
- (b) Relational module ablation
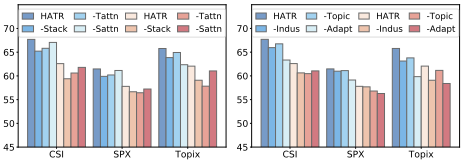
Figure 4: Component settings in temporal and relational modeling. Blue- and red-shade stand for results on ACC and F1 separately.
Effect of Temporal and Relational Components. We first compare ablation variants of the temporal module in HATR, including using LSTM network as the feature extractor (w/o stacked encoding layers), alternating max pooling operations for time-wise aggregation (w/o Hawkes Process), and preserving the output of the last representation layer as input for graph modeling (w/o scale-wise attention). From Figure 4a, the stacking hierarchy and the dual attention mechanism to focus on salient temporal points and scales jointly contribute to the performance. Besides, in our experiments the initial skip-connected self-attention layer in the temporal module realizes slight enhancements in generating more stable predictions. As convolutions are able to derive segment features by local interactions, the self-attention helps to encode global dependencies among distant time steps in the sequence.
We then investigate ablation effects on the relational module with different adjacency configurations. Figure 4b shows the results of discarding GI , GT and Gapt. We find that models fed with the adaptive-learned relationship achieve better performance, and the gain is even more significant than priorknowledge based graphs. It inspires us that data-driven graph modeling could introduce useful information of object hidden dependencies, especially when prior structure is unavailable or facing sophisticated scenarios like stock market.
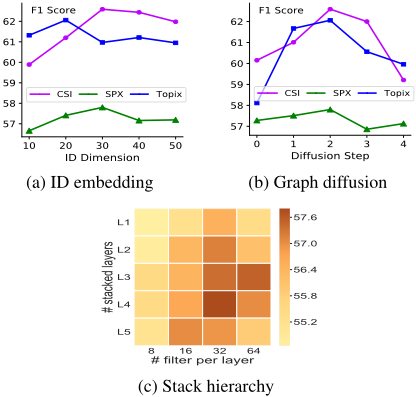
Parameter Analysis. We examine the dimension of ID embeddings used to distinguish different stocks for scale-wise temporal attention and the construction of adaptive adjacency matrix. From Figure 5a, the performance first increases with larger dimension since the traits of stock individuals can be encoded more sufficiently, then begins to decrease probably due to overfitting. Figure 5b exhibits the influence of applying varied numbers of graph layers. The results reveal that the optimal setting of diffusion steps on all datasets is 2. With the increment of interaction layers, a node could receive information from higher-order neighbors to enhance its representation. Nevertheless, the situation reverses with a continuous increment since every nodes in the graph may become oversmooth. Figure 5c shows the change of F1 score on SPX with respect to the dilated CNN hierarchy with different numbers of stacked layers and filters. Given filter channels per layer, the score improves significantly when the stacked depth is less than 4. A similar trend exists with increasing number of filters since more feature patterns may be captured, then the score declines due to possible overfitting of noise patterns.
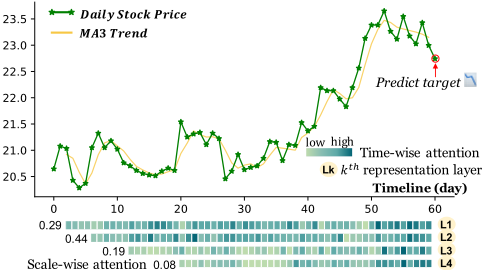
Case Study. To understand what is of importance that the dual attention mechanism learns for temporal representation, we further visualize the time- and scale-wise weight distribution in Figure 6. As shown, the highlighted historical patterns as well as latest time steps which exhibit conspicuous periodic regularities of stock price change received more attentions through the Hawkes process. Specifically, the lower embedding layers capture short-term dynamic patterns and higher layers work for detecting long-term trends (e.g., downtrend at the end of the timeline). Comparing the attentions payed to different feature scales, the 1st -3th layers were assigned higher weights, while the 4th layer investigating largespan temporal signals produced weaker impacts on characterizing the traits of target stock during the sample period.
5 Conclusion
In this paper, we propose a hierarchical adaptive temporalrelational network for stock trend prediction. For temporal view, multi-scale volatility patterns of stock evolution history are extracted by stacking gated convolution layers with different dilation rates. Important temporal points and scales are detected via dual attention mechanism conditioned on stock individual traits. For relational view, we build three types of graphs based on domain knowledge as well as data-driven adaptive learning to learn stock correlations. All components are jointly trained in an end-to-end way. Experiments on three real-world stock market datasets validate the effectiveness of our model. In future, we shall explore dynamic heterogeneous stock graphs fusing multi-source information like news events to learn time-evolving market dependencies.
Acknowledgements
This work was supported by Research Funds for NSD Construction, University of International Relations.
@inproceedings{ijcai2021p508,
  title     = {Hierarchical Adaptive Temporal-Relational Modeling for Stock Trend Prediction},
  author    = {Wang, Heyuan and Li, Shun and Wang, Tengjiao and Zheng, Jiayi},
  booktitle = {Proceedings of the Thirtieth International Joint Conference on
               Artificial Intelligence, {IJCAI-21}},
  publisher = {International Joint Conferences on Artificial Intelligence Organization},
  editor    = {Zhi-Hua Zhou},
  pages     = {3691--3698},
  year      = {2021},
  month     = {8},
  note      = {Main Track},
  doi       = {10.24963/ijcai.2021/508},
  url       = {https://doi.org/10.24963/ijcai.2021/508},
}
TY - CPAPER TI - Hierarchical Adaptive Temporal-Relational Modeling for Stock Trend Prediction AU - Wang, Heyuan AU - Li, Shun AU - Wang, Tengjiao AU - Zheng, Jiayi T2 - Proceedings of the Thirtieth International Joint Conference on Artificial Intelligence, IJCAI-21 PB - International Joint Conferences on Artificial Intelligence Organization PY - 2021 SP - 3691 EP - 3698 DO - 10.24963/ijcai.2021/508 UR - https://doi.org/10.24963/ijcai.2021/508 ER -Copied
Machine-readable versions of this paper, for tools and AI agents:





