
Dialogue Disentanglement in Software Engineering: How Far are We?
Proceedings of the Thirtieth International Joint Conference on Artificial Intelligence. Main Track. Pages 3822-3828.
https://doi.org/10.24963/ijcai.2021/526
Keywords
- Natural Language Processing: NLP Applications and Tools
- Natural Language Processing: Dialogue
- Natural Language Processing: Resources and Evaluation
Abstract
Despite the valuable information contained in software chat messages, disentangling them into distinct conversations is an essential prerequisite for any in-depth analyses that utilize this information. To provide a better understanding of the current state-of-the-art, we evaluate five popular dialog disentanglement approaches on software-related chat. We find that existing approaches do not perform well on disentangling software-related dialogs that discuss technical and complex topics. Further investigation on how well the existing disentanglement measures reflect human satisfaction shows that existing measures cannot correctly indicate human satisfaction on disentanglement results. Therefore, in this paper, we introduce and evaluate a novel measure, named DLD. Using results of human satisfaction, we further summarize four most frequently appeared bad disentanglement cases on software-related chat to insight future improvements. These cases include (i) Ignoring Interaction Patterns, (ii) Ignoring Contextual Information, (iii) Mixing up Topics, and (iv) Ignoring User Relationships. We believe that our findings provide valuable insights on the effectiveness of existing dialog disentanglement approaches and these findings would promote a better application of dialog disentanglement in software engineering.
- [Beyer et al., 2020] Stefanie Beyer, Christian Macho, Mas- similiano Di Penta, and Martin Pinzger. What Kind of Questions Do Developers Ask on Stack Overflow? A Comparison of Automated Approaches to Classify Posts into Question Categories. Empirical Software Engineer- ing, 25(3):2258-2301, 2020.
- [Blei et al., 2003] David M. Blei, Andrew Y. Ng, and Michael I. Jordan. Latent Dirichlet Allocation. J. Mach. Learn. Res., page 993-1022, March 2003.
- [Botchkarev, 2019] Alexei Botchkarev. A New Typology Design of Performance Metrics to Measure Errors in Ma- chine Learning Regression Algorithms. Interdisciplinary Journal of Information, Knowledge, and Management, 14:045-076, 2019.
- [Christen, 2006] Peter Christen. A Comparison of Personal Name Matching: Techniques and Practical Issues. In ICDMW'06, pages 290-294. IEEE, 2006.
- [Cohen, 1960] Jacob Cohen. A coefficient of agreement for nominal scales. Educational and Psychological Measure- ment, 20(1):37-46, 1960.
- [Crestani and Lalmas, 2000] Fabio Crestani and Mounia Lalmas. Logic and Uncertainty in Information Retrieval. In ESSIR'00, page 179-206. Springer-Verlag, 2000.
- [Devlin et al., 2019] Jacob Devlin, Ming-Wei Chang, Ken- ton Lee, and Kristina Toutanova. BERT: Pre-training of Deep Bidirectional Transformers for Language Under- standing. In NAACL'19, pages 4171-4186. Association for Computational Linguistics, June 2019.
- [Di et al., 2020] Jiasheng Di, Xiao Wei, and Zhenyu Zhang. How to Interact and Change? Abstractive Dialogue Sum- marization with Dialogue Act Weight and Topic Change Info. In Knowledge Science, Engineering and Manage- ment, pages 238-249, 2020.
- [Elsner and Charniak, 2008] Micha Elsner and Eugene Charniak. You Talking to Me? A Corpus and Algorithm for Conversation Disentanglement. In Proceedings of ACL-08: HLT, pages 834-842, Columbus, Ohio, June 2008. Association for Computational Linguistics.
- [Elsner and Charniak, 2010] Micha Elsner and Eugene Charniak. Disentangling Chat. Comput. Linguist., 36(3):389-409, September 2010.
- [Hartson and Pyla, 2019] Rex Hartson and Pardha Pyla. Em- pirical UX Evaluation: Data Collection Methods and Techniques. In The UX Book (Second Edition), pages 505 -543.
- Morgan Kaufmann, 2019.
- [Jiang et al., 2018] Jyun-Yu Jiang, Francine Chen, Yan-Ying Chen, and Wei Wang. Learning to Disentangle Interleaved Conversational Threads with a Siamese Hierarchical Net- work and Similarity Ranking. In NAACL'18, pages 1812- 1822, June 2018.
- [Kummerfeld et al., 2019] Jonathan K. Kummerfeld, Sai R. Gouravajhala, Joseph Peper, Vignesh Athreya, Chulaka Gunasekara, Jatin Ganhotra, Siva Sankalp Patel, Lazaros Polymenakos, and Walter S. Lasecki. A Large-Scale Cor- pus for Conversation Disentanglement. In ACL'19, pages 3846-3856, July 2019.
- [Li et al., 2020] Tianda Li, Jia-Chen Gu, Xiaodan Zhu, Quan Liu, Zhen-Hua Ling, Zhiming Su, and Si Wei. DialBERT: A Hierarchical Pre-Trained Model for Conversation Dis- entanglement. arXiv preprint arXiv:2004.03760, 2020.
- [Liu et al., 2020] Hui Liu, Zhan Shi, Jia-Chen Gu, Quan Liu, Si Wei, and Xiaodan Zhu. End-to-End Transition-Based Online Dialogue Disentanglement. In IJCAI '20, pages 3868-3874, 7 2020. Main track. IJCAI
- [Lowe et al., 2015] Ryan Lowe, Nissan Pow, Iulian Serban, and Joelle Pineau. The Ubuntu Dialogue Corpus: A Large Dataset for Research in Unstructured Multi-Turn Dialogue Systems. In SIGDIAL'15, pages 285-294. Association for Computational Linguistics, September 2015.
- [Mehri and Carenini, 2017] Shikib Mehri and Giuseppe Carenini. Chat Disentanglement: Identifying Semantic Reply Relationships with Random Forests and Recurrent Neural Networks. In IJCNLP'17, pages 615-623, 2017.
- [Pennington et al., 2014] Jeffrey Pennington, Richard Socher, and Christopher Manning. GloVe: Global Vectors for Word Representation. In EMNLP'14, pages 1532-1543, 2014.
- [Qu et al., 2019] Chen Qu, Liu Yang, W. Bruce Croft, Yongfeng Zhang, Johanne R. Trippas, and Minghui Qiu. User Intent Prediction in Information-Seeking Conversa- tions. In CHIIR '19, page 25-33. Association for Comput- ing Machinery, 2019.
- [Rani and Singh, 2018] Shama Rani and Jaiteg Singh. En- hancing Levenshtein's Edit Distance Algorithm for Evalu- ating Document Similarity. In Computing, Analytics and Networks, pages 72-80. Springer Singapore, 2018.
- [Rugg and McGeorge, 1997] Gordon Rugg and Peter Mc- George. The Sorting Techniques: a Tutorial Paper on Card Sorts, Picture Sorts and Item Sorts. Expert Systems, 14(2):80-93, 1997.
- [Santos and Embrechts, 2009] Jorge M. Santos and Mark J. Embrechts. On the Use of the Adjusted Rand Index as a Metric for Evaluating Supervised Classification. In ICANN '09, pages 175-184. Springer, 2009.
- [Shen et al., 2006] Dou Shen, Qiang Yang, Jian-Tao Sun, and Zheng Chen. Thread Detection in Dynamic Text Mes- sage Streams. In SIGIR '06, page 35-42. Association for Computing Machinery, 2006.
- [Strehl and Ghosh, 2002] Alexander Strehl and Joydeep Ghosh. Cluster Ensembles -A Knowledge Reuse Frame- work for Combining Multiple Partitions. J. Mach. Learn. Res., 3:583-617, 2002.
- [Yu and Joty, 2020] Tao Yu and Shafiq Joty. Online Con- versation Disentanglement with Pointer Networks. In EMNLP'20, pages 6321-6330. Association for Computa- tional Linguistics, November 2020.
References were extracted automatically from the PDF and may contain errors.
Full text extracted automatically from the PDF; figures, tables and equations may differ. The PDF is the version of record.
1 Introduction
Online communication platforms such as Gitter 1 have been heavily used by software organizations as collaborative team communication tools for their software development teams. Conversations on these platforms often contain a large amount of valuable information that may be used, for example, to improve development practice, to observe software development process, and to enhance software maintenance. However, these conversations oftentimes appear to be entangled. While some developers may participate in active discussions on one topic, others could address previous conversations on different topics in the same place. Without any indications of separate conversations, it is difficult to extract useful information when all messages appear together.
∗Corresponding Author
A number of approaches has been proposed to address such issue of dialog entanglement. Early work uses simple classifiers with handcrafted features to analyze the coherence of message-pairs [Elsner and Charniak, 2010]. In addition, neural network is used to obtain the relationships with the development of deep learning, such as FeedForward (FF) [Kummerfeld et al., 2019], CNN [Jiang et al., 2018] and BiLSTM [Mehri and Carenini, 2017] etc.. Meanwhile, sequential encoder/decoder based models are recently introduced with pre-trained BERT [Li et al., 2020], session-state dialog encoders [Liu et al., 2020], and pointer networks [Yu and Joty, 2020]. To evaluate their approaches, most of these studies use conversations mined from social platforms, such as Reddit and Twitter. The content of these conversations usually focuses on general topics, such as movies and news.
Unlike general conversations, software engineering (SE) dialogs have different and distinct characteristics: (1) SE dialogs heavily focus on resolving issues, thus they are mostly in the form of question and answer. In our observation, nearly 90% of the SE dialogs are in this Q&A style. However, in the general dialogs (i.e. the news or movie dialogs), the proportion of such Q&A dialogs is much less. Existing approaches that do not consider this Q&A aspect may result in disentanglement errors (elaborated in Section 5). (2) SE dialogs are domain-specific and each domain has its own technical terms and concepts. Existing approaches that leverage general dialogs without incorporating any domain-specific terminology cannot understand jargon accurately. (3) SE dialogs usually involve more complex problems, which require developers to discuss various topics within one dialog. Thus, SE dialogs are more likely to show a higher degree of entanglement.
However, the disentanglement performance on softwarerelated chat has rarely been evaluated. [Kummerfeld et al., 2019] and [Yu and Joty, 2020] evaluate their models on a set of Ubuntu IRC dataset but the generalizability of the results is limited due to the small sample size. Moreover, although the goal of dialog disentanglement is to provide users with the ease of finding valuable information from entangled messages, none of the previous studies investigate how well existing disentanglement measures reflect human satisfaction. Thus, it remains unclear how far we are from effective dialog disentanglement towards software-related chat that contains the majority of technical and professional conversations.
In this paper, we conduct an exploratory study on 7,226 real-world developers' dialogs mined from eight popular open-source projects hosted on Gitter. First, we compare five state-of-the-art dialog disentanglement approaches based on two strategies: transferring the original models across domains and retraining the models on software-related dialogs. Second, we further investigate how well the existing disentanglement measures reflect human satisfaction. The results show that the existing measures are unable to accurately indicate human satisfaction on the disentanglement results. Therefore, we propose and evaluate a novel measure that measures human satisfaction on disentanglement results by incorporating Levenshtein distance, named DLD, to complement the existing literature. To further understand why existing approaches fail to disentangle software-related chat, we summarize four bad cases of incorrect disentanglement. We believe that the findings we have uncovered will promote a better application of dialog disentanglement in the software engineering domain. The major contributions of this paper are summarized as follows:
- We conduct a comparative empirical study on evaluating the state-of-the-art disentanglement approaches on software-related chat;
- We propose a novel measure, DLD, for quantitatively measuring human satisfaction on disentangled results;
- We release a dataset 2 of disentangled software-related dialogs to facilitate the replication of our study and future improvements of disentanglement models.
2 Dataset Preparation
Project Studying. We select Gitter due to its high popularity and openly accessible. A sample dataset is constructed from the most participated projects found in eight popular domains, which include "Frontend", "Mobile", "Data Science", "DevOps", "Blockchain", "Collaboration", "Language", and "Web App". The total number of participants across these eight projects is 95,416, which accounts for 13% of the entire Gitter's participant population.
Data Preprocessing. We collect all the 1,402,894 utterances recorded before "2020-11-20" in each project. Data is then preprocessed by the following steps: 1) Formatting. To preprocess the textual utterances, we first normalize the non-ASCII characters (i.e., emojis) to standard ASCII strings. Since low-frequency tokens such as URL, email address, code, HTML tags, and version numbers do not contribute to the classification results in chat utterances, we replace themwith specific tokens "[URL]", "[EMAIL]", "[HTML]", "[CODE]" and "[ID]" respectively. We also utilize Spacy to tokenize sentences into terms, and perform lemmatization and lowercasing on terms. 2) Experiment Dataset Creation. We employ a 3-step manual process to generate the dialog dataset for our experiments. First, we randomly sample 100 utterances from each community's live chat log, intending to trace corresponding dialogs associated with each utterance.
2 https://github.com/disensoftware/disentanglement-for-software
| Id | Project | Domain | Entire Population | Sample Population | |||
|---|---|---|---|---|---|---|---|
| PA | UT | PA | DL | UT | |||
| P1 | Angular | Frontend | 22,467 | 695,183 | 125 | 97 | 778 |
| P2 | Appium | Mobile | 3,979 | 29,039 | 73 | 87 | 724 |
| P3 | Dl4j | Data Science | 8,310 | 252,846 | 93 | 100 | 1,130 |
| P4 | Docker | DevOps | 8,810 | 22,367 | 74 | 90 | 1,126 |
| P5 | Ethereum | Blockchain | 16,154 | 91,028 | 116 | 96 | 516 |
| P6 | Gitter | Collaboration | 9,260 | 34,147 | 87 | 86 | 515 |
| P7 | Typescript | Language | 8,318 | 196,513 | 110 | 95 | 1,700 |
| P8 | Nodejs | Web App | 18,118 | 81,771 | 144 | 98 | 737 |
| Total | 95,416 | 1,402,894 | 822 | 749 | 7,226 | ||
This step leads to a total of 800 utterances sampled from eight projects. Next, using each utterance as a seed, we identify its preceding and succeeding utterances iteratively and grouped the related utterances into the same dialog. We use these manually disentangled dialogs as the Ground-Truth Data. Finally, we add the intervened utterances that are posted among those labeled dialogs back into the dataset. 3) Exclusion. We exclude unreadable dialogs: a) dialogs that are written in nonEnglish languages; b) dialogs that contain too many specific tokens; and c) dialogs with typos and grammatical errors.
The final dataset contains 749 disentangled dialogs consisting of 7,226 utterances, contributed by 822 participants. Table 1 shows the detailed statistics.
3 Model Comparison
In this section, we conduct an in-depth empirical study to evaluate the state-of-the-art dialog disentanglement models towards software-related chat.
3.1 Model Selection
By searching through the literature published in the representative venues (Computational Linguistics, NAACL, ACL, IJCAI, EMNLP, and SIGIR) for the last 15 years, we choose eight approaches as the candidate models for our study. Their code accessibility, dataset accessibility, and learning technologies are summarized in Table 2. From the table, we can observe that five out of the eight models provide public assess to their source code and dataset. Moreover, these five models also utilize more advanced technologies such as deep neural networks. Thus, we select FF, BiLSTM, BERT, E2E and PtrNet as the state-of-the-art (SOTA) models to be compared in our study. Each model is described in detail as follows.
Given a graph of utterances G{V, E}, the goal of FF model and BiLSTM model is to predict whether there is an edge E between the utterance uj and uk, where utterances are nodes and edges indicate that one utterance is a response to another. Each connected component is a conversation.
FF. FF model is a feedforward neural network with two layers, 256-dimensional hidden vectors, and softsign nonlinearities. The input is a 77-dimensional numerical feature extracted from the utterance texts, which includes TF-IDF, user name, time interval, whether two utterances contain the same words, and etc.. FF model is trained from 77,563 manually annotated utterances.
| Model | Code | Dataset | Technology |
|---|---|---|---|
| Weighted-SP [Shen et al., 2006] | No | No (Linux) | Weight Calculation |
| ME Classifier [Elsner and Charniak, 2010] | No | No (Ubuntu) | Traditional Classifier |
| BiLSTM [Mehri and Carenini, 2017] | Yes | Yes (Movie) | Recurrent NN |
| CISIR [Jiang et al., 2018] | No | Yes (News) | Convolutional NN |
| FF [Kummerfeld et al., 2019] | Yes | Yes (Ubuntu) | FeedForward NN |
| BERT [Li et al., 2020] | Yes | Yes (Movie) | Encoder/Decoder NN |
| E2E [Liu et al., 2020] | Yes | Yes (Movie) | Encoder/Decoder NN |
| PtrNet [Yu and Joty, 2020] | Yes | Yes (Ubuntu) | Encoder/Decoder NN |
BiLSTM. BiLSTMmodel is a bidirectional recurrent neural network with 160 context maximum size, 200 neurons with one hidden layer. The input is a sequence of 512-dimensional word vectors. BiLSTM model is trained from 7.1 million utterances and 930K dialogs.
Unlike FF and BiLSTM, given a sequence of utterances [u1, u2, ..., un], the goal of BERT, E2E and PtrNet is to learn the following probability distribution, where yi is the action decision for the utterance ui.
BERT. BERT model uses theMasked LanguageModel and Next Sentence Prediction [Devlin et al., 2019] to encode the input utterances, with 512 embedding size and 256 hidden units. BERT model is trained from 74,963 manually annotated utterances.
E2E. E2Emodel performs the dialog Session-State encoder to predict dialog clusters, with 512 embedding size, 256 hidden neurons and 0.05 noise ratio. E2E model is trained from 56,562 manually annotated utterances.
PtrNet. PtrNet model utilizes the pointer network to predict links within utterances, with 512 embedding size and 256 hidden units. PtrNet model is trained from 52,641 manually annotated utterances.
3.2 EvaluationMeasures
We investigate the evaluation measures that are adopted by existing literature, as shown in Table 3. There are four evaluation measures that are frequently used: ARI [Santos and Embrechts, 2009], NMI [Strehl and Ghosh, 2002], Shen-F [Shen et al., 2006], F1 [Crestani and Lalmas, 2000].
Adjusted Rand Index (ARI) is commonly used in cluster analysis to measure the degree of agreement between two data clusters. An index value that is closer to 0 represents random labeling, where the value of 1 indicates that the data clusters are identical. Normalized Mutual information (NMI) is a normalization of the Mutual Information (MI) score to scale the results between 0 (no mutual information) and 1 (perfect correlation). NMI evaluates the distribution consistency of predicted and true clustering, regardless of the sorting of the clustering. F1 calculates the number of perfectly matched dialogs, which is considered as the most strict measure. Shen-F defines a weighted sum of F1 scores overall dialogs. The F1 weights are all calculated based on the number of utterances in our dialogs.
| P | R | F1 | loc3 | MAP | MRR | NMI | ARI | Shen-F | |
|---|---|---|---|---|---|---|---|---|---|
| Weighted-SP | ! | ! | |||||||
| ME Classifier | ! | ! | |||||||
| BiLSTM | ! | ! | ! | ! | ! | ||||
| CISIR | ! | ! | |||||||
| FF | ! | ! | ! | ! | ! | ! | |||
| BERT | ! | ! | ! | ! | |||||
| E2E | ! | ! | ! | ! | |||||
| PtrNet | ! | ! | ! | ! | ! |
3.3 Experiments
We conduct two experiments to evaluate how effective SOTA models are at disentangling software-related chat.
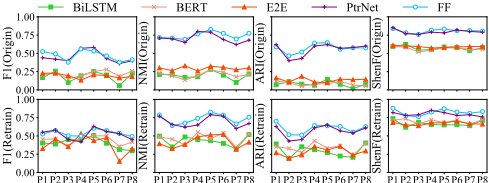
Experiment 1: Original. We use the five original SOTA models as described and trained in the existing literature to disentangle software-related chat. As shown in Figure 1, BiLSTM, Bert, and E2E models can only achieve mediumlevel scores on Shen-F, with low performances on F1, NMI and ARI. FF and PtrNet models significantly outperform the other three models. However, further analysis shows no significant 3 difference (p = 0.56) between FF and PtrNet models. Since FF model achieves slightly higher performances than PtrNet model on average, we consider FF model performs the best at disentangling software-related dialogs in this experiment. Specifically, FF model can achieve high scores on clustering measures (avg(NMI)=0.74 and avg(Shen-F)=0.81), medium-level scores on perfectly matching (avg(F1)=0.47), and pairwise clustering similarity (avg(ARI)= 0.57).
Experiment 2: Retraining. We then retrain the five SOTA models on software-related chat. We use "retrain" to refer to the fine-tuning as well as the training on the new data. Specifically, the original Bert, E2E, PtrNet, and BiLSTM utilize pretraining for contextual embedding, so we fine-tune the four SOTA models on the new data. Since FF is a feedforward network, we train it on the new data directly. For each SOTA model, we retrain with seven projects and evaluate with the eighth project. In order to study the significance of the performance improvement contributed by retraining, we conduct five paired T-tests between each original model and its retrained model. The p values indicate that the retrained FF and PtrNet do not have significant improvement (p1 = 0.43, p2 = 0.62) to the original model. More specifically, the retraining strategy does not guarantee performance improvement from their original models. As shown in Figure 1, while the retrained FF model increases its F1, ARI, and Shen-F by 0.03, 0.03, and 0.01 on average respectively, the average NMI score decreases by 0.01. The retrained PtrNet model displays a similar trend. The F1 and ARI increase by 0.07 and 0.01 respectively on average, while the average Shen-F shows no change and the average NMI score decreases by 0.02. On the contrary, the retrained BiLSTM, BERT and E2E models significantly (p3 = 10-5 , p4 = 10-6 , p5 = 10-3 ) outperform the original ones. As shown in Figure 1, the retrained BERT model obtains the largest performance improvement among P1 P2 P3 P4 P5 P6 P7 P8
3 Significance T-test follows p < 0.05.
P1 P2 P3 P4 P5 P6 P7 P8
P1 P2 P3 P4 P5 P6 P7 P8
P1 P2 P3 P4 P5 P6 P7 P8
Figure 1: Performance comparison of five SOTA models.
the three models: the average F1, NMI, ARI, and Shen-F increases by 0.22, 0.25, 0.26, and 0.13 respectively. However, the retrained FF and PtrNet models still significantly outperform the other three retrained models.
Finding. Both FF and PtrNet models outperform the rest in both experiments. However, we observe that the retraining strategy is unable to contribute significantly to the original models in terms of performance improvement. Since SOTA models are built with general dialogs, retraining still cannot effectively address the challenges that SOTA models face in disentangling SE dialogs, such as the lack of understanding of domain-specific terminology and the inefficiency in disentangling complex dialogs with mixing up topics. Moreover, after combining dropout with early stopping to avoid risks of overfitting, we observe that convergences are already achieved at epoch 10-15, thus we believe that the retraining performance could not be better even given more data.
In this study, we recommend adopting the original FF model as the best model to disentangle software-related dialogs, as the original FF model can achieve slightly higher performances on average than the original PtrNet model. Despite the original FF model being the best, the average F1 score is only 0.47, which indicates a relatively low perfectly matching score.
4 Human SatisfactionMeasures
Since the goal of dialog disentanglement is to make it easy for users to find information from entangling dialogs, it is essential to evaluate the quality of the disentangled results against human satisfaction. Various measures (see Section 3.2) have been proposed to calculate how close the disentangled results are from the ground-truth data. To understand how well these measures reflect human satisfaction, we conduct an experiment to compare these existing measures with manually scored human satisfaction.
4.1 Measures Analysis
Manually Scoring Human Satisfaction
We build two teams to manually score human satisfaction of the disentangled dialogs produced by the original FF model. Each team consists of one Ph.D. candidate and one developer. All of them are fluent English speakers and have done either intensive research work with software development or have been actively contributing to open-source projects. We leverage a five-point Likert scale [Hartson and Pyla, 2019] to score human satisfaction. The rating scale varies from "strongly unsatisfied" to "strongly satisfied", with the values of 1 to 5 respectively. Each disentangled dialog receives two scores from two team members, and we host discussions for dialogs with inconsistent ratings. The average Cohen's Kappa score [Cohen, 1960] of our study is 0.82, indicating that the participants highly agree with each other.
| Category | Error | Correlation | Hypothesis | |||
|---|---|---|---|---|---|---|
| Analysis | RMSE | MAE | PEA | IST | PST | ANOVA |
| NMI | 0.38 | 0.34 | 0.08 | e-55 | e-46 | e-55 |
| ARI | 0.37 | 0.32 | 0.02 | e-19 | e-17 | e-19 |
| Shen-F | 0.41 | 0.36 | 0.17 | e-69 | e-59 | e-69 |
| F1 | 0.19 | 0.14 | 0.85 | e-4 | e-14 | e-4 |
| DLD | 0.08 | 0.07 | 0.92 | 0.51 | 0.31 | 0.51 |
Deviation Analysis
We then conduct a quantitative analysis to compare the differences between the existing measures and the manually-scored human satisfaction. Since F1, ARI, NMI, and Shen-F all range from 0 to 1, while manually-scored human satisfaction scales from 1 to 5, to compare the differences, we normalize human satisfaction into score ∈ [0, 1] with a linear function: score = 0.25 × (score - 1). We then analyze the deviation between existing measures and manually-scored human satisfaction in the following aspects:
Error Analysis. We calculate Root-Mean-Square Error (RMSE) and Mean Absolute Error (MAE) [Botchkarev, 2019] as the error deviation between two samples.
Correlation Analysis. We calculate Pearson (PEA) correlation coefficient between two samples.
Hypothesis Testing. We perform Independent Sample TTest (IST), Paired Sample T-Test (PST), and Analysis of Variance (ANOVA) to measure and validate the deviation between two samples:
- IST: H0 : µ1 = µ2,H1 : µ1 ̸= µ2.
- PST: H0 : µZ = 0,H1 : µZ ̸= 0, where Z = X1 -X2.
- ANOVA: H0 : σ2 1 = σ2 2 ,H1 : σ1 ̸= σ2
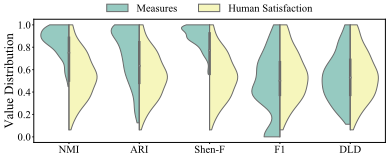
Table 4 shows the deviation analysis results. By comparing the error and correlation results of NMI, ARI, Shen-F, and F1, we find that F1 is the most similar to human satisfaction scores, with the lowest Error (RMSE = 0.19, MAE = 0.14) and the highest correlation (PEA = 0.85). However, F1 is not statistically acceptable since the hypothesis testing shows a significant difference with human satisfaction (p < 0.05, reject). Figure 2 visualizes the value distribution of measures and human satisfaction. We can see that NMI, ARI, and Shen-F are likely to overrate the disentanglement results, while F1 slightly underrates them.
Finding. Existingmeasures are unable to reflect human satisfaction accurately, thus a new measure is needed.
4.2 ANovel Measure: DLD
We leverage Levenshtein Distance [Christen, 2006] and Levenshtein Ratio [Rani and Singh, 2018] to estimate the editing effort of dialog-to-dialog transition (i.e.: Delete, Insert and Update). Given the ground-truth disentanglement dialogs DT and the predicted disentanglement dialogs DP , we first calculate the differences between DP and DT :
where |Di -Dj| denotes the number of utterances in Di that are not included in Dj . We then perform the Sigmod function σ to normalize the absolute value into (0, 1):
where η is the threshold number of utterances that indicates good disentanglement or not. We define Dialog Levenshtein Revision as follows:
where E denotes the expectation of a collection of dialog pairs < DP , DT >. Since DLRv measures the size of absolute revisions, we further define Dialog Levenshtein Ratio to measure the proportion of revisions in one dialog:
By taking both DLRv and DLRt into consideration, we define Dialog Levenshtein Distance as a novel measure for human satisfaction:
Effectiveness of DLD
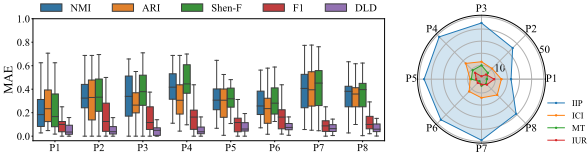
By tuning the values of η and λ, we observe that DLD can achieve the smallest deviation when η = 5 and λ = 0.8. The last row of Table 4 shows the error, correlation, and hypothesis testing analysis results between DLD and manually-scored human satisfaction. Compared with other measures, DLD achieves the lowest error (RMSE = 0.08, MAE = 0.07) and highest correlation (PEA = 0.92). Moreover, figure 3 illustrates that DLD can achieve the lowest error across all projects. The p values of the three hypothesis tests are all over 0.05, which indicates that DLD shows no significant differences when compared to manually-scored human satisfaction. Figure 2 visualizes such value distribution. The DLD shows the most symmetric shape, which indicates that our measure is the most accurate in matching the manuallyscored human satisfaction.
Finding. While the existing measures evaluate the similarity between the predicted and true disentanglement results based on perfectly matching or clustering distribution, DLD
Figure 4: Distributions of bad cases in projects.
incorporates the Levenshtein distance to quantitatively measures such similarity. When compared to the existing measures, DLD can more accurately measure human satisfaction. We consider the reason is that edit distance could reflect the completeness of information in relation to the dialog structure whereas the existing measures do not. Moreover, the DLD can also be extensively used for general dialog disentanglement since it does not involve any SE-specific knowledge.
5 Bad Cases Analysis
We perform an in-depth analysis on the "bad case" disentangled dialogs that received human satisfaction score ≤ 3 to further investigate why the disentangled dialogs are unsatisfying. We classify these disentangled dialogs by using open card sorting [Rugg and McGeorge, 1997]. Similar to the process of scoring human satisfaction, we group participants into two teams to cross-inspect the classifications of bad cases. Discussions are hosted for inconsistent classifications.
As the result, we identify four categories: Ignoring Interaction Patterns, Ignoring Contextual Information, Mixing up Topics, and Ignoring User Relationships. As shown in Figure 4, all four bad cases occur in every sampled project. The most commonly occurred bad case (64%) is Ignoring Interaction Patterns. These bad cases might also occur in general dialogs with different distributions. To better understand each bad case, we further elaborate definitions with examples.
5.1 Ignoring Interaction Patterns (IIP: 64%)
Definition. Utterances in the disentangled dialog are incorrect due to missing the utterances that comply with the interaction patterns. For example:
| Interaction Pattern | ||
|---|---|---|
| 𝑅1: Does this approach make any sense? | <OQ, | 𝑅𝑖> |
| 𝑅2: If you want to leverage caching of build tasks, yes. | <PA, | 𝑅𝑠> |
| 𝑅1: Copy what I need into a docker image? Miss | <FQ, | 𝑅𝑖> |
| 𝑅2: You get my point! | <FD, | 𝑅𝑠> |
Three interaction patterns have been observed when analyzing the content of these unsatisfying disentangled dialogs. We leverage the user intents proposed by Bayer et al. [2020] and Qu et al. [2019]. These user intents represent the utterance intention, which indicates what the participants want to convey when posting messages. Each pattern is a sequence of <Intent, Role>, where Intent={OQ (Origin Question), PA (Potential Answer), FQ (Follow-up Question), FD (Further Detail), CQ (Clarify Question)}, and Role={Ri(Dialog Initiator), Rs (Respondent)}. The interaction patterns can be described as follows:
- Direct Answer (<OQ, Ri >, <PA, Rs >): Ri initiates the dialog with OQ, Rs then directly answers with PA.
- Clarifying Answer (<OQ, Ri >, <PA, Rs >, <FQ, Ri >, <FD, Rs >): Ri initiates the dialog with OQ, a potential answer PA is posted by Rs. Then follow-up questions are posted by dialog initiator Ri to clarify until the answer is fully understood and accepted by Ri.
- Clarifying Question (<OQ, Ri >, <CQ, Rs >, <FD, Ri >, <PA, Rs >): Ri initiates the dialog with OQ, CQ are posted by Rs to clarify the original question until the original question is fully understood by Rs. Then a potential answer PA is posted by Rs.
The dialog in Example 1 illustrates the Clarifying Answer pattern. After R2 provides a potential answer, R1 asks a follow-up question to clarify the answer. Then R2 answers the follow-up question. In this case, the existing disentanglement models fail to predict that the four utterances should be in the same dialog. Instead, only the first two utterances are considered as one dialog. Thus, we recommend that disentanglement models can be optimized by identifying utterances that display the above interaction patterns.
5.2 Ignoring Contextual Information (ICI: 21%)
Definition. Utterances in the disentangled dialog are incomplete due to the missing of domain-specific contextualrelated utterances. For example:

The example shows an incorrect disentanglement that misses respondent utterance. R1 asks about the usage of data models and R2 replies with MongoDB with no further clarifications. Although we know that MongoDB is a data model and these two utterances are highly related, since the existing disentanglement models often use textual similarity, these two utterances appear to be as less related. Thus, lacking such contextual information will often lead to incorrect disentanglement. Therefore, we recommend disentanglement models to incorporate contextual similarity, such as pre-trained word vectors GloVe [Pennington et al., 2014; Lowe et al., 2015; Elsner and Charniak, 2008].
5.3 Mixing up Topics (MT: 9%)
Definition. The dialog contains multiple topics that are discussed by the same group of participants. For example:
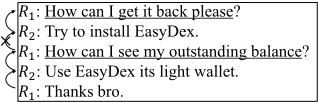
The example shows an incorrect disentangled dialog with mixed-up topics in one conversation. R1 asks two questions that belong to different topics while R2 provides separate answers to each question. The first two utterances talk about the installation of EasyDex, while the following two utterances talk about the usage of EasyDex. Such disentangled dialog violates the single-topic principle of dialog disentanglement [Di et al., 2020]. Therefore, we recommend integrating topic extraction algorithms, such as LDA [Blei et al., 2003] into disentanglement models to separate topics.
5.4 Ignoring User Relationships (IUR: 6%)
Definition. Utterances in the disentangled dialog are incorrect due to the lack of understanding of the relationships among the participants. For example:

The example shows an incorrect disentanglement when the relationship between participants is ignored. There are three utterances in this dialog: R1 posts a question, R2 and R3 reply with two distinct answers. The existing disentanglement models only predict R1 and R2 as one dialog, while excluding R3. Without understanding the relationship between R1 and R3, the answer posted by R3 seems to be irrelevant. However, by analyzing their post histories, we find that 76% of the utterances posted by R1 are associated with the utterances posted R3. With such frequent interaction, we consider that R1 and R3 have a close relationship. Thus, R3 is very likely to be in the same dialog as R1 and R2. We recommend that disentanglement models can use the participants' relationship and collaboration history to improve performance.
6 Conclusion
In this paper, we evaluate five SOTA dialog disentanglement models on SE dialogs to investigate how these models can be used in the context of SE. To acquire the best performing model, we conduct two experiments with the original and the retrained models respectively. Considering the trade-offs between training effort and performances, the results show that the original FF model is the best one for disentangling SE dialogs. Although the original FF model has the best performance, the evaluation measures do not accurately reflect human satisfaction. Thus, we introduce a novel measure DLD. Compared to other measures, DLD can more accurately measure human satisfaction. Finally, we investigate the reasons why some disentangled dialogs are unsatisfying. By classifying these disentangled dialogs, we identify four common bad cases. We believe that our study can provide clear directions on how to optimize existing disentanglement models.
Acknowledgments
This work is supported by the National Key R&D Program of China under Grant No. 2018YFB1403400, the National Science Foundation of China under Grant No. 61802374, 62002348, and 62072442, and Youth Innovation Promotion Association CAS.
@inproceedings{ijcai2021p526,
  title     = {Dialogue Disentanglement in Software Engineering: How Far are We?},
  author    = {Jiang, Ziyou and Shi, Lin and Chen, Celia and Hu, Jun and Wang, Qing},
  booktitle = {Proceedings of the Thirtieth International Joint Conference on
               Artificial Intelligence, {IJCAI-21}},
  publisher = {International Joint Conferences on Artificial Intelligence Organization},
  editor    = {Zhi-Hua Zhou},
  pages     = {3822--3828},
  year      = {2021},
  month     = {8},
  note      = {Main Track},
  doi       = {10.24963/ijcai.2021/526},
  url       = {https://doi.org/10.24963/ijcai.2021/526},
}
TY - CPAPER TI - Dialogue Disentanglement in Software Engineering: How Far are We? AU - Jiang, Ziyou AU - Shi, Lin AU - Chen, Celia AU - Hu, Jun AU - Wang, Qing T2 - Proceedings of the Thirtieth International Joint Conference on Artificial Intelligence, IJCAI-21 PB - International Joint Conferences on Artificial Intelligence Organization PY - 2021 SP - 3822 EP - 3828 DO - 10.24963/ijcai.2021/526 UR - https://doi.org/10.24963/ijcai.2021/526 ER -Copied
Machine-readable versions of this paper, for tools and AI agents:





