
Predictive Analytics for COVID-19 Social Distancing
Proceedings of the Thirtieth International Joint Conference on Artificial Intelligence. Demo Track. Pages 5016-5019.
https://doi.org/10.24963/ijcai.2021/716
Keywords
- Computer Vision: General
- Machine Learning: General
- Human-Computer Interaction: General
Abstract
The COVID-19 pandemic has disrupted the lives of millions across the globe. In Singapore, promoting safe distancing by managing crowds in public areas have been the cornerstone of containing the community spread of the virus. One of the most important solutions to maintain social distancing is to monitor the crowdedness of indoor and outdoor points of interest. Using Nanyang Technological University (NTU) as a testbed, we develop and deploy a platform that provides live and predicted crowd counts for key locations on campus to help users plan their trips in an informed manner, so as to mitigate the risk of community transmission.
- [He et al., 2017] Kaiming He, Georgia Gkioxari, Piotr Dollár, and Ross Girshick. Mask R-CNN. In Proceed- ings of the 2017 IEEE Conference on Computer Vision and Pattern Recognition (CVPR'17), pages 2961-2969, 2017.
- [Jiang et al., 2021] Hongchao Jiang, Wei Yang Bryan Lim, Jer Shyuan Ng, Harold Ze Chie Teng, Han Yu, Zehui Xiong, Dusit Niyato, and Chunyan Miao. AI-Empowered Decision Support for COVID-19 Social Distancing. In Proceedings of the 35th AAAI Conference on Artificial In- telligence (AAAI-21), 2021.
- [Li et al., 2018] Yuhong Li, Xiaofan Zhang, and Deming Chen. Csrnet: Dilated convolutional neural networks for understanding the highly congested scenes. In Proceed- ings of the 2018 IEEE Conference on Computer Vision and Pattern Recognition (CVPR'18), pages 1091-1100, 2018.
- [Taylor and Letham, 2018] Sean J Taylor and Benjamin Letham. Forecasting at scale. The American Statistician, 72(1):37-45, 2018.
- [Xiao et al., 2013] Jiang Xiao, Kaishun Wu, Youwen Yi, Lu Wang, and Lionel M Ni. Pilot: Passive device-free indoor localization using channel state information. In Proceedings of the 33rd International Conference on Dis- tributed Computing Systems (ICDCS'13), pages 236-245, 2013.
References were extracted automatically from the PDF and may contain errors.
Full text extracted automatically from the PDF; figures, tables and equations may differ. The PDF is the version of record.
1 Introduction
The Centers for Disease Control and Prevention (CDC) has recommended that the best way to reduce the spread of COVID-19 is to limit social contact. With more countries easing restrictions on travel, the chances of interaction among large groups increase significantly especially at public venues such as bus stops and eateries. To mitigate the spread of the virus, it will be useful if the public is able to find out the crowding situation at various locations in advance.
Previous works attempt to tackle this problem through device-free or device-based approaches. Device-free approaches typically involve setting up certain infrastructure such as closed-circuit television (CCTV) or wireless sensors. For example, several studies have proposed crowd counting based on Channel State Information (CSI) measurements [Xiao et al., 2013]. However, such measures require specialized infrastructure, such as network interface controllers, to broadcast beacon messages and receivers to measure CSI values. CSI is highly sensitive to environment variation and this can lead to inaccurate counts due to signals experiencing greater variation of scattering, fading and multi-path effects. Most importantly, it is costly to have an extensive setup of CCTV or sensors established to cover a large area or for adhoc events. Device-based approaches require users to carry along devices such as Radio-frequency Identification (RFID) tags citexi2014electronic. For example, Google Maps rely on users' location beaconing information to estimate the crowdedness of an area. However, this approach does not capture users who do not carry these devices along with them, or users who disable the location function on their mobile devices.
Recently, [Jiang et al., 2021] proposed a crowdsourced image-based solution to obtain live information of the crowd situation at different locations. Users can upload images of different locations via an application-agnostic web platform, and view live crowd information provided by other users. Such an approach requires minimal infrastructure support and only requires a single participant to contribute an image for a location, in contrast to device-based approaches in which all participants are required to turn on location sharing functions. However, crowd-sensing the current crowdedness levels does not allow for planning in advance. Furthermore, relying on user submitted data can result in periods with no information when there is no user upload. In this paper, we improve on [Jiang et al., 2021] by introducing a predictive module which is able to provide forecasts based on historical data 1 . Using the Nanyang Technological University campus as a testbed, we develop and deploy the platform to allow users to access crowd conditions in the short term (i.e. using current crowd information) and long term (i.e. using predicted crowd conditions) to make more informed trip planning decisions.
2 SystemDesign
The platform is designed as a navigation map with circular markers demarcating locations of interest (Fig. 1a). The markers are color coded to provide a high level overview of the crowd situation in the vicinity, and further details can be obtained by clicking on the markers. Based on the availability of input data, we provide different crowd information:
- Live crowd counts based on user uploads: When a user uploads a picture of the crowd at a location, our AI engine processes the image and provides a count on the number of people in the picture. The data is shown as a live crowd count together with the uploaded image (automatically blurred for privacy reasons). The benefit of displaying the image is to mitigate misinformation as a result of erroneous uploads. Furthermore, if the picture uploaded does not reflect the true crowd situation, users are given the option of downvoting the image (Fig. 1b).
1 Demo video: https://youtu.be/5B4vPj9iomk
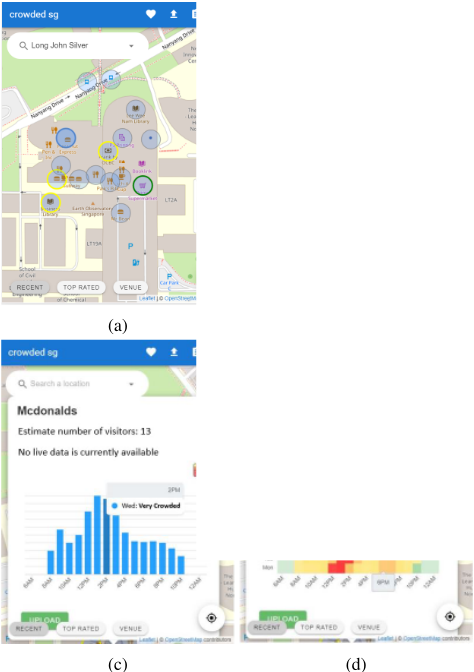
- Predicted crowd counts based on historical data: When there is no live data available, we provide an estimate of the number of visitors given based on historical crowd data. This is displayed to the user in the convenient form of a heat map for weekly trends (Fig. 1d) or bar graph for hourly trends (Fig. 1c) so as to provide better decision support on the opportune time to visit the given location. In cases where we do not have historical data especially at locations still in the early-stage deployment phase, we temporarily utilize external sources such as Google Maps historical visits data.
3 SystemArchitecture
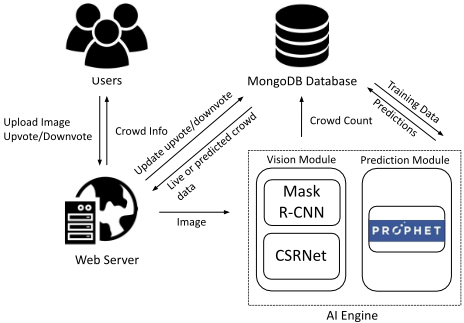
Our system architecture is shown in Fig. 2. When a user uploads an image, the visual analytics module produces a crowd count which is stored together with location, time, and day of the week information in a database. The prediction module uses this data to train models for making forecasts about the current or future crowd counts. To reduce noise in the training data, we curate the historical samples based on their upvote and downvote information. As more data is accumulated in the database, the prediction model is re-trained to reflect new trends. This automated pipeline enables the prediction module to get better with more contributions from the users both in the form of uploading images or curating uploads of others.
4 AI Engine
The AI engine contains a visual analytics module for crowd counting and an prediction module for forecasting the number of visitors at the various locations. The vision module uses a hybrid approach by combining Mask R-CNN [He et al., 2017], an object detection model and CSRNet [Li et al., 2018], a density estimation method into a single workflow for accurate crowd counting. The prediction module uses Prophet [Taylor and Letham, 2018], an open source forecasting library designed by Facebook. Prophet uses regression models rather than time series models like ARIMA. The motivation behind this is to better deal with the irregular time series with missing data (i.e. no pictures uploaded by users) or outliers (i.e. inaccurate counts from the vision module or malicious users that upload irrelevant pictures).
5 Results and Discussion
5.1 Data Collection
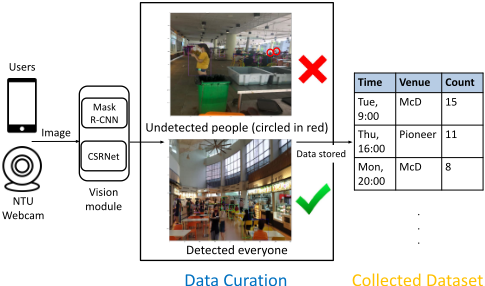
To evaluate the prediction module's real-world forecasting ability, we collected data at two locations, a campus McDonald's and a campus canteen over a span of 4 weeks at hourly intervals. The resulting dataset consists of 754 samples in total and we use the first 3 weeks of data as training (603 samples) and test on the last week (151 samples). We manually curate the dataset for any image that has poor detection results and correct the counts (Fig. 3).
5.2 Model Performance
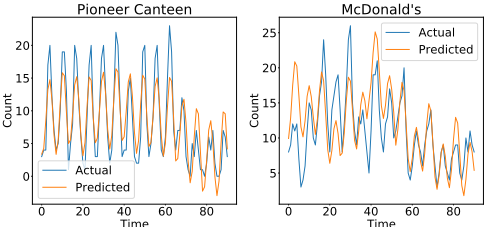
The predictive model uses an additive regression model with components for modeling growth trends, seasonal patterns, and holidays. The model parameters are set based on the time span of data collected. In this case, only a month's data is collected and we choose to model daily and weekly trends only. We report the Root Mean Squared Error (RMSE), Mean Absolute Error (MAE), Median Absolute Percentage Error (MdAPE), and Coverage on our dataset in Table 1. At both Data Curation Collected Dataset venues, our model is able to achieve accurate predictions with high coverage of around 90% (i.e., actual count lies within lower and upper bound of the uncertainty intervals).
| Time | Venue | Count |
|---|---|---|
| Tue, 9:00 | McD | 15 |
| Thu, 16:00 | Pioneer | 11 |
| Mon, 20:00 | McD | 8 |
Figure 3: Dataset creation pipeline
| Venue | RMSE | MAE | MdAPE | Coverage |
|---|---|---|---|---|
| Pioneer Canteen | 3.05 | 2.48 | 0.253 | 0.934 |
| McDonald's | 3.96 | 3.07 | 0.221 | 0.890 |
Time Time
Figure 4: Prediction results
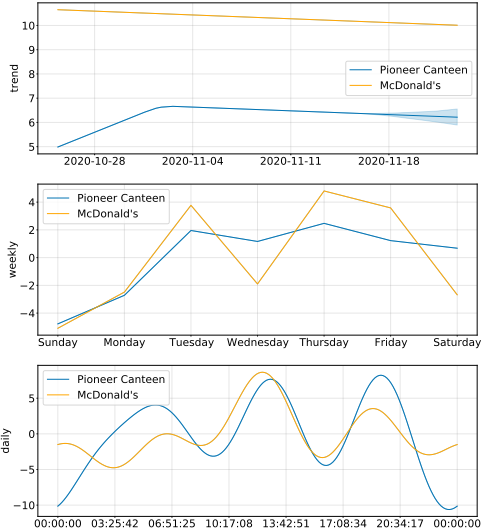
We further analyze seasonality components in our additive model for the two venues (Fig. 5) and observe that some interesting trends have been picked up. For the month of November, the crowd numbers at both venues are trending downwards. This is intuitive, as the period coincides with the study break and examination period when there are generally fewer students. For both Pioneer canteen and McDonald's the peak crowds are observed during lunch (i.e. 12pm) and dinner (i.e. 6pm) periods. There is less of a crowd at McDonald's for dinner time as compared to lunch time. A possible reason for this is that the Pioneer canteen is located near student hostels and students typically have dinner on campus during weekdays. On the other hand, McDonald's has a smaller dinner crowd. This is because it is located at the main campus building. Thus, it is more frequently visited by staff and students during office hours and less so during off office hours.
6 Conclusions and FutureWork
Our platform is an effective solution that assists users in making informed choices on social distancing amid the COVID19 pandemic. Users can make both short term (e.g., where to go for lunch) and long term decisions (e.g., which day should I visit this venue) based on the information provided. Beyond the pandemic, our platform can still serve as a useful tool to help users save time by avoiding queues.
In subsequent work, we will incorporate a reward system to incentivize users to upload photos more frequently to the platform.
Acknowledgments
This research is supported, in part, by the National Research Foundation, Singapore under its AI Singapore Programme (AISG Award No: AISG-GC-2019-003, AISG2-RP-2020019); the NRF Investigatorship Programme (NRFI Award No: NRF-NRFI05-2019-0002); Alibaba Group through Alibaba Innovative Research (AIR) Program and Alibaba-NTU Singapore Joint Research Institute (JRI) (Alibaba-NTUAIR2019B1), Nanyang Technological University, Singapore; WASP/NTU grant M4082187 (4080); the Nanyang Assistant Professorship (NAP); NTU-SDU-CFAIR (NSC-2019011); the RIE 2020 Advanced Manufacturing and Engineering (AME) Programmatic Fund (No. A20G8b0102), Singapore, by the SUTD SRG-ISTD-2021-165, and Singapore Ministry of Education (MOE) Tier 1 (RG16/20). Any opinions, findings and conclusions or recommendations expressed in this material are those of the author(s) and do not reflect the views of the funding agencies.
@inproceedings{ijcai2021p716,
  title     = {Predictive Analytics for COVID-19 Social Distancing},
  author    = {Teng, Harold Ze Chie and Jiang, Hongchao and Ho, Xuan Rong Zane and Lim, Wei Yang Bryan and Ng, Jer Shyuan and Yu, Han and Xiong, Zehui and Niyato, Dusit and Miao, Chunyan},
  booktitle = {Proceedings of the Thirtieth International Joint Conference on
               Artificial Intelligence, {IJCAI-21}},
  publisher = {International Joint Conferences on Artificial Intelligence Organization},
  editor    = {Zhi-Hua Zhou},
  pages     = {5016--5019},
  year      = {2021},
  month     = {8},
  note      = {Demo Track},
  doi       = {10.24963/ijcai.2021/716},
  url       = {https://doi.org/10.24963/ijcai.2021/716},
}
TY - CPAPER TI - Predictive Analytics for COVID-19 Social Distancing AU - Teng, Harold Ze Chie AU - Jiang, Hongchao AU - Ho, Xuan Rong Zane AU - Lim, Wei Yang Bryan AU - Ng, Jer Shyuan AU - Yu, Han AU - Xiong, Zehui AU - Niyato, Dusit AU - Miao, Chunyan T2 - Proceedings of the Thirtieth International Joint Conference on Artificial Intelligence, IJCAI-21 PB - International Joint Conferences on Artificial Intelligence Organization PY - 2021 SP - 5016 EP - 5019 DO - 10.24963/ijcai.2021/716 UR - https://doi.org/10.24963/ijcai.2021/716 ER -Copied
Machine-readable versions of this paper, for tools and AI agents:





