
Bias Silhouette Analysis: Towards Assessing the Quality of Bias Metrics for Word Embedding Models
Proceedings of the Thirtieth International Joint Conference on Artificial Intelligence. Main Track. Pages 552-559.
https://doi.org/10.24963/ijcai.2021/77
Keywords
- AI Ethics, Trust, Fairness: Societal Impact of AI
- AI Ethics, Trust, Fairness: Fairness
- Natural Language Processing: Natural Language Processing
Abstract
Word embedding models reflect bias towards genders, ethnicities, and other social groups present in the underlying training data. Metrics such as ECT, RNSB, and WEAT quantify bias in these models based on predefined word lists representing social groups and bias-conveying concepts. How suitable these lists actually are to reveal bias - let alone the bias metrics in general - remains unclear, though. In this paper, we study how to assess the quality of bias metrics for word embedding models. In particular, we present a generic method, Bias Silhouette Analysis (BSA), that quantifies the accuracy and robustness of such a metric and of the word lists used. Given a biased and an unbiased reference embedding model, BSA applies the metric systematically for several subsets of the lists to the models. The variance and rate of convergence of the bias values of each model then entail the robustness of the word lists, whereas the distance between the models' values gives indications of the general accuracy of the metric with the word lists. We demonstrate the behavior of BSA on two standard embedding models for the three mentioned metrics with several word lists from existing research.
- [Barocas and Selbst, 2016] Solon Barocas and Andrew D. Selbst. Big Data's Disparate Impact. California Law Re- view, 104(3):671-732, 2016.
- [Bolukbasi et al., 2016] Tolga Bolukbasi, Kai-Wei Chang, James Y Zou, Venkatesh Saligrama, and Adam T Kalai. Man is to Computer Programmer as Woman is to Home- maker? Debiasing Word Embeddings. In Advances in NIPS, pages 4349-4357, 2016.
- [Caliskan et al., 2017] Aylin Caliskan, Joanna J. Bryson, and Arvind Narayanan. Semantics derived automatically from language corpora contain human-like biases. Science, 356(6334):183-186, 2017.
- [Dev and Phillips, 2019] Sunipa Dev and Jeff Phillips. Atten- uating Bias in Word vectors. In Procs. of the 22nd Interna- tional Conference on AISTATS, pages 879-887, 2019.
- [Dev et al., 2020] Sunipa Dev, Tao Li, Jeff M. Phillips, and Vivek Srikumar. On Measuring and Mitigating Biased Inferences of Word Embeddings. In Procs. of the AAAI Conference on Artificial Intelligence, pages 7659-7666, 2020.
- [Ethayarajh et al., 2019] Kawin Ethayarajh, David Duve- naud, and Graeme Hirst. Understanding Undesirable Word Embedding Associations. In Procs. of the 57th Annual Meeting of the ACL, pages 1696-1705, 2019.
- [Fiske, 1993] Susan T. Fiske. Controlling other people: The impact of power on stereotyping. American Psychologist, 48(6):621-628, 1993.
- [Garg et al., 2018] Nikhil Garg, Londa Schiebinger, Dan Ju- rafsky, and James Zou. Word embeddings quantify 100 years of gender and ethnic stereotypes. Procs. of the Na- tional Academy of Sciences, 115(16):E3635-E3644, 2018.
- [Gonen and Goldberg, 2019] Hila Gonen and Yoav Goldberg. Lipstick on a Pig: Debiasing Methods Cover up Systematic Gender Biases in Word Embeddings But do not Remove Them. In Procs. of the 2019 Conference of the NAACL: Human Language Technologies, pages 609-614, 2019.
- [Greenwald and Banaji, 1995] Anthony G. Greenwald and Mahzarin R. Banaji. Implicit social cognition: Atti- tudes, self-esteem, and stereotypes. Psychological Review, 102(1):4-27, 1995.
- [Hu and Liu, 2004] Minqing Hu and Bing Liu. Mining and summarizing customer reviews. In Procs. of the tenth ACM SIGKDD international conference on Knowledge discovery and data mining, pages 168-177, 2004.
- [Hutchinson et al., 2020] Ben Hutchinson, Vinodkumar Prab- hakaran, Emily Denton, Kellie Webster, Yu Zhong, and Stephen Denuyl. Social Biases in NLP Models as Barriers for Persons with Disabilities. In Procs. of the 58th Annual Meeting of the ACL, pages 5491-5501, 2020.
- [Manzini et al., 2019] Thomas Manzini, Lim Yao Chong, Alan W Black, and Yulia Tsvetkov. Black is to Crimi- nal as Caucasian is to Police: Detecting and Removing Multiclass Bias in Word Embeddings. In Procs. of the 2019 Conference of the NAACL: Human Language Technologies, pages 615-621, 2019.
- [Mikolov et al., 2013] Tomas Mikolov, Ilya Sutskever, Kai Chen, Greg S Corrado, and Jeff Dean. Distributed Repre- sentations of Words and Phrases and their Compositionality. In Advances in NIPS, pages 3111-3119, 2013.
- [Papakyriakopoulos et al., 2020] Orestis Papakyriakopoulos, Simon Hegelich, Juan Carlos Medina Serrano, and Fabi- enne Marco. Bias in word embeddings. In Procs. of the 2020 Conference on Fairness, Accountability, and Trans- parency, pages 446-457, 2020.
- [Pennington et al., 2014] Jeffrey Pennington, Richard Socher, and Christopher Manning. GloVe: Global Vectors for Word Representation. In Procs. of the 2014 Conference on EMNLP, pages 1532-1543, 2014.
- [Raji et al., 2020] Inioluwa Deborah Raji, Timnit Gebru, Mar- garet Mitchell, Joy Buolamwini, Joonseok Lee, and Emily Denton. Saving Face: Investigating the Ethical Concerns of Facial Recognition Auditing. In Procs. of the AAAI/ACM Conference on AI, Ethics, and Society, pages 145-151, February 2020.
- [Shwartz and Choi, 2020] Vered Shwartz and Yejin Choi. Do Neural Language Models Overcome Reporting Bias? In Procs. of the 28th International Conference on Compu- tational Linguistics, pages 6863-6870, Barcelona, Spain (Online), December 2020.
- [Speer et al., 2017] Robyn Speer, Joshua Chin, and Catherine Havasi. ConceptNet 5.5: An Open Multilingual Graph of General Knowledge. In Thirty-First AAAI Conference on Artificial Intelligence, 2017.
- [Speer, 2017] Robyn Speer. ConceptNet Numberbatch 17.04: Better, less-stereotyped word vectors. blog.conceptnet.io/ posts/2017/conceptnet-numberbatch-17-04-better-less- stereotyped-word-vectors, 2017. Last accessed: 2020-09- 03. Link
- [Sun et al., 2019] Tony Sun, Andrew Gaut, Shirlyn Tang, Yuxin Huang, Mai ElSherief, Jieyu Zhao, Diba Mirza, Eliz- abeth Belding, Kai-Wei Chang, and William Yang Wang. Mitigating Gender Bias in Natural Language Processing: Literature Review. In Procs. of the 57th Annual Meeting of the ACL, pages 1630-1640, 2019.
- [Sweeney and Najafian, 2019] Chris Sweeney and Maryam Najafian. A Transparent Framework for Evaluating Unin- tended Demographic Bias in Word Embeddings. In Procs. of the 57th Annual Meeting of the ACL, pages 1662-1667, 2019.
- [Swinger et al., 2019] Nathaniel Swinger, Maria De-Arteaga, Neil Thomas Heffernan IV, Mark DM Leiserson, and Adam Tauman Kalai. What are the Biases in My Word Embedding? In Procs. of the 2019 AAAI/ACM Conference on AIES, pages 305-311, 2019.
- [Zhang et al., 2020] Haiyang Zhang, Alison Sneyd, and Mark Stevenson. Robustness and Reliability of Gender Bias Assessment in Word Embeddings: The Role of Base Pairs. In Procs. of the 1st Conference of the AACL, pages 759-769, 2020.
- [Zhao et al., 2017] Jieyu Zhao, Tianlu Wang, Mark Yatskar, Vicente Ordonez, and Kai-Wei Chang. Men Also Like Shopping: Reducing Gender Bias Amplification using Corpus-level Constraints. In Procs. of the 2017 Confer- ence on EMNLP, pages 2979-2989, 2017.
References were extracted automatically from the PDF and may contain errors.
Full text extracted automatically from the PDF; figures, tables and equations may differ. The PDF is the version of record.
1 Introduction
Social bias refers to implicit or explicit prejudices against social groups such as ethnicities, genders or persons with disabilities [Hutchinson et al., 2020]. Studies have demonstrated that such bias is often manifested in pretrained language models [Sun et al., 2019]. These models further tend to exaggerate patterns of stereotypes in the underlying training data and thus amplify existing biases [Zhao et al., 2017; Shwartz and Choi, 2020]. This is particularly problematic if they are used as a starting point for other models, which likely adopt the biases. With increasing applications of language models to real-world scenarios, potential consequences for the affected social groups grow as well [Raji et al., 2020].
A prominent example is given by word embedding models [Mikolov et al., 2013]. As most word embedding algorithms encode patterns of word usage, they are also susceptible to inherit social biases from the training data. Such inherited biases can then lead to negative consequences when the word embeddings are used in real-world applications like creditworthiness assessment or crime prediction [Dev and Phillips, 2019]. To quantify the biases in pretrained models, different metrics have been proposed, such as the Embedding Coherence Test (ECT) [Dev and Phillips, 2019], the Relative Negative Sentiment Bias (RNSB) [Sweeney and Najafian, 2019], and the Word Embedding Association Test (WEAT) [Caliskan et al., 2017]. To the best of our knowledge, all such bias metrics follow the general intuition that bias is reflected by overproportional associations between certain social groups (e.g., some ethnicity) and bias-conveying concepts (e.g., a specific sentiment). This is also the notion of social bias that we adopt in this work. 1
Different factors influence the results of bias metrics. Besides the chosen embedding algorithm (e.g., Skip-Gram or CBOW), its hyperparameters (e.g., window sizes), and distance measures applied by the metrics (e.g., cosine), a critical aspect is that the metrics rely on predefined word lists to represent the social groups and bias-conveying concepts. These lists are delicate for two main reasons: First, words that cannot be embedded (i.e., out-of-vocabulary tokens) may influence the results of a metric. Especially for models trained on smaller or specialized text corpora, this is important, since the probability that words from the lists are out-of-vocabulary is higher there. Second, it often remains unclear how representative the used word lists are. If the exact source is not stated, it is impossible to assess the biases already encoded in the choice of words, for example, caused by a specific cultural background or experience of the authors [Greenwald and Banaji, 1995].
Even though some bias metrics are widely utilized already, they themselves have hardly been evaluated, except for general evidence that they reveal biases known from psychology [Caliskan et al., 2017]. We argue that a methodological assessment of the metrics' quality and of the impact of the outlined factors on their results is needed. In this paper, we focus on the word lists, seeking to answer the following questions:
- How robust are the word lists to capture a certain social bias across bias metrics and embedding models?
- What is the most accurate combination of metric and word lists to measure a certain social bias?
1 For brevity, the terms bias and social bias are used interchangeably in this work, unless indicated otherwise.
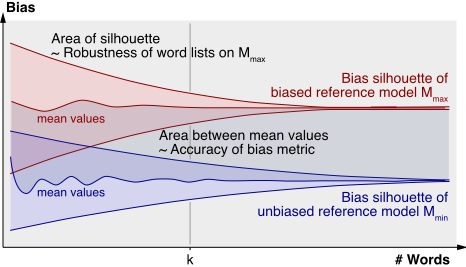
To this end, we present Bias Silhouette Analysis (BSA), a method to assess the quality of any combination of bias metric and word lists in terms of their accuracy and robustness. The core idea of BSA is to quantify how much the bias values of a metric vary depending on what words from the lists are actually observed. In particular, given a biased and an unbiased reference embedding model, BSA systematically computes bias values for each model using word list subsets of increasing length. This leads to a bias silhouette for each model, which represents the range of computed values for all evaluated lengths, as illustrated in Figure 1. The area of each silhouette reflects variance and rate of convergence, entailing the robustness of the word lists against failures to embed words. Assuming the given models represent extreme points, a metric should put the two silhouettes as far apart from each other as possible. The area between the silhouettes' mean values gives indications of the metrics' general accuracy.
We apply BSA to ECT, RNSB, and WEAT and word lists for three types of social bias (ethnicity, gender, and religion), using GloVe and Numberbatch as biased and unbiased embedding model, respectively. Our analysis reveals how the selected metrics differ from each other, contributing towards a general evaluation of embedding-based bias metrics. Concretely, we find that ECT provides the most robust results over all word lists. That said, our results also suggests that ECT is the least accurate metric compared to RNSB and WEAT. In general, though, all metrics fail to meaningfully separate the two models along their respective bias quantification range.
With BSA, we contribute a first method to systematically assess the quality of bias metrics for word embedding models. Its underlying assumption that models exist for which the level of bias is known a priori may be questioned. For our experiments, we chose GloVe and Numberbatch, as they were found to be comparably biased and unbiased, respectively, in prior intrinsic and extrinsic evaluations [Speer et al., 2017; Caliskan et al., 2017; Sweeney and Najafian, 2019; Gonen and Goldberg, 2019]. We point out, though, that BSA is generic and applies to any word embedding model and word list-based metric. Future work may construct explicitly biased and unbiased datasets, train reference models on them, and then repeat our evaluation. For this purpose, we also publish the code alongside the paper. 2
2 RelatedWork
Stereotypes of different nature give rise to prejudices against social groups identified by gender, ethnicity, (dis)ability, religion, or similar attributes of their members [Sweeney and Najafian, 2019]. Such prejudices are also referred to as social bias. Social bias can induce discriminatory behavior that manifests in social disadvantage or exclusion [Fiske, 1993].
However, social bias is not always expressed explicitly, but may also be visible implicitly only in actions and decisions [Greenwald and Banaji, 1995]. As an example, the trust in a person to do a job well might be affected, consciously or unconsciously, by the person's gender. With the increasing application of AI systems to real-world applications, this issue of implicit bias also becomes relevant for the underlying methods [Barocas and Selbst, 2016]. An evaluation of bias in these methods is thus indispensable to ensure fair decisions and the ability to correctly put their outputs into context.
In natural language processing in particular, many methods nowadays rely on black-box word embeddings that aim to model word usage patterns from large text corpora as a vector space [Mikolov et al., 2013]. By nature, text corpora are prone to inherit historical and contemporary social biases or to even amplify them [Papakyriakopoulos et al., 2020]. To evaluate biases in embedding models, different approaches have been proposed; both extrinsic approaches that check the output of a model for biases [Dev et al., 2020] and intrinsic ones that analyze the vector space [Bolukbasi et al., 2016; Ethayarajh et al., 2019]. We focus on the latter in this paper.
Intrinsic methods include metrics that aim to quantify biases. Most of them measure how related or unrelated certain concepts are, where the concepts are described by lists of words. For social biases, in particular, they measure how an embedding model associates a certain target group (referred to as social group henceforth) to some semantic category (henceforth, bias-conveying concept) and how that differs for another group. Effectively, however, the metrics are unsupervised and thus require manual quality assessment. The method we present below supports researchers on this task.
For our experiments, we select three common bias metrics, ECT [Dev and Phillips, 2019], RNSB [Sweeney and Najafian, 2019], and WEAT [Caliskan et al., 2017]. ECT and WEAT evaluate directional bias in a range of [-1, 1] and [-2, 2], respectively, based on vector-distance measures, whereas RNSB quantifies bias in [0, 1] based on probability predictions of a logistic regression classifier. For further details, we refer the reader to the original publications. Other proposed metrics include the Mean Average Cosine Similarity (MAC) [Manzini et al., 2019] as well as the Relational Inner Product Association (RIPA) [Ethayarajh et al., 2019]. The latter resulted from the observation that WEAT seems to overstate biases, even if its general tendencies correlate with results of the well-known Implicit Association Test [Caliskan et al., 2017].
Hardly any work exists yet that aims to assess the quality of bias metrics systematically, a gap that we fill with this paper.
2 https://github.com/webis-de/IJCAI-21
With a somewhat similar idea, Zhang et al. [2020] recently examined the stability of bias metrics, looking at the results of small changes to word pairs, such as capitalizing their first letters or replacing them with others that should have a similar association. According to their findings, none of the evaluated metrics is reliable in identifying biases in word embeddings. In contrast, we present a more general method to evaluate the metrics against assumed levels of social bias (referred to as accuracy below). Moreover, we generally investigate the robustness of the word lists underlying the metrics.
3 Bias Silhouette Analysis
We now present the Bias Silhouette Analysis (BSA), a generic method to assess the quality of any metric that measures social bias in word embedding models based on word lists representing social groups and bias-conveying concepts.
In a nutshell, BSA quantifies how much the outputs of a given metric vary depending on what words from the used lists are actually observed (implying the lists' robustness under the metric) as well as how clearly it reveals differences between a biased and an unbiased reference embedding model (the metric's accuracy). BSA has a visual intuition, as sketched in Figure 1, but it relies on a precise mathematical foundation. In the following, we discuss the notions of robustness and accuracy, before we detail how to assess quality using BSA.
3.1 Quality of Bias Metrics
The metrics we consider all share that they quantify a specific social bias captured in a word embedding model by a bias value on a predefined scale (such as [-2, 2] in case of WEAT). This value is derived from the embeddings of words in two or more word lists. Each list represents, on the one hand, a social group of interest and, on the other hand, a bias-conveying concept. Ideally, the bias value should precisely locate the model within the bias value distribution, i.e., the value should allow for an absolute interpretation of the model's respective bias as well as a relative comparison to the bias of other models. We informally capture this notion in the following definition:
Accuracy. A bias metric B based on word lists W1, . . . ,Wl, l ≥ 2, is more accurate for a word embedding model M, the better the value b that B assigns to M reflects the real-world social bias of M represented by W1, . . . ,Wl.
Practically, however, a real assessment of accuracy is difficult, since ground-truth bias values of word embedding models are, at the time of writing, not accessible. Below, we will discuss how to alleviate this problem when given embedding models that can be assumed to approximate extreme cases.
The definition of accuracy could easily be extended to a set of models, given that the comparability of different models implies the natural requirement that a bias metric should be applicable to any word embedding model. In this regard, the dependency of a bias metric on its associated word lists calls for a second quality criterion to consider. In particular, a bias metric should ideally still be accurate for a word embedding model, even if the model does not cover all the words from the word lists. We define this property as follows:
Robustness. The word lists W1, . . . ,Wl, l ≥ 2, are more robust under a given bias metric B, the less the value assigned by B to a word embedding model M varies depending on what words fromW1, . . . ,Wl are covered byM.
Unlike accuracy, robustness can be assessed intrinsically for any model and any given combination of bias metric and word lists, by looking at the subsets of the lists. For a specific bias, it may be expected that some words are more central to the computation of bias values (e.g., "he" and "she" in case of binary gender groups). In general, however, we argue that no assumption should be made about the existence of specific words in an embedding model, in order not to reduce the applicability of bias metrics to models derived from generalpurpose corpora. As detailed in the following, we therefore consider arbitrary subsets of word lists in the BSA method.
3.2 Computation of Bias Silhouettes
BSA analyzes what we call bias silhouettes, that is, areas in a two-dimensional plot that represent how much the value of a given bias metric B varies on a given word embedding model M, depending on what words from the associated word lists are actually observed. We now present how to compute silhouettes; their analysis follows in the next section.
In particular, BSA evaluates either of the two types of word lists (i.e., social group words or bias-conveying concept words) at a time, not both simultaneously. Hence, there are one or more word lists W1, . . . ,Wl, l ≥ 1, to be evaluated (all metrics reviewed in Section 2 have l ∈ {1, 2}). Based on these lists, BSA iteratively creates random subsets Wk ⊆ W∪ = ⋃li=1 Wi of increasing size k. New subsets are created by extending previous ones. The size k iterates from some small value kmin ≥ l to the size of the complete union of all lists, kmax = |W∪|. In each step, k increases by some ∆k > 0 (in the experiments in Section 4, we set ∆k = 2 for social groups and ∆k = 6 for bias-conveying concepts). BSA then applies the metric B once using each subset list Wk to compute a bias value bk on the model M. The idea behind evaluating subsets of word lists is to simulate that not all words from the lists might occur in a text corpus of interest.
The outlined process results in a sequence of bias values s = (b(1) , . . . , b(m) ), where m equals the number of values of k considered. This process is now repeated n times, so we obtain a set of sequences {s1, . . . , sn} of bias values (in Section 4, we use n = 100, but we also evaluate this parameter afterwards). Based on the sequences, we define the bias silhouette of B on M as:
where ∀i, 1 ≤ i ≤ m:
In other words, a bias silhouette is defined by two interpolated curves that represent the minimum and maximum bias values observed for each considered size of the used word lists respectively. Figure 1 sketches the silhouettes of two models.
3.3 Analysis of Bias Silhouettes
The computation of a bias silhouette can be done for any combination of word embedding model, bias metric and associated word lists. These silhouettes can be directly interpreted, visually and mathematically, in terms of the accuracy of the given bias metric and the robustness of the given word lists.
By definition, the boundaries of a silhouette converge towards the maximum number of words included. The implicit working hypothesis underlying this behavior is that the most precise bias value results from using all words. As a matter of fact, a robust set of word lists should make the metric stay close to this value, even if only some subset of the contained words is actually observed. The larger the area of a bias silhouette, the higher the variance from the value. Thus, the robustness of the word lists is reflected visually by the proportion of the entire area not covered by the bias silhouette. Mathematically, we operationalize this notion as follows.
Robustness Score. Let W1, . . . ,Wl, l ≥ 1, be the word lists (of either social groups or bias-conveying concepts) utilized by a bias metric B, let W∪ = ⋃li=1 Wi, and let bmin and bmax be the lowest and highest value of B respectively, bmin < bmax. Now, let S(B) M be the bias silhouette of a word embedding model M under B. Then the robustness score of B on M is
where ∫ S(B) M denotes the area of S(B) M .
Since the silhouettes are defined by interpolated curves, we can technically compute this area using the trapezoidal rule. Theoretically, a score of 1.0 is given to a silhouette without area, and a score of 0.0 to a silhouette that covers the entire area possible.
The robustness score can be computed with any word embedding model. In contrast, the accuracy of a bias metric requires word embedding models for which a ground-truth bias is known. Since such models are not available at present, we resort to the comparison of two reference models instead-one each that can be assumed to be unbiased and biased respectively. In Section 4, we make this choice based on current literature, but our method applies to any such models.
Now, under the assumption made, an accurate bias metric should assign a low value to the unbiased and a high value to the biased model, the larger the difference the better. Moreover, in line with the idea of the bias silhouettes, we argue that the values should remain stable, even if not all words used by the metric are actually observed. By this, we simulate the accuracy of the metric beyond the reference models: If a combination of metric and word lists robustly compute bias values on the reference models irrespective of the words actually observed, it will likely also be accurate for other models. Visually speaking, this means that the mean values should be as low as possible for the silhouette of the unbiased reference model and as high as possible for the biased reference model. Hence, the area between the mean values reflects the metric's accuracy (see Figure 1). We capture this notion in the accuracy score.
Accuracy Score. Let W∪, B, bmax be defined as before, and let b0 be the value of B that represents the absence of bias, b0 < bmax. Let µ(B) M (k) be the mean value of a bias silhouette S(B) M of a word embedding model M over all subsets of W∪ of size k. Now, let Mmin and Mmax be an unbiased and a biased reference word embedding model. Then the accuracy score of B with respect to Mmin and Mmax is
where ∫k |µ(B) max(k)| - |µ(B) min (k)| denotes the area between the mean values, as depicted in Figure 1.
The use of absolute values is necessary here, since some bias metrics (e.g., WEAT) have b0 = 0 while negative bias values indicate bias in the direction opposite to bmax, with bmax = -bmin. The area may even be negative, in case more bias is observed for Mmin than for Mmax. The included factor 0.5 normalizes the computed value to the range [0, 1] such that a(B) = 0.5 means that no bias difference is observed for the two models, i.e., a(B) should hence be larger than 0.5, if Mmin andMmax are chosen at least somewhat properly.
The two defined scores allow us to assess the quality of any combination of bias metric and word lists for measuring a certain social bias. We demonstrate the insights that can be gained from our method in the following experiments.
4 Experiments
To study the two research questions from Section 1 empirically, we applied the presented Bias Silhouette Analysis (BSA) to two standard word embedding models using word lists representing three types of social bias and three bias metrics. This section reports on the details and findings of this study.
4.1 Experimental Setup
We conducted our experiments with the following setup.
Word Embedding Models. As biased and unbiased models, we use GloVe CommonCrawl [Pennington et al., 2014] trained on 840 billion English tokens and the English ConceptNet Numberbatch 19.08 [Speer et al., 2017] (referred to as NBatch below), respectively. While GloVe has surfaced multiple social biases [Caliskan et al., 2017; Sweeney and Najafian, 2019], NBatch was explicitly debiased [Speer, 2017] and its lower bias has later been confirmed empirically [Sweeney and Najafian, 2019]. Both thus seem to be a viable choice for this kind of task. We acknowledge, however, that the selection is not optimal, as we do not know the exact level of bias the model inherited from their training data and parameter choices.
Word Lists. Working with longer word lists allows us to create a test environment and to evaluate bias metrics systematically with lists of varying sizes and contents. In order to include as many words as possible, we combine word lists for social groups and bias-conveying concepts from prior work:
- Ethnicity. Social groups: African-American and European-American names of Caliskan et al. [2017] and Garg et al. [2018]. Bias-conveying concepts: Positive and negative sentiment words of Hu and Liu [2004].
- Gender. Social groups: Male and female terms and first names of Bolukbasi et al. [2016], Caliskan et al. [2017], Dev and Phillips [2019], and Garg et al. [2018]. Biasconveying concepts: Male and female professions of Bolukbasi et al. [2016].
- Religion. Social groups: Christian and Islamic terms of Garg et al. [2018] and Manzini et al. [2019]. Biasconveying concepts: Same words as for ethnicity.
To control for failed encodings, we remove every word from the lists for which any of the used embeddings models was not able to return a vector. In doing so, we ensure that both models can be evaluated under the exact same conditions. Another important parameter of BSA is the step size, ∆k, by which we increase the word lists iteratively. We set ∆k = 2 for the social group word lists, adding one word from each group per step (for uniformly distributed lists). As the word lists for bias-conveying concepts contain consistently more words, we found ∆k = 6 to work well. Subsets of the lists were created pseudo-randomly to ensure reproducible results.
Bias Metrics. We selected three common metrics recently proposed to indicate the presence of bias in word embedding models, namely, ECT [Dev and Phillips, 2019], RNSB [Sweeney and Najafian, 2019] and WEAT [Caliskan et al., 2017]. These metrics represent the diversity of approaches to evaluate bias in word embedding models well. 3 For ECT, we use the implementation published by the authors. 4 Since the authors of WEAT and RNSB did, to the best of our knowledge, not publish their code, we re-implemented them. For WEAT, we managed to reproduce the original results almost perfectly and attribute smaller differences to implementation details. We were not able to do the same for RNSB, though, as we did not find the word lists used in the original publication.
Runs. Amajor influencing factor of the final silhouette size is the number of runs n in which random subsets of the word list are created and stepwise increased. Due to the exponential number of possible combinations, it is practically infeasible to evaluate all subsets. We thus approximated the silhouette with fewer runs. In a pilot study, we evaluated changes in the silhouette size for up to n = 100 shuffled word lists. The results can be found in Appendix A. 5 In short, we found that, as of n = 80, the resulting robustness and accuracy scores change by less than 0.003 on average with a maximum observed difference of 0.010. When time is scarce, even n = 40 may provide a sufficient approximation. For exactness, the analysis presented below is based on the evaluation with n = 100.
3 We decided against other metrics for different reasons. For example, while the MAC metric is strictly meant for a multi-class setting, the code for the RIPA metric was, at the time of writing, neither published nor trivial to re-implement.
4 https://github.com/sunipa/Attenuating-Bias-in-Word-Vec
5 The supplementary material is published alongside our code.
4.2 Robustness Results
Table 1 presents the robustness scores for all combinations of bias type, word lists, and metric. For ethnicity bias, Figure 2 plots the bias silhouettes. All other plots are in the appendix.
In general, we observe both high and lower scores. While WEAT obtains the highest score in 50% of the cases, in doubt ECT seems most robust, never having the lowest score. In contrast, the scores of WEAT show strong variance, ranging from 0.57 (for religious bias on GloVe) to 1.00 (for ethnicity and gender bias on NBatch). Especially on GloVe, the low robustness scores suggest that the computed bias values strongly depend on specific words. For example, this is the case for RNSB and its corresponding bias silhouettes, shown in Figure 2(c-d).
Further, word lists' sizes do not necessarily imply their robustness. For example, scores for the bias-conveying concept lists of ethnicity and religious bias with 6484 words do generally not exceed the ones of gender bias (290 words) by a big margin. As depicted for ethnicity in Figure 2(d), the respective bias silhouette on the GloVe model still shows a large variance towards the end, suggesting that small changes can influence the bias values. To some degree, this counters the intuition that single words lose importance in larger lists, especially for mean-based metrics such as ECT and WEAT.
However, the size of word lists still influences the results. Especially very short lists, seem susceptible to changes. Consequently, the variance is always higher when only a small portion of the full word lists is utilized, visually indicated by the larger height of the bias silhouettes in those ranges. These results suggest that failures to embed single words can have a notable impact on the metrics' output. For ECT and WEAT, variance is often observed for short lists only; in cases such as Figure 2(b) and (f), rather few words seem to suffice. For RNSB, though, some results suggest that small portions of the lists can have a larger impact on the score. The number of embedding failures should thus be considered when evaluating embedding models for social biases with such metrics.
Another finding is that the robustness scores of word list depend on the given embedding model. The most obvious example in Table 1 is ethnicity bias with RNSB. While the word list receives a perfect score of 1.0 (rounded) with NBatch, its score on GloVe is only 0.59. Even though the difference is lower for other cases, it is still visible. A possible explanation is that the two models were trained with different algorithms, which may affect the results. Such influence might, for example, manifest in the ability of the metric to utilize the algorithm-specific vector space or the quality of the model itself. With the results at hand, however, it is not possible to draw a final conclusion and identify a single factor.
4.3 Accuracy Results
The accuracy scores of each combination are given in Table 2, the scores for ethnicity bias are also shown in Figure 2.
Overall, BSA suggests that the least accurate metric is ECT. It received the lowest score in all six cases, even below 0.5 for gender bias (i.e., the silhouette of NBatch lies above GloVe on average). Findings from related work make such a result in which NBatch conveys more gender bias than GloVe somewhat unlikely, even if the two reference models may not actually be extreme points. In general, RNSB seems most accurate according to our results. That said, no metric can be judged best across all bias types and word lists: While RNSB increases upon the scores of the other metrics by > 0.06 for gender and religion word lists, the WEAT metric achieves the highest scores for ethnicity bias (0.60 and 0.61).
| Ethnicity Bias | Gender Bias | Religious Bias | ||||||||||
|---|---|---|---|---|---|---|---|---|---|---|---|---|
| Social Group | Bias Concept | Social Group | Bias Concept | Social Group | Bias Concept | |||||||
| Metric | GloVe | NBatch | GloVe | NBatch | GloVe | NBatch | GloVe | NBatch | GloVe | NBatch | GloVe | NBatch |
| ECT | 0.74 | 0.87 | 0.98 | 0.97 | 0.93 | 0.86 | 0.87 | 0.90 | 0.69 | 0.89 | 0.96 | 0.95 |
| RNSB | 0.73 | 0.99 | 0.59 | 1.00 | 0.85 | 0.96 | 0.78 | 1.00 | 0.61 | 0.86 | 0.57 | 0.95 |
| WEAT | 0.79 | 0.74 | 0.98 | 0.92 | 0.95 | 0.74 | 0.95 | 0.88 | 0.70 | 0.67 | 0.97 | 0.93 |
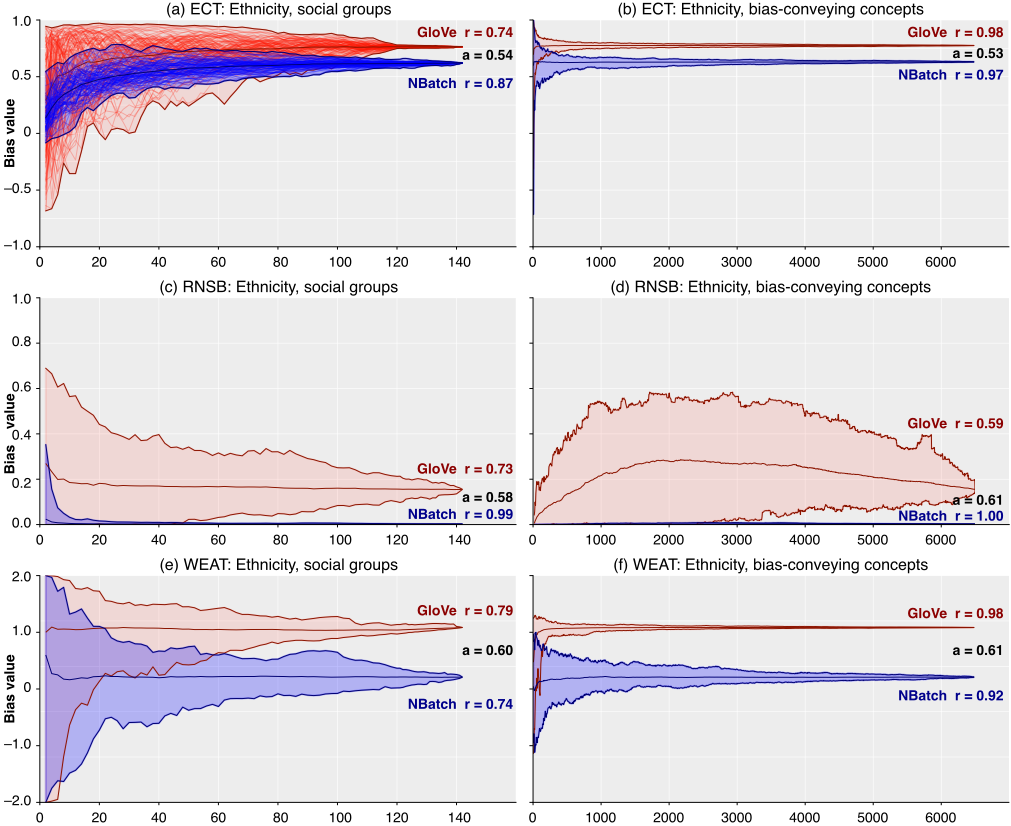
However, our results also indicate that either all metrics fail to clearly distinguish the two models, or the models are actually less different than assumed: Except for the high accuracy of RNSB for gender bias (0.79 and 0.71), the scores in Table 2 imply few room to differentiate meaningfully between their levels of bias. In the first case, the metrics may not be capable of revealing the presence of social bias to the expected degree. This may be due to imperfect word lists or internal calculations; the main cause cannot be assessed though, due to the black-box character of the word embedding models. In the second case, we see in Figure 2 that RNSB and WEAT correctly quantify the bias of NBatch to be low, whereas rarely a very high value is assigned to GloVe. This could mean that GloVe is not an optimal reference model for high bias, but we leave the search for better models in this regard to future work.
| Ethnicity bias | Gender Bias | Religious Bias | ||||
|---|---|---|---|---|---|---|
| Metric | Group | Concept | Group | Concept | Group | Concept |
| ECT | 0.54 | 0.54 | 0.49 | 0.48 | 0.54 | 0.54 |
| RNSB | 0.58 | 0.61 | 0.79 | 0.72 | 0.60 | 0.61 |
| WEAT | 0.60 | 0.61 | 0.60 | 0.61 | 0.54 | 0.54 |
Finally, we observe that, in contrast to the results on robustness, the accuracy scores go hand in hand for the two types of word lists across metrics. This supports the idea that the accuracy measure of BSA is able to isolate the metrics' quality from the word lists and can thus be evaluated across metrics, as long as the same word lists and models are compared.
5 Conclusion
We have presented Bias Silhouette Analysis (BSA), a method to assess the quality of metrics that measure bias in word embedding models based on word lists. BSA provides a mathematical approach, along with a visual intuition, to quantify the general robustness of the word lists as well as the accuracy with respect to an unbiased and a biased reference model.
We have applied BSA to multiple metrics and word lists, observing that both robustness and accuracy vary depending on the combination used. While the ECT metric shows the most stable robustness results across word lists, it seems less accurate, most notably compared to RNSB. Our results suggest that BSA is able to isolate a metrics' accuracy from the specific word lists used. We also found that longer word lists are not always better and that metrics may depend strongly on specific words included. The latter is particularly critical for smaller word embedding models. In general, no metric convincingly distinguished the reference models in terms of bias in all cases.
With respect to accuracy, a limitation of BSA lies in the dependence on reference models. Our literature-based choice of models might not really represent extreme points of bias. We point out, though, that BSA is generic and can be applied again as soon as better reference models are available. Furthermore, we emphasize that a method such as BSA is important, even if a truly unbiased reference model already exists. In particular, embedding models are often generated for domain-specific purposes and problems, where the data may vary strongly from general-purpose data. This makes the existence of a one-sizefits-all unbiased word embedding model unlikely. Thus, there is still a need for good bias metrics and, hence, a method to assess the metrics' quality.
A factor left unevaluated is the impact of the embedding algorithm, as we do not know the bias of the underlying training data. Also, the word lists used in our evaluation have not been examined for completeness and correctness, but relied solely on prior work. In this regard, we further note that the lists are geared towards direct bias rather than indirect bias [Swinger et al., 2019] and assume western-centric views of issues for the evaluated social groups. While not strictly a problem, it is definitely worth considering the applicability of the lists when employing them in different contexts.
Ultimately, the goal of this work is to contribute towards a better understanding of bias metrics for word embedding models and, with that, towards generally fairer NLP applications.
@inproceedings{ijcai2021p77,
  title     = {Bias Silhouette Analysis: Towards Assessing the Quality of Bias Metrics for Word Embedding Models},
  author    = {Spliethöver, Maximilian and Wachsmuth, Henning},
  booktitle = {Proceedings of the Thirtieth International Joint Conference on
               Artificial Intelligence, {IJCAI-21}},
  publisher = {International Joint Conferences on Artificial Intelligence Organization},
  editor    = {Zhi-Hua Zhou},
  pages     = {552--559},
  year      = {2021},
  month     = {8},
  note      = {Main Track},
  doi       = {10.24963/ijcai.2021/77},
  url       = {https://doi.org/10.24963/ijcai.2021/77},
}
TY - CPAPER TI - Bias Silhouette Analysis: Towards Assessing the Quality of Bias Metrics for Word Embedding Models AU - Spliethöver, Maximilian AU - Wachsmuth, Henning T2 - Proceedings of the Thirtieth International Joint Conference on Artificial Intelligence, IJCAI-21 PB - International Joint Conferences on Artificial Intelligence Organization PY - 2021 SP - 552 EP - 559 DO - 10.24963/ijcai.2021/77 UR - https://doi.org/10.24963/ijcai.2021/77 ER -Copied
Machine-readable versions of this paper, for tools and AI agents:





