
SatFormer: Saliency-Guided Abnormality-Aware Transformer for Retinal Disease Classification in Fundus Image
Proceedings of the Thirty-First International Joint Conference on Artificial Intelligence. Main Track. Pages 987-994.
https://doi.org/10.24963/ijcai.2022/138
Keywords
- Machine Learning: Convolutional Networks
- Computer Vision: Biomedical Image Analysis
- Machine Learning: Classification
- Machine Learning: Attention Models
- Multidisciplinary Topics and Applications: Bioinformatics
Abstract
Automatic and accurate retinal disease diagnosis is critical to guide proper therapy and prevent potential vision loss. Previous works simply exploit the most discriminative features while ignoring the pathological visual clues of scattered subtle lesions. Therefore, without a comprehensive understanding of features from different lesion regions, they are vulnerable to noise from complex backgrounds and suffer from misclassification failures. In this paper, we address these limitations with a novel saliency-guided abnormality-aware transformer which explicitly captures the correlation between different lesion features from a global perspective with enhanced pathological semantics. The model has several merits. First, we propose a saliency enhancement module (SEM) which adaptively integrates disease related semantics and highlights potentially salient lesion regions. Second, to the best of our knowledge, this is the first work to explore comprehensive lesion feature dependencies via a tailored efficient self-attention. Third, with the saliency enhancement module and abnormality-aware attention, we propose a new variant of Vision Transformer models, called SatFormer, which outperforms the state-of-the-art methods on two public retinal disease classification benchmarks. Ablation study shows that the proposed components can be easily embedded into any Vision Transformers via a plug-and-play manner and effectively boost the performance.
- [Bi et al., 2021] Qi Bi, Shuang Yu, Wei Ji, Cheng Bian, Li- jun Gong, Hanruo Liu, Kai Ma, and Yefeng Zheng. Local- global dual perception based deep multiple instance learn- ing for retinal disease classification. In MICCAI, pages 55-64. Springer, 2021.
- [Bourne et al., 2017] Rupert RA Bourne, Seth R Flaxman, Tasanee Braithwaite, et al. Magnitude, temporal trends, and projections of the global prevalence of blindness and distance and near vision impairment: a systematic review and meta-analysis. The Lancet Global Health, 5(9):e888- e897, 2017.
- [Chu et al., 2021] Xiangxiang Chu, Zhi Tian, Yuqing Wang, Bo Zhang, Haibing Ren, Xiaolin Wei, Huaxia Xia, and Chunhua Shen. Twins: Revisiting the design of spatial attention in vision transformers. Advances in Neural In- formation Processing Systems, 34, 2021.
- [Cuadros and Bresnick, 2009] Jorge Cuadros and George Bresnick. Eyepacs: an adaptable telemedicine system for diabetic retinopathy screening. Journal of diabetes science and technology, 3(3):509-516, 2009.
- [Dosovitskiy et al., 2020] Alexey Dosovitskiy, Lucas Beyer, Alexander Kolesnikov, Dirk Weissenborn, Xiaohua Zhai, Thomas Unterthiner, Mostafa Dehghani, Matthias Min- derer, Georg Heigold, Sylvain Gelly, et al. An image is worth 16x16 words: Transformers for image recognition at scale. arXiv preprint arXiv:2010.11929, 2020.
- [Han et al., 2021] Dongyoon Han, Sangdoo Yun, Byeongho Heo, and YoungJoon Yoo. Rethinking channel dimensions for efficient model design. In ICCV, pages 732-741, 2021.
- [Li et al., 2019] Xiaomeng Li, Xiaowei Hu, Lequan Yu, Lei Zhu, Chi-Wing Fu, and Pheng-Ann Heng. Canet: cross- disease attention network for joint diabetic retinopathy and diabetic macular edema grading. IEEE transactions on medical imaging, 39(5):1483-1493, 2019.
- [Li et al., 2021] Yawei Li, Kai Zhang, Jiezhang Cao, Radu Timofte, and Luc Van Gool. Localvit: Bringing locality to vision transformers. arXiv preprint arXiv:2104.05707, 2021.
- [Lin et al., 2018] Zhiwen Lin, Ruoqian Guo, Yanjie Wang, Bian Wu, Tingting Chen, Wenzhe Wang, Danny Z Chen, and Jian Wu. A framework for identifying diabetic retinopathy based on anti-noise detection and attention- based fusion. In MICCAI, pages 74-82. Springer, 2018.
- [Liu et al., 2021] Ze Liu, Yutong Lin, Yue Cao, Han Hu, Yixuan Wei, Zheng Zhang, Stephen Lin, and Baining Guo. Swin transformer: Hierarchical vision transformer using shifted windows. In ICCV, pages 10012-10022, 2021.
- [Pachade et al., 2021] Samiksha Pachade, Prasanna Porwal, et al. Retinal fundus multi-disease image dataset (rfmid): A dataset for multi-disease detection research. Data, 6(2):14, 2021.
- [Phene et al., 2019] Sonia Phene, R Carter Dunn, Naama Hammel, Yun Liu, Jonathan Krause, Naho Kitade, Mike Schaekermann, Rory Sayres, Derek J Wu, Ashish Bora, et al. Deep learning and glaucoma specialists: the rel- ative importance of optic disc features to predict glau- coma referral in fundus photographs. Ophthalmology, 126(12):1627-1639, 2019.
- [Sun et al., 2021] Rui Sun, Yihao Li, Tianzhu Zhang, Zhen- dong Mao, Feng Wu, and Yongdong Zhang. Lesion-aware transformers for diabetic retinopathy grading. In CVPR, pages 10938-10947, 2021.
- [Tan and Le, 2019] Mingxing Tan and Quoc Le. Efficient- net: Rethinking model scaling for convolutional neural networks. In ICML, pages 6105-6114. PMLR, 2019.
- [Vaswani et al., 2017] Ashish Vaswani, Noam Shazeer, Niki Parmar, Jakob Uszkoreit, Llion Jones, Aidan N Gomez, Łukasz Kaiser, and Illia Polosukhin. Attention is all you need. In NIPS, pages 5998-6008, 2017.
- [Wang et al., 2017] Zhe Wang, Yanxin Yin, Jianping Shi, Wei Fang, Hongsheng Li, and Xiaogang Wang. Zoom- in-net: Deep mining lesions for diabetic retinopathy de- tection. In MICCAI, pages 267-275. Springer, 2017.
- [Wang et al., 2018] Xiaolong Wang, Ross Girshick, Abhinav Gupta, and Kaiming He. Non-local neural networks. In CVPR, pages 7794-7803, 2018.
- [Wang et al., 2021a] Wenhai Wang, Enze Xie, Xiang Li, Deng-Ping Fan, Kaitao Song, Ding Liang, Tong Lu, Ping Luo, and Ling Shao. Pyramid vision transformer: A ver- satile backbone for dense prediction without convolutions. In ICCV, pages 568-578, 2021.
- [Wang et al., 2021b] Wenxiao Wang, Lu Yao, Long Chen, Binbin Lin, Deng Cai, Xiaofei He, and Wei Liu. Cross- former: A versatile vision transformer hinging on cross- scale attention. arXiv preprint arXiv:2108.00154, 2021.
- [Wang et al., 2022] Wenhai Wang, Enze Xie, Xiang Li, Deng-Ping Fan, Kaitao Song, Ding Liang, Tong Lu, Ping Luo, and Ling Shao. Pvt v2: Improved baselines with pyramid vision transformer. Computational Visual Media, pages 1-10, 2022.
- [Woo et al., 2018] Sanghyun Woo, Jongchan Park, Joon- Young Lee, and In So Kweon. Cbam: Convolutional block attention module. In ECCV, pages 3-19, 2018.
- [Wu et al., 2021a] Haiping Wu, Bin Xiao, Noel Codella, Mengchen Liu, Xiyang Dai, Lu Yuan, and Lei Zhang. Cvt: Introducing convolutions to vision transformers. In ICCV, pages 22-31, 2021.
- [Wu et al., 2021b] Yu-Huan Wu, Yun Liu, Xin Zhan, and Ming-Ming Cheng. P2t: Pyramid pooling transformer for scene understanding. arXiv preprint arXiv:2106.12011, 2021.
- [Xu et al., 2021] Weijian Xu, Yifan Xu, Tyler Chang, and Zhuowen Tu. Co-scale conv-attentional image transform- ers. In ICCV, pages 9981-9990, 2021.
- [Yu et al., 2021] Shuang Yu, Kai Ma, Qi Bi, Cheng Bian, Munan Ning, Nanjun He, Yuexiang Li, Hanruo Liu, and Yefeng Zheng. Mil-vt: Multiple instance learning en- hanced vision transformer for fundus image classification. In MICCAI, pages 45-54. Springer, 2021.
References were extracted automatically from the PDF and may contain errors.
Full text extracted automatically from the PDF; figures, tables and equations may differ. The PDF is the version of record.
1 Introduction
Retinal diseases are the leading cause of vision impairment and irreversible blindness. Several typical retinal diseases, such as diabetic retinopathy (DR), glaucoma, agerelated macular degeneration (AMD) and retinal vein occlusion (RVO), are becoming common in the working-age population worldwide [Bourne et al., 2017]. Early screening and timely proper therapy is crucial to prevent disease progression and potential vision loss. In clinical routines, ophthalmologists identify retinal diseases in fundus images based on the type and number of associated lesion symptoms, such as microaneurysms, haemorrhages, soft exudates and hard exudates [Li et al., 2019; Sun et al., 2021]. However, these pathological abnormal regions in fundus images are usually small in size and scattered over the entire retina, which makes the diagnosis difficult. Therefore, there is a strong demand for fully automatic and accurate retinal disease recognition in fundus images.
∗The corresponding author.
Convolutional neural networks (CNNs) based methods have achieved significant success in retinal disease diagnosis tasks [Wang et al., 2017; Bi et al., 2021]. However, the repeated combination of pooling and down-sampling layers in CNN models inherently results in the loss of detailed information of subtle lesions, which limits the representation of diagnostic features in scattered small pathological regions. In the ophthalmology field, the occurred lesions always determine the diagnostic results of the specific diseases. Therefore, the relatively weak ability of CNNs to retain finegrained lesion semantics may impose more difficulties for discovering diagnostic visual clues related to early symptoms.
To alleviate this limitation, several recent methods [Li et al., 2019; Sun et al., 2021] resort to adopt attention mechanisms or even transformers to explore long-range dependencies and keep more detailed information. But most of them still adopt convnets as main bodies and treat transformers as assisted modules to help encode global context into convolutional representations. As a result, these models still prefer large continuous areas and are difficult to extract multiple diversified discriminative small parts. In order to fully utilize the inherent encoding capabilities of transformers, Yu et al. [2021] explore the applicability of Vision Transformer for the retinal disease classification task. However, this method takes all individual patches into consideration without highlighting semantics of small lesions, which results in a strong bias on the most salient lesion regions while ignoring trivial detail information contained in the subtle phenotypes. Unfortunately, such characteristic may impair the performance of retinal diseases recognition. More specifically, the challenge that limits the adoption of a computer-aided diagnosis tool by the ophthalmologist is, some disease related subtle pathologies such as microaneurysms and exudates are usually ignored. Thus, it is vital to enhance the feature representation of small lesions and gain a comprehensive understanding of features from diverse lesion regions for retinal diseases recognition.
Based on the above discussions, the limitations of existing methods motivate us to design specific architectures to tackle the above challenges. The main contributions of this paper are summarized as follows.
- We are the first to explore an efficient Vision Transformer which adaptively exploits diverse lesion features from a global perspective with enhanced pathological semantics for retinal disease classification, where a comprehensive understanding of different lesions is particularly important.
- We design a saliency enhancement module to mine discriminative lesion semantics and enhance the feature representation of small lesion regions.
- We propose an abnormality-aware attention which explicitly facilitates the dependencies between different lesion regions to drive the model to distinguish the main abnormal regions as well as the small subtle lesions such as microaneurysms and exudates with remarkably reduced computation complexity.
We conduct comprehensive experiments to demonstrate the effectiveness of each proposed components. Our method significantly outperforms prior state-of-the-art methods on multiple datasets.
2 RelatedWorks
In this section, we give a brief review of retinal disease assessment based on CNNs and Vision Transformers.
CNN-based methods. In the past decade, convolutional neural networks serve as the main design paradigm for retinal disease screening tasks. For instance, Lin et al. [2018] and Li et al. [2019] utilized CNN architectures for DR grading. Phene et al. [2019] developed methods based on CNNs for glaucoma diagnosis. Though these methods have made some progress, they are still limited by insufficient representation for the tiny and subtle lesion regions in deep layers due to severe loss of spatial details caused by down-sampling operations (pooling). As a result, these methods ignore trivial lesion information. Moreover, CNN-based models inherently lack the ability to explicitly capture long-range feature dependencies between different abnormal symptoms in a global scope, which would impair the performance of disease diagnosis.
Transformer-based methods. ViT [Dosovitskiy et al., 2020] first proves that a pure transformer can achieve stateof-the-art performance in image classification with sufficient training data. For retinal disease classification, Yu et al. [2021] introduce a multiple instance learning head on ViT to fully exploit the features extracted from individual patches. However, this method directly utilizes ViT without explicitly exploiting the complex dependencies among diverse lesions. Different from natural images, the diagnostic features in a fundus image, usually only occupy a small part of the whole image. Thus modeling long-range dependencies across all patches is inefficient and results in less discriminative feature representations for subtle lesion regions. LAT [Sun et al., 2021] alleviates this limitation by introducing an encoderdecoder transformer framework to learn lesion-aware filters for DR grading. Nonetheless, this method still employs convnets as main feature extractors, on top of which a transformer is further applied to exploit pixel relation. Since spatial information and fine-grained details may have been lost in deep convolution layers due to down-sampling, the advantages of a transformer is not fully exploited. So far, how to exploit pathological features of retinal diseases distributed at different positions and build an optimal network structure still remains an open question.
3 Methodology
The architecture of SatFormer is illustrated in Figure 1. Similar to [Liu et al., 2021; Wang et al., 2021b], SatFormer also produces a hierarchical representation, which has four stages. Each stage consists of a saliency enhancement module (SEM) and Li sequential SatFormer blocks. A SEM gradually aggregates lesion pixels and highlights potentially salient lesion regions to generate expressive multi-scale embeddings. Then, several SatFormer blocks, each of which involves abnormality-aware attention, are set up after SEM. The image classification is performed by applying a global average pooling layer on the output feature maps of the last stage, followed by a linear classifier.
3.1 Saliency Enhancement Module
For retinal diseases, it is challenging to distinguish the scattered subtle lesion regions since pure transformer architectures lack the inductive bias, such as locality and translation equivariance. Moreover, the coarse splitting of patches limits the ability to model details within each patch [Xu et al., 2021]. Such deteriorated local details compromise the discovery of inconspicuous lesion information. Some recent methods [Li et al., 2021; Wu et al., 2021a] incorporate with convolution operations to bring locality to Vision Transformers. However, without highlighting potentially salient regions from a global perspective, these hybrid models tend to be biased towards the most discriminative lesion regions, while ignoring the diversity of lesion information. Unfortunately, the trivial or less discriminative lesion regions contained in a fundus image may be important for disease recognition.
To overcome the above limitations, we propose a saliency enhancement module (SEM) to mine more explicit lesion semantics and enhance feature activations corresponding to scattered small abnormal regions at each stage. In this process, SEM reduces the number of embeddings and increases their dimensions. The generated feature maps have H 2i+1 × W 2i+1 patch tokens for the ith stage.
Locality Enhanced Multi-Scale Embedding. Figure 2 illustrates how the SEM generates patch embeddings in Stage 1. We first use four convolution kernels with different sizes to sample patches in an input image. Considering that lesion regions usually exhibit significant variations in shape, size, and structure, distinguishing these abnormalities from a variety of different scales helps to enhance the ability for mining the discriminative visual clues related to each lesion. We keep the stride (4×4) of four kernels the same to make sure they generate the same number of embeddings. Then the four patches will be projected and concatenated as one embedding.
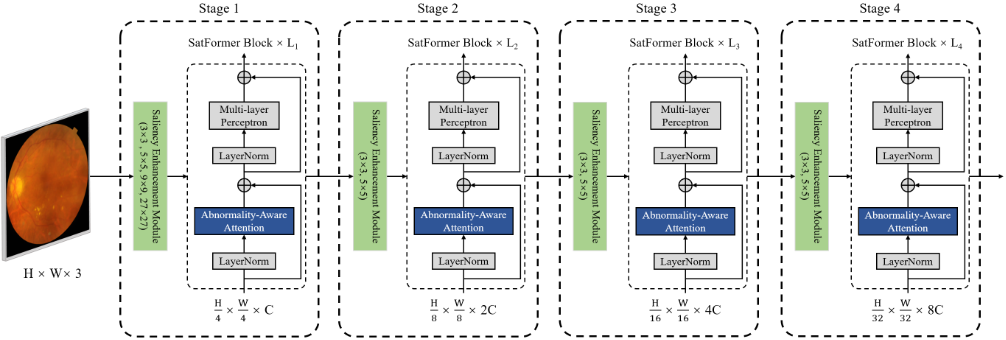
To control the total computational budget, we use a lower dimension d for large kernels and successively doubles it for small kernels. This scheme saves a lot of computational cost without significant performance drop. In Stage 2 - 4, the strides are set as 2×2 while kernels are set as 3×3 and 5×5. Since each token embedding already learns information from regions of different scales, our strategy empowers the model with enriched multi-scale local context modeling capabilities.
Spatial Saliency Enhancement. After the embedding process, SEM performs the following procedures. First, given patch embeddings Xp e ∈ RHi×Wi×Ci , a 1 × 1 convolution is conducted to expand the embeddings to a higher dimension of Xd e ∈ RHi×Wi×(2×α×Ci) , where α is the expand ratio, Hi, Wi and Ci denote the height, width and channel dimensions of the input in stage i, respectively. A key ingredient in SEM is the spatial perception layer which adaptively enhances the response of lesions and suppresses cluttered background features. Specifically, we split Xd e into two independent parts (Xd1 e ,Xd2 e ) along the channel dimension. A spatial saliency distribution map S ∈ RHi×Wi×(α×Ci) is generated through feeding Xd2 e to a depthwise convolution layer followed by one GELU and Softmax. In experiments, we found that adding GELU before Softmax, especially in shallow layers, helps stabilize the training process. Our purpose is to generate a spatial weight distribution matrix to highlight the potential salient regions and suppress noisy backgrounds. Therefore, the Softmax normalizes the feature maps along the spatial dimension. For each small lesion, its feature activation on the spatial saliency distribution map S is expected to be higher than that of its surrounding backgrounds. Guided by S, the model learns the context of pathological semantics from a global perspective and highlights potentially salient lesion regions on the entire feature map scale. Furthermore, Xd1 e and S are combined by element-wise multiplication, generating Xs e ∈ RHi×Wi×(α×Ci) , which encodes salient semantics of abnormalities scattered over the entire retina. This procedure can be noted as:
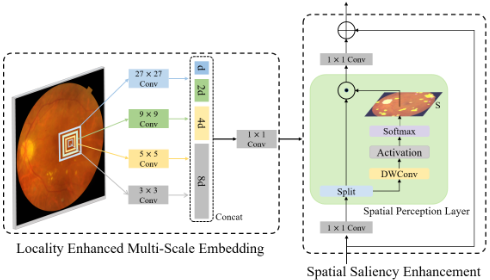
Finally, we project Xs e to the initial dimension and then add the output with Xp e through a residual connection to obtain the output patch embeddings Xo e ∈ RHi×Wi×Ci . A LayerNorm (LN) layer and a GELU is applied following each linear projection and convolution. In this way, SEM empowers the model with enriched feature representations for small lesions and captures diverse pathological semantics.
3.2 Abnormality-Aware AttentionMechanism
Self-attention [Vaswani et al., 2017] has advantages in capturing long-range dependencies, but it incurs huge memory and computation costs. Some methods, e.g., PVT [Wang et al., 2021a], PVTv2 [Wang et al., 2022] and P2T [Wu et al., 2021b] adopt spatial-reduction (pooling operation) to downsample the feature maps when computing keys and values in the multi-head self-attention (MHSA). With the pooled features, they reduce the number of tokens but at the cost of losing fine-grained details. Other methods [Liu et al., 2021; Wang et al., 2021b] resort to computing self-attention within dilated partitions of feature maps but sacrifice the direct global relationship modeling.
Though the aforementioned methods have made some progress, they still suffer from two drawbacks. (1) They fail to adaptively perceive and group specific tokens that contain the discriminative features. (2) They lose the global receptive field and fail to gather complementary information from the less discriminative groups of tokens. As a result, they sacrifice accuracy as a trade-off with efficiency. Moreover, models without comprehensive information on diverse scattered lesions and the dependencies between different pathological features tend to be biased on the most salient lesion but ignore the less discriminating lesions that may be important for diagnosis.
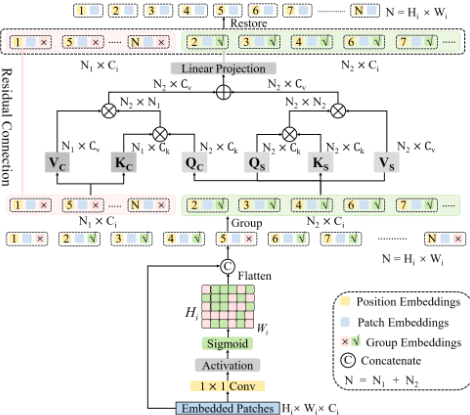
Motivated by the above limitations, we propose a novel abnormality-aware attention mechanism. Specifically, apart from the position embedding, we attach an additional group embedding to each patch token. This group embedding indicates whether the corresponding token encodes useful lesion semantics. Generating group embeddings from a global view is straightforward. As shown in Figure 3, the patch embeddings Xo e ∈ RHi×Wi×Ci from SEM are fed into a 1 × 1 convolutional layer with single channel output. In this way, a token relative importance matrix D is generated via:
where θ and b represent the weights and bias of the convolutional layer, respectively. Dn,m helps to describe the probability that the patch at row n and column m contains lesion information or pathological semantics associated with abnormalities. The group embeddings G are obtained by setting an threshold ε for D. For each patch, if its corresponding Dn.m ≤ ε, then this patch will be assigned to the background group, otherwise it will be assigned to the lesion group. In this way, G enables the model to adaptively perceive and group specific patch tokens that contain the discriminative features.
Instead of focusing on all input tokens, we propose to compute self-attention within the lesion group for efficient modeling. However, the patches in the background group may contain important complementary information that contributes to a thorough understanding of lesions and their surroundings. Thus we propose to add an extra cross-group attention to enable cross-group information exchange. As shown in Figure 3, we flatten all input patch tokens and compute selfattention within the lesion group. In the lesion group, patch tokens Xl ∈ RN2×Ci are linearly transformed to three parts, i.e., queries Qs ∈ RN2×Ck , keys Ks ∈ RN2×Ck and values Vs ∈ RN2×Cv where N2 is the sequence length of the lesion group, C, Ck, Cv are the dimensions of inputs, queries (keys) and values, respectively. The scaled dot-product attention is applied via:
As for the cross-group attention, the queries Qc ∈ RN2×Ck come from the lesion group while keys Kc ∈ RN1×Ck and values Vc ∈ RN1×Cv come from the background group. This allows each patch in the lesion group to focus on the features of all patches Xb ∈ RN1×Ci in the background group to gather complementary information that is highly relevant to lesion diagnosis. The cross-group attention is applied via:
We then add the results of the two applied attention through an element-wise sum operation and employ a linear layer to produce the output ˆXl ∈ RN2×Ci of the lesion group. Finally, patches in the background group are concatenated with ˆXl through a residual connection. We remove the group embeddings and restore the order of the patches according to their original positions. Once we obtain the output of the abnormality-aware attention module, we send it to the MLP block for proceeding computation as usual. At the end of each stage, we restore patch tokens to "images" in the spatial dimension based on the original positions. The computational cost of the abnormality-aware attention is reduced from O(N 2 ) to O(N 2 2 + N1N2), and N2 ≪ N in most cases. Multi-head version of abnormality-aware attention can be easily derived. Just as MHSA, we split the queries, keys and values to h parts and perform the abnormality-aware attention mechanism in parallel. Then we concatenate the output values of each head and linearly project them to form the final output.
Notably, each abnormality-aware attention module computes its own group embeddings. This gives the model an opportunity to rethink how to group and make full use of patches containing lesion semantics to gather as much information as possible. The learning process of group embeddings also benefits from SEM. SEM highlights potentially salient regions of small lesions and provides sufficient context to help the model perceive diverse lesions, which makes it easier and more meaningful to predict whether a patch contains pathological semantics.
Our abnormality-aware attention introduces the inductive bias that the spatial interactions should be dynamically parameterized based on the pathological semantics and the correlations between different lesion features. This characteristic is conducive to the diagnosis of diseases, especially for retinal diseases, where pathological regions are often small and scattered in distribution.
4 Experiments
4.1 Dataset and Implementation
We conduct experiments on a large dataset of fundus images collected from a regional hospital and two public benchmarks including EyePACS [Cuadros and Bresnick, 2009] and RFMiD [Pachade et al., 2021]. The collected dataset contains 28, 360 DR images, 5, 816 glaucoma images, 4, 805 AMD images, 25, 748 RVO images and 35, 369 normal images. We randomly split 70% of the dataset for training, 10% for validation and the rest 20% for testing. We adopt the ten-fold cross-validation method on our dataset. EyePACS [Cuadros and Bresnick, 2009] contains 35, 126 training, 10, 906 validation and 42, 670 testing DR images. Each image is divided into one of five DR grades. Retinal Fundus Multidisease Image Dataset (RFMiD) [Pachade et al., 2021] contains 1, 920 training, 640 validation and 640 testing images, which screens retinal images into normal and abnormal (comprising of 45 different types of diseases) categories.
All experiments are performed on 8 V100 GPUs. We employ an AdamW optimizer for 500 epochs using a cosine decay learning rate scheduler and 20 epochs of linear warm-up. A mini-batch size of 128, an initial learning rate of 0.001, and a weight decay of 0.05 are used. We use gradient clipping with a max norm of 1.0 to stabilize the training process. Augmentations such as rotation, scaling, gaussian blur, color jitting and mirroring are utilized during the training process.
For the collected dataset and EyePACS, as multi-class classification problems, we utilize evaluation metrics of accuracy, area under the curve (AUC), weighted F1 and weighted Kappa following [Yu et al., 2021; Sun et al., 2021].
For RFMiD, which contains only two classes of either disease or normal, the AUC, accuracy and F1 metric are used.
For fair comparison, we reap the benefit of pre-trained weights of MLP layers and QKV attention on ImageNet pre-training. Concretely, we align channel numbers of SatFormer blocks to those of pre-trained models so that we load the weights of MLP layers and QKV attention. In each abnormality-aware attention layer, we reuse the pretrained weights of QsKsVs to initialize QcKcVc. Similar to ViT [Dosovitskiy et al., 2020] and Swin [Liu et al., 2021], we build two architecture variants. The hyper-parameters of these model variants are:
- SatFormer-S: C = 96, block numbers = {2, 2, 8, 2}, H = {3, 6, 12, 12}, d = {16, 64, 128, 256}, ε = 0.5, α = {2, 2, 1, 1}
- SatFormer-B: C = 128, block numbers = {2, 2, 18, 2}, H = {3, 6, 12, 24}, d = {16, 64, 128, 256}, ε = 0.5, α = {2, 2, 1, 1}
where C and H mean embedding dimensions and the number of heads in the multi-head self-attention, respectively. d and α are the kernel dimension and expansion ratio in the SEM, respectively. ε is the threshold for grouping. -S and -B for small and base, respectively.
4.2 Comparisons with State-of-the-art Methods
We compare our method with the state-of-the-arts including representative CNN-based models, transformer-based models and hybrid architectures. The results are shown in Table 1. SatFormer noticeably surpasses the other state-of-theart structures.
Compared against strong Transformer based baselines ViTL/16, PVTv2-B5, P2T-Large, Swin-L, and Twins-SVT-L, SatFormer-B outperforms them at least absolute 2.3% in the weighted Kappa on EyePACS, and 4.2% in F1 on RFMiD. Further, even our SatFormer-S achieves at least 2% improvement of F1 relative to these large models with significantly lower paramerters. Notably, as for RFMiD dataset, the AUC and F1 score of SatFormer-B surpass that of MIL-VT, which is pre-trained on a large fundus dataset, with much lower FLOPs (65.0G vs. 200.0G). This success has been attributed to the proposed abnormality-aware attention module, in which the weights are dynamically computed based on the similarity or affinity between every pair of tokens in the lesion group. As a consequence, the captured global dependencies are potentially more efficient and discriminative than interactions built on all patch tokens.
Compared with the state-of-the-art ConvNets, i.e., EfficientNet and ReXNet, the SatFormer-B achieves at least absolute 1.8% improvement of Kappa on EyePACS and 2.5% improvement of F1 on RFMiD. Moreover, our smallest model SatFormer-S with 27M parameters and 22.5G FLOPs surpasses the CANet by 3.1% of Kappa on EyePACS and 4.5% of F1 score on RFMiD, while CANet has 3 times the FLOPs of SatFormer-S. This effectiveness can be explained that our approach is capable of both perceiving locally low contrast small-sized lesions and capturing dependencies between scattered pathologies globally, while CNN-based models suffer from spatial detail loss and lack the ability to model interactions between lesion features.
Compared to other hybrid models, SatFormer significantly outperforms the other SOTAmodels for all the three datasets. SatFormer-S achieves better performance compared with CvT-21 and CrossFormer-L with fewer parameters and similar FLOPs. Our SatFormer-B surpasses other hybrid architectures by a large margin in terms of all evaluation metrics with acceptable parameters and FLOPs. Different from previous hybrid models, which either simply treat transformers as assisted modules or compute self-attention within dilated partitions of feature maps, our SatFormer adaptively perceives and groups specific tokens to explicitly model the correlation between different lesions, resulting in a more comprehensive understanding of pathological clues.
| Method Type | Network | Image Size | #param. (M) | FLOPs (G) | Collected Dataset | EyePACS | RFMiD | ||||||||
|---|---|---|---|---|---|---|---|---|---|---|---|---|---|---|---|
| Accuracy | AUC | F1-score | Kappa | Accuracy | AUC | F1-score | Kappa | Accuracy | AUC | F1-score | |||||
| AFN [Lin et al., 2018] | 224×224 | - | - | - | - | - | - | - | - | - | 85.9 | - | - | - | |
| CANet (ResNet50) [Li et al., 2019] | 224×224 | 29 | 66.0 | 78.5 | 88.1 | 77.1 | 84.3 | 81.2 | 90.5 | 79.3 | 86.3 | 88.3 | 91.0 | 90.4 | |
| Convolutional Networks EffNet-B7 [Tan and Le, 2019] | 600×600 | 66 | 37.0 | 81.1 | 90.3 | 80.4 | 85.8 | 80.4 | 89.8 | 78.7 | 86.0 | 88.2 | 91.0 | 90.7 | |
| ReXNet (×3.0) [Han et al., 2021] | 224×224 | 34 | 44.5 | 85.1 | 95.7 | 83.5 | 89.2 | 86.1 | 95.7 | 86.2 | 89.0 | 91.3 | 94.5 | 93.3 | |
| ViT-B/16 [Dosovitskiy et al., 2020] | 384×384 | 86 | 55.5 | 82.3 | 91.5 | 80.1 | 86.3 | 83.5 | 94.1 | 82.2 | 87.7 | 87.1 | 92.4 | 90.3 | |
| ViT-L/16 [Dosovitskiy et al., 2020] | 384×384 | 307 | 190.7 | 83.0 | 91.5 | 80.9 | 86.7 | 84.1 | 94.2 | 83.0 | 87.9 | 86.4 | 91.5 | 90.1 | |
| Swin-B [Liu et al., 2021] | 384×384 | 88 | 47.0 | 83.1 | 92.2 | 81.5 | 87.4 | 84.6 | 95.6 | 83.5 | 88.2 | 88.3 | 93.2 | 91.1 | |
| Swin-L [Liu et al., 2021] | 384×384 | 197 | 103.9 | 83.9 | 92.8 | 82.3 | 88.2 | 85.0 | 96.0 | 84.0 | 88.5 | 89.5 | 93.8 | 91.6 | |
| Pure Transformers Twins-SVT-B [Chu et al., 2021] | 224×224 | 56 | 8.6 | 82.1 | 92.5 | 82.0 | 87.9 | 84.5 | 93.9 | 82.8 | 86.4 | 86.3 | 91.7 | 89.4 | |
| Twins-SVT-L [Chu et al., 2021] | 224×224 | 99 | 16.0 | 84.1 | 93.1 | 82.4 | 88.4 | 84.7 | 94.1 | 83.0 | 86.5 | 86.5 | 92.0 | 90.3 | |
| PVTv2-B5 [Wang et al., 2022] | 224×224 | 45 | 6.9 | 81.9 | 90.7 | 80.0 | 86.1 | 82.4 | 93.4 | 81.3 | 85.9 | 90.1 | 92.4 | 90.9 | |
| P2T-Large [Wu et al., 2021b] | 224×224 | 55 | 9.8 | 83.5 | 92.4 | 81.7 | 87.5 | 84.8 | 95.7 | 83.6 | 88.3 | 88.7 | 93.4 | 91.2 | |
| MIL-VT [Yu et al., 2021] | 384×384 | 98 | 200.0 | 83.0 | 91.0 | 80.6 | 86.7 | 84.2 | 94.7 | 83.3 | 87.8 | 91.1 | 95.9 | 94.4 | |
| LAT [Sun et al., 2021] | 512×512 | - | - | - | - | - | - | - | - | - | 88.4 | - | - | - | |
| LocalViT-PVT [Li et al., 2021] | 224×224 | 14 | 4.8 | 83.1 | 91.6 | 80.9 | 86.9 | 84.2 | 94.1 | 83.4 | 87.8 | 90.4 | 92.5 | 91.7 | |
| CrossFormer-L [Wang et al., 2021b] | 224×224 | 92 | 16.1 | 83.8 | 93.0 | 82.4 | 88.3 | 84.0 | 93.7 | 83.2 | 87.5 | 90.6 | 94.3 | 92.0 | |
| Hybrid Architectures CvT-21 [Wu et al., 2021a] | 224×224 | 32 | 25.0 | 83.3 | 91.6 | 81.2 | 87.5 | 82.2 | 90.7 | 80.1 | 86.7 | 87.5 | 91.8 | 90.6 | |
| Ours: SatFormer-S | 224×224 | 27 | 22.5 | 85.2 | 96.2 | 83.8 | 89.4 | 86.7 | 96.2 | 86.0 | 89.4 | 92.2 | 95.4 | 94.9 | |
| Ours: SatFormer-B | 224×224 | 78 | 65.0 | 87.4 | 97.4 | 86.0 | 92.2 | 88.9 | 97.7 | 87.5 | 90.8 | 93.8 | 96.5 | 95.8 | |
| Model | #param. (M) | FLOPs (G) | EyePACS Kappa | RFMiD F1-score |
|---|---|---|---|---|
| Swin-B (w/. vs. w/o.) | 104 vs. 88 | 62.6 vs. 47.0 | 88.7 vs. 88.2 | 92.7 vs. 91.1 |
| Swin-L (w/. vs. w/o.) | 223 vs. 197 | 131.2 vs. 103.9 | 88.9 vs. 88.5 | 93.3 vs. 91.6 |
| CrossFormer-L (w/. vs. w/o.) | 118 vs. 92 | 37.4 vs. 16.1 | 88.1 vs. 87.5 | 93.1 vs. 92.0 |
| SatFormer-S (w/. vs. w/o.) | 27 vs. 25 | 22.5 vs. 19.1 | 89.4 vs. 88.8 | 94.9 vs. 93.7 |
| SatFormer-B (w/. vs. w/o.) | 78 vs. 62 | 65.0 vs. 49.4 | 90.8 vs. 90.3 | 95.8 vs. 94.5 |
4.3 Ablation Study
Effectiveness of the Saliency Enhancement Module. Table 2 shows the ablation study on the effectiveness of the SEM. All models achieve more than 1.0% absolute performance gain on the RFMiD dataset by adopting our SEM. This shows applying our SEM yields significant improvements on various architectures without too much additional computational cost. Moreover, we compare the spatial perception layer in SEM with several other close alternatives which also compute a spatial weight distribution matrix. The results in Table 3 show that our spatial perception layer works better than Non-local and CBAM. In practice, Non-local needs to compute a matrix quadratic over the HW while our spatial saliency distribution map is linear over the input squence length. CBAM adopts average pooling to compute spatial weight matrix, which may lose important clues about distinctive object features. These experiments verify the effectiveness of our SEM and show that it generalizes well to various transformer architectures.
Significance of the Abnormality-Aware Attention. Table 4 shows the ablation study on the effectiveness of the abnormality-aware attention. Several self-attention mechanisms used in PVT, Swin, Twins and CrossFormer are compared. Our SatFormer-B outperforms them at least absolute 1.7% Kappa on the EyePACS dataset and achieves at least absolute 2.8% performance gain on the RFMiD dataset. Moreover, Table 2 shows that even without SEM, our SatFormer-B (w/o.) still outperforms other Vison Transformers. This indicates applying our abnormality-aware attention in other Vison Transformers (like Swin-B or Swin-L) also benefits the overall performance. In particular, PVT adopts spatial-reduction to reduce the sequence length and thus sacrifices the finegrained features, while Swin restricts the self-attention in a local window, sacrificing the long-distance attention. Twins and CrossFormer compute self-attention within dilated partitions of feature maps, but do not adaptively group specific tokens to explicitly capture long-range feature dependencies between lesion regions. Compared with simply splitting the feature map into multiple windows in which tokens share the same surroundings, our adaptive patch grouping strategy prevents tremendous background information from overwhelming the subtle visual clues related to pathological abnormalities. In this way, high-level semantic information from different pathological regions are combined to form a comprehensive lesion feature understanding. The results show that our abnormality-aware attention is most conducive to improving the performance.
| Model | Non-local [Wang et al., 2018] | CBAM [Woo et al., 2018] | Spatial Perception Layer | EyePACS Kappa | RFMiD F1-score |
|---|---|---|---|---|---|
| SatFormer-B | ✓ | ✓ | ✓ | 89.7 90.2 90.8 | 94.7 95.1 95.8 |
Importance of the Cross-Group Attention. In Table 5, we show that it is crucial to make use of the cross-group attention, where removing it deteriorates the overall classification performance by over 1%. The underlying reason is that the cross-group information exchange helps the model to learn important supplementary information such as the structure of the entire retina, which is beneficial to a thorough understanding of lesions and their surroundings. Otherwise, the network will not be able to learn useful representations from the tokens in the background group.
| Model | PVT | CrossFormer | Twins | Swin | Abnormality-Aware Attention | EyePACS Kappa | RFMiD F1-score |
|---|---|---|---|---|---|---|---|
| ✓ | 86.8 | 92.1 | |||||
| ✓ | 88.3 | 93.0 | |||||
| SatFormer-B | ✓ | 87.4 | 92.5 | ||||
| ✓ | 89.1 | 92.9 | |||||
| ✓ | 90.8 | 95.8 |
| Models | Cross-Group Attention | #param.(M) | FLOPs (G) | EyePACS Kappa | RFMiD F1-score |
|---|---|---|---|---|---|
| SatFormer-S | × | 16 | 13.4 | 88.3 | 91.8 |
| ✓ | 27 | 22.5 | 89.4 | 94.9 | |
| SatFormer-B | × | 49 | 38.8 | 89.5 | 93.7 |
| ✓ | 78 | 65.0 | 90.8 | 95.8 |
4.4 Visualization of AttentionMaps
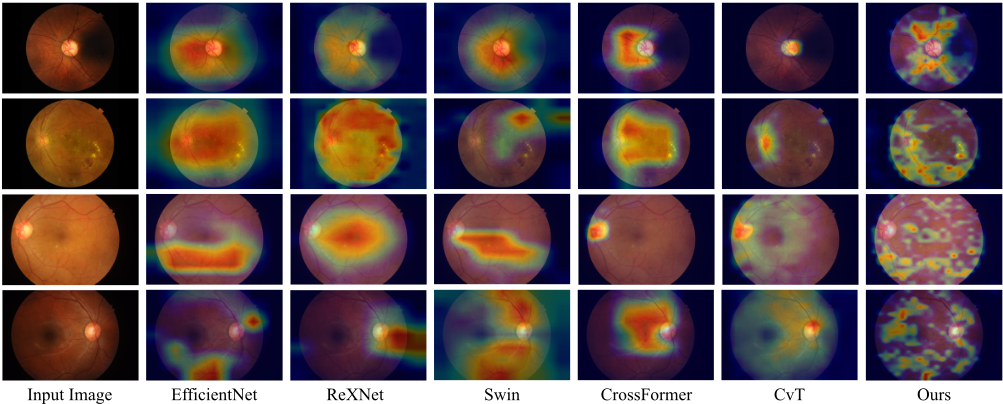
Several representative visualizations of attention maps in Figure 4 clearly indicate that the scattered pathological regions are well captured and perceived by our SatFormer. On the contrary, the existing methods show a strong bias on the most salient lesion region and ignore trivial lesion information contained in the subtle regions. Moreover, it is interesting to observe that the existing state-of-the-art Vision Transformers still have high responses in irrelevant regions (e.g., Swin and CrossFormer). This phenomenon is consistent with the underlying mechanism of their self-attention functions, which compute dependencies between patches from naive partitions of feature maps. Different from existing methods, we propose to adaptively perceive and group specific tokens containing discriminative features. Our abnormality-aware attention adaptively selects patch tokens and gather useful information to update the chosen tokens instead of all tokens. Only the visualization results of our SatFormer show a thorough comprehension of diverse subtle lesion regions. This phenomenon also reveals that the overall accuracy improvement of SatFormer compared to other models is brought about by capturing trivial or less discriminative lesion regions contained in a fundus image.
5 Conclusions and FutureWork
In this paper, we propose a saliency-guided abnormalityaware transformer for retinal disease classification, which explicitly captures long-range dependencies between scattered subtle lesions from a global perspective. Particularly, we design a saliency enhancement module to enhance the semantics of small pathological regions. Our abnormality-aware attention with an adaptive patch grouping strategy helps the model gain a comprehensive understand of diverse lesions in an efficient way. Experiments show our SatFormer significantly outperforms prior state-of-the-art methods.
SatFormer follows the hierarchical design of popular Vision Transformers (e.g., Swin Transformer and PVT) which generate multi-scale feature maps. In future research, it is worth exploring the capability of SatFormer as a generalpurpose backbone for dense prediction tasks (e.g., object detection and semantic segmentation).
Acknowledgments
This research was partially supported by the Key Research and Development Program of Zhejiang Province under Grant 2021C03032, the National Natural Science Foundation of China under Grant 61972343, and the National Major Scientific Research Instrument Development Project under Grant 81827804.
@inproceedings{ijcai2022p138,
  title     = {SatFormer: Saliency-Guided Abnormality-Aware Transformer for Retinal Disease Classification in Fundus Image},
  author    = {Jiang, Yankai and Xu, Ke and Wang, Xinyue and Li, Yuan and Cui, Hongguang and Tao, Yubo and Lin, Hai},
  booktitle = {Proceedings of the Thirty-First International Joint Conference on
               Artificial Intelligence, {IJCAI-22}},
  publisher = {International Joint Conferences on Artificial Intelligence Organization},
  editor    = {Luc De Raedt},
  pages     = {987--994},
  year      = {2022},
  month     = {7},
  note      = {Main Track},
  doi       = {10.24963/ijcai.2022/138},
  url       = {https://doi.org/10.24963/ijcai.2022/138},
}
TY - CPAPER TI - SatFormer: Saliency-Guided Abnormality-Aware Transformer for Retinal Disease Classification in Fundus Image AU - Jiang, Yankai AU - Xu, Ke AU - Wang, Xinyue AU - Li, Yuan AU - Cui, Hongguang AU - Tao, Yubo AU - Lin, Hai T2 - Proceedings of the Thirty-First International Joint Conference on Artificial Intelligence, IJCAI-22 PB - International Joint Conferences on Artificial Intelligence Organization PY - 2022 SP - 987 EP - 994 DO - 10.24963/ijcai.2022/138 UR - https://doi.org/10.24963/ijcai.2022/138 ER -Copied
Machine-readable versions of this paper, for tools and AI agents:





