
Learning Cluster Causal Diagrams: An Information-Theoretic Approach
Proceedings of the Thirty-First International Joint Conference on Artificial Intelligence. Main Track. Pages 4871-4877.
https://doi.org/10.24963/ijcai.2022/675
Keywords
- Uncertainty in AI: Bayesian Networks
- Uncertainty in AI: Graphical Models
- Uncertainty in AI: Uncertainty Representations
- Uncertainty in AI: Causality, Structural Causal Models and Causal Inference
Abstract
Many real-world phenomena arise from causal relationships among a set of variables. As a powerful tool, Bayesian Network (BN) has been successful in describing high-dimensional distributions. However, the faithfulness condition, enforced in most BN learning algorithms, is violated in the settings where multiple variables synergistically affect the outcome (i.e., with polyadic dependencies). Building upon recent development in cluster causal diagrams (C-DAGs), we initiate the formal study of learning C-DAGs from observational data to relax the faithfulness condition. We propose a new scoring function, the Clustering Information Criterion (CIC), based on information-theoretic measures that represent various complex interactions among variables. The CIC score also contains a penalization of the model complexity under the minimum description length principle. We further provide a searching strategy to learn structures of high scores. Experiments on both synthetic and real data support the effectiveness of the proposed method.
- [Anand et al., 2022] Tara V Anand, Adele H Ribeiro, Jin Tian, and Elias Bareinboim. Effect identification in cluster causal diagrams. arXiv preprint arXiv:2202.12263, 2022.
- [Battiston et al., 2020] Federico Battiston, Giulia Cencetti, Iacopo Iacopini, Vito Latora, Maxime Lucas, Alice Pata- nia, Jean-Gabriel Young, and Giovanni Petri. Networks beyond pairwise interactions: structure and dynamics. Physics Reports, 874:1-92, 2020.
- [Chen et al., 2021] Xinshi Chen, Haoran Sun, Caleb Elling- ton, Eric Xing, and Le Song. Multi-task learning of order- consistent causal graphs. Advances in Neural Information Processing Systems, 34, 2021.
- [Chow and Liu, 1968] CK Chow and CN Liu. Approx- imating discrete probability distributions with depen- dence trees. IEEE Transactions on Information Theory, 14(3):462-467, 1968.
- [Correa and Bareinboim, 2020] Juan Correa and Elias Bareinboim. A calculus for stochastic interventions: Causal effect identification and surrogate experiments. In Proceedings of AAAI, pages 10093-10100, 2020.
- [de Campos and Cozman, 2013] Cassio de Campos and Fabio Cozman. Complexity of inferences in polytree- shaped semi-qualitative probabilistic networks. In Pro- ceedings of AAAI, pages 217-223, 2013.
- [de Campos, 2006] Luis M de Campos. A scoring function for learning Bayesian networks based on mutual informa- tion and conditional independence tests. Journal of Ma- chine Learning Research, 7(10), 2006.
- [Heckerman et al., 1995] David Heckerman, Dan Geiger, and David M Chickering. Learning Bayesian networks: The combination of knowledge and statistical data. Ma- chine Learning, 20(3):197-243, 1995.
- [James et al., 2016] Ryan G James, Nix Barnett, and James P Crutchfield. Information flows? a critique of transfer en- tropies. Physical Review Letters, 116(23):238701, 2016.
- [Kalisch and Bühlman, 2007] Markus Kalisch and Peter Bühlman. Estimating high-dimensional directed acyclic graphs with the PC-algorithm. Journal of Machine Learn- ing Research, 8(3), 2007.
- [Kraskov et al., 2004] Alexander Kraskov, Harald Stögbauer, and Peter Grassberger. Estimating mutual information. Physical Review E, 69(6), 2004.
- [Liu et al., 2017] Ziwei Liu, Xiaoxiao Li, Ping Luo, Chen Change Loy, and Xiaoou Tang. Deep learning markov random field for semantic segmentation. IEEE Transactions on Pattern Analysis and Machine Intelli- gence, 40(8):1814-1828, 2017.
- [Lizier et al., 2018] Joseph T Lizier, Nils Bertschinger, Jürgen Jost, and Michael Wibral. Information decompo- sition of target effects from multi-source interactions: Per- spectives on previous, current and future work, 2018.
- [McGill, 1954] William McGill. Multivariate information transmission. Transactions of the IRE Professional Group on Information Theory, 4(4):93-111, 1954.
- [Mokhtarian et al., 2021] Ehsan Mokhtarian, Sina Akbari, Fateme Jamshidi, Jalal Etesami, and Negar Kiyavash. Learning Bayesian networks in the presence of structural side information. arXiv preprint arXiv:2112.10884, 2021.
- [Morningstar and Melko, 2018] Alan Morningstar and Roger G Melko. Deep learning the ising model near criticality. Journal of Machine Learning Research, 18:1-17, 2018.
- [Nabi et al., 2020] Razieh Nabi, Joel Pfeiffer, Murat Ali Bayir, Denis Charles, and Emre Kıcıman. Causal infer- ence in the presence of interference in sponsored search advertising. arXiv preprint arXiv:2010.07458, 2020.
- [Niu and Quinn, 2019] Xueyan Niu and Christopher J Quinn. A measure of synergy, redundancy, and unique information using information geometry. In Proceedings of ISIT, pages 3127-3131, 2019.
- [Parviainen and Kaski, 2017] Pekka Parviainen and Samuel Kaski. Learning structures of bayesian networks for vari- able groups. International Journal of Approximate Rea- soning, 88:110-127, 2017.
- [Pearl and Bareinboim, 2014] Judea Pearl and Elias Barein- boim. External validity: From do-calculus to transporta- bility across populations. Statistical Science, 29(4), 2014.
- [Pearl, 2000] Judea Pearl. Causality: Models, Reasoning and Inference. Cambridge University Press, 2000.
- [Reing et al., 2021] Kyle Reing, Greg Ver Steeg, and Aram Galstyan. Influence decompositions for neural network at- tribution. In Proceedings of AISTATS, pages 2710-2718, 2021.
- [Robins et al., 2003] James M Robins, Richard Scheines, Peter Spirtes, and Larry Wasserman. Uniform consistency in causal inference. Biometrika, 90(3):491-515, 2003.
- [Sachs et al., 2005] Karen Sachs, Omar Perez, Dana Pe'er, Douglas A Lauffenburger, and Garry P Nolan. Causal protein-signaling networks derived from multiparameter single-cell data. Science, 308(5721):523-529, 2005.
- [Saeed et al., 2020] Basil Saeed, Snigdha Panigrahi, and Caroline Uhler. Causal structure discovery from distribu- tions arising from mixtures of DAGs. In Proceedings of ICML, pages 8336-8345, 2020.
- [Schwarz, 1978] Gideon Schwarz. Estimating the dimension of a model. The Annals of Statistics, pages 461-464, 1978.
- [Spirtes et al., 2000] Peter Spirtes, Clark N Glymour, Richard Scheines, and David Heckerman. Causation, Prediction, and Search. MIT Press, 2000.
- [Tikka et al., 2021] Santtu Tikka, Jouni Helske, and Juha Karvanen. Clustering and structural robustness in causal diagrams. arXiv preprint arXiv:2111.04513, 2021.
- [Tsamardinos et al., 2006] Ioannis Tsamardinos, Laura E Brown, and Constantin F Aliferis. The max-min hill- climbing Bayesian network structure learning algorithm. Machine Learning, 65(1):31-78, 2006.
- [Uhler et al., 2013] Caroline Uhler, Garvesh Raskutti, Peter Bühlmann, and Bin Yu. Geometry of the faithfulness as- sumption in causal inference. The Annals of Statistics, pages 436-463, 2013.
- [Wellman, 1990] Michael P Wellman. Fundamental con- cepts of qualitative probabilistic networks. Artificial In- telligence, 44(3):257-303, 1990.
References were extracted automatically from the PDF and may contain errors.
Full text extracted automatically from the PDF; figures, tables and equations may differ. The PDF is the version of record.
1 Introduction
There is a vast body of research on causal inference which aims at modeling the causal relations among random variables, e.g., [Saeed et al., 2020; Chen et al., 2021]. When there are many variables of interest, the probabilistic graphical models are popular in modern practice. For example, the Ising model, originated from statistical physics, has found applications in unsupervised learning and medical imaging [Morningstar and Melko, 2018]. Other undirected and directed graphical models include Markov random fields and Bayesian Networks (BNs), which are used actively in many machine learning problems [Liu et al., 2017; Mokhtarian et al., 2021]. Traditionally, the BN model represents causal relations using Directed Acyclic Graphs (DAGs) under the structural causal model framework [Pearl, 2000].
One notable limitation of the graphical models is that they capture pairwise interactions exclusively. Even though many studies have reported collective behavior among features in multivariate systems [Battiston et al., 2020], investigating causalities emerged from collective interactions at the level of groups of variables is still a burgeoning research area. Recent developments include [Reing et al., 2021], which studies how a group of variables causally influences the output of a neural network using sensitivity analysis. In particular, critiques have been made that graphical models, which comprise dyadic relations, fail to capture causal relations that emerge from synergistic interactions [James et al., 2016]. The limitation is also related to the basic assumption in causality, known as the faithfulness condition, which is not well-justified in many situations [Uhler et al., 2013]. Moreover, the rapid accumulation of data has challenged researchers to make meaningful deductions from high-dimensional data. For complex systems such as the human genome, connectome, and social networks, it is desirable that the whole shall be grouped into manageable subsystems to draw effective conclusions.
There have been works on capturing complex local dependencies. Qualitative Probabilistic Network (QPN) [Wellman, 1990; de Campos and Cozman, 2013] augments the graphical models by adding directed hyper-edges. [Tikka et al., 2021] proposed transit cluster scheme which reduces the size of a DAG while preserving the identifiability properties of causal effects. Recently, [Anand et al., 2022] introduced the cluster causal diagrams (C-DAGs) with extended d-separation rules and do-calculus. In C-DAG, causal relations are represented among clusters of variables but not among the variables within the clusters. Once the C-DAG is known, we are able to perform causal inference tasks, e.g., policy evaluation [Correa and Bareinboim, 2020], sponsored search advertising [Nabi et al., 2020], and knowledge transferring [Pearl and Bareinboim, 2014], coarsely among groups of variables.
One question left open in [Anand et al., 2022] is how CDAGs can be effectively learned from data. In this paper, we address this question by making the following contributions:
- We adapt the cluster causal diagram (C-DAG) model, which groups random variables with synergistic effects into clusters, to relax the faithfulness assumption in structure learning.
- We propose the Clustering Information Criterion (CIC) score that represents the goodness of fit of the C-DAG model penalized with the model complexity.
- We develop a greedy search strategy to explore the space of C-DAGs to learn the structure that fits the data. Experimental results confirm its effectiveness.
2 Background
2.1 Notations
In the paper, we consider n > 1 random variables X = {X1, . . . ,Xn}, viewed as n vertices in G, and a partition of the n variables into clusters C = {C1,C2, . . . ,Cm}, where 1 ≤ m ≤ n, such that ∪mi=1Ci = X,Ci ⊆ X,Ci ∩ Cj = ∅, ∀i, j ∈ [m], i ̸= j. The set of all possible partitions of X is denoted by Π(X). The number of elements in a cluster Ci is denoted by |Ci|. Suppose Xi has finite alphabet size si. [n] denotes the set of numbers {1, 2, . . . , n}.
A directed graph G = (V, E) is called a Directed Acyclic Graph (DAG) if it contains no directed cycles. Pa(·) denotes the set of parents: Pa(Xj) = {Xi : (Xi,Xj) ∈ E}. Xj is said to be a descendant of Xi if there exists a directed path from Xi to Xj in G, and Xi is said to be an ancestor of Xj. The set of descendants and the set of ancestors of Xk are denoted as De(Xk) and An(Xk) respectively. A Structural Causal Model (SCM) [Pearl, 2000] is a tuple ⟨U, V ,F, P(U)⟩, where U, V are exogenous (latent) and endogenous (observable) variables, and F = {fi}i∈[n] is a collection of functions that encode causal relations, i.e., Xi = fi(Pa(Xi),Ui). So there is a directed edge (Pa(Xi) → Xi) in G indicating the direct causation. A vertex Xj is called a collider if there is a vstructure (Xi → Xj ← Xk) in the graph. P(U) is the joint distribution that encode the uncertainty of the system. The set of vertices in the graph correspond to the random variables, i.e., V = {X1,X2, . . . ,Xn}. Further, ⟨G, P⟩ is called a Bayesian network if the following factorization holds: PX(x) = ∏ni=1 PXi | Pa(Xi)(xi | Pa(xi)). Let C ∈ C be a cluster. We use XC to denote (Xi | Xi ∈ C). and PXC to denote P(Xi | Xi∈C). We say that ⟨G, P⟩ satisfies the Markov property if for any vertex Xi ∈ V , Xi is conditionally independent of its non-descendents given Pa(Xi).
2.2 Score-based DAGLearning
Given observed data D, learning a BN is a structure learning procedure to find a DAG G and the parameters that best encode D. In particular, the task of learning the DAG G is known as structure learning. One popular approach is through the information-theoretic scores, e.g., the Hill-Climbing algorithm [Heckerman et al., 1995]. Score-based structure learning solves the problem
where G is the set of admissible DAGs, and Score(·) is a scoring function that evaluates how well the model fits the data. There are two types of scoring functions: Bayesian and information-theoretic. The Bayesian scoring functions, such as K2 and BDeu, aim at maximizing the posterior probability P (G|D) under various assumptions given a prior distribution.
In this paper, we focus on the information-theoretic scores, which explore the Minimum Description Length (MDL) principle where the model with shorter description length is preferred. The description length includes two components, that required to describe the data and that required to describe the network. Using the Huffman code, the description length of the data is proportional to the log-likelihood, which can be expressed as
where N is the number of instances in D, and HD(·|·) is the conditional entropy using the empirical data distribution PD(·). The log-likelihood is penalized with the complexity of the model, C(G). Therefore, in general, the informationtheoretic score is in the form
where f(N) is a proportionality factor that depends on the number of instances N. The popular Akaike's Information Criterion (AIC) and Bayesian Information Criterion (BIC) scores are taking f(N) to be 1 and 1 2 logN respectively.
Using another information-theoretic measure, the mutual information (MI), [de Campos, 2006] proposed the MIT scoring function that achieves good performance. Specifically, they observed the equivalence between maximizing the loglikelihood and maximizing the sum of the MI:
where HD(·) and ID(·; ·) are the entropy and the MI based on the empirical distribution of D. The score is similar to the one of [Chow and Liu, 1968] which aims at approximating the empirical distribution with tree structures.
3 C-DAG: Motivation, Definition and Setup
In this section, we introduce the definition of cluster causal diagram (C-DAG) and demonstrate its motivation through an example. Then we discuss the faithfulness of C-DAG.
3.1 Model and the Faithfulness Assumption
We formalise the C-DAG model, which encapsulates assumptions about how variables are related.
Assumption 1. The causal mechanism is a SCM, where the exogenous variables are independent, and any two endogenous variables do not share a common exogenous parent.
This assumption is standard in many empirical studies (see, for example, Section 9.2 of [Spirtes et al., 2000]). Below, we adapt the definition of the C-DAG [Anand et al., 2022] according to Assumption 1.
Definition 1 (Cluster Causal Diagram). Consider a SCM and the corresponding causal diagram G = (V ,E). Given a partition C = {C1, . . . ,Cm} of V , construct a graph GC = (C,EC) as follows:
If GC = (C,EC) contains no cycles, then the partition C is admissible, and GC is called a C-DAG. We denote PaGC (Cj) := {Ci : (Ci,Cj) ∈ EC}. We shall omit the subscript of Pa(·) when there is no ambiguity.
- (a) True SCM.
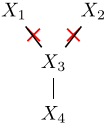
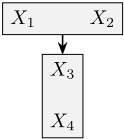
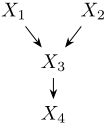
Figure 1: An example containing synergistic causal effect. (a) The distribution is not faithful to the true DAG. (b) Constraint-based algorithms are unable to detect synergistic effects. (c) C-DAG aims at learning the causal effects between groups of random variables.
Definition 1 is different from group DAGs [Parviainen and Kaski, 2017], which has been proposed to learn dependencies from a prior known groups. Similar to the BN, we assume the following factorization holds for C-DAG.
Faithfulness Assumption. Many structure learning algorithms, such as the PC algorithm [Kalisch and B¨uhlman, 2007] and the Max-Min Hill-Climbing (MMHC) algorithm [Tsamardinos et al., 2006], rely on the faithfulness assumption [Uhler et al., 2013; Pearl, 2000].
Definition 2 (DAG faithfulness). A distribution P is faithful to a DAG, G, if no conditional independence relations other than the ones entailed by the Markov property are present.
In other words, A BN satisfies the faithfulness condition if the joint distribution P(X) embodies only independencies that can be represented in the DAG [Spirtes et al., 2000]. Despite the common acceptance, the faithfulness assumption has been shown to be questionable when learning DAGs [Uhler et al., 2013]. In statistics, as discussed in [Robins et al., 2003], the practice of selecting variables who have large regression coefficients also assumes the faithfulness condition, which may not hold in many situations in regression analysis. Next, we present a simple example where the absence of faithfulness leads to poor causal discovery performance.
3.2 AMotivating Example
Let V = {X1,X2,X3,X4} be the observed random variables, U = {ϵ1, ϵ2, ϵ3, ϵ4} be the exogenous binary random variables. Consider the causal mechanism (see Figure 1a):
where X1⊕X2 := (X1+X2) mod 2 is the binary addition operator. Specifically, X1 ⊕ X2 = 1 if and only if X1 ̸= X2. In biology, X1,X2 could indicate the existence or nonexistence of two genes, and X3 could indicate a phenotype that is observed if and only if one of X1 and X2 is present. X4 could represent a measurement related to the phenotype.
Assume ϵ1, ϵ2 i.i.d. ∼ Be( 12 ). We use the classical Binary Symmetric Channel (BSC), to construct ϵ3 and ϵ4. A BSC between the input Y and output Z with crossover probability p is such that P(Z = i|Y = j) = p if i ̸= j and P(Z = i|Y = j) = 1-p if i = j for i, j ∈ {0, 1}. Let ϵ3 be such that X1 ⊕ X2 and X3 form a BSC with crossover probability δ, and let ϵ4 be such that X3 and X4 form a BSC with crossover probability γ. The joint distribution PX1X2X3X4 is factorized as PX1X2X3 = PX1 ·PX2 ·PX3|X1,X2 PX4|X3 , which implies three directed edges (X1 →X3), (X2 →X3), (X3 →X4). We can compute the MI: I(X1;X2) = I(X1;X3) = I(X1;X4) = I(X2;X3) = I(X2;X4) = 0, and I(X3;X4) = 1 -H(γ) ≥ 0. Note that zero MI implies statistical independency. Yet, these independence relations, e.g., X1 ⊥ X3,X2 ⊥ X3, are not entailed by the Markov property. Hence, the faithfulness condition is not satisfied for the DAG. If we pick variables using the coefficients from pairwise regression, then only one edge connecting X3 and X4 may be present, while the edges (X1 → X3) and (X2 → X3) will not be recovered, as illustrated in Figure 1b. That is, the causal relations between X1,X2 and X3,X4 are lost.
3.3 Faithfulness of C-DAG
Figure 1c illustrates the use of C-DAG to circumvent the issue raised by the example in Section 3.2 due to the violation of the faithfulness condition. By clustering random variables according to the synergistic measure of information, we can recover the causal relations at the clustering (group) level. Instead of requiring the Bayesian network ⟨G, P ⟩ to be faithful, we assume faithfulness at a coarser scale, where the individual variables who violate the condition can be grouped together to preserve the faithfulness for C-DAGs.
Definition 3 (C-DAG faithfulness). A distribution P is faithful to a C-DAG GC = (C, EC) if no conditional independence relations other than the ones entailed by the Markov property, viewing clusters as individual vertices, are present.
Theorem 1. Consider a BN ⟨G, P⟩, where G = (V,E) is a DAG. Given a clustering C = {C1, . . . , Cm} of V. Let GC be the C-DAG induced by G and C according to Definition 1. If for any collider Vi ∈ V, there exists Ci ∈ C such that either Ci = {Vi} ∪ De(Vi) or {Vi} ∪ An(Vi) ⊆ Ci, then the faithfulness to G implies that to GC.
The proof of the theorem follows from Theorem 4.6 of [Anand et al., 2022]. Theorem 1 shows the faithfulness of a BN implies the faithfulness of the C-DAG representation. However, the converse does not hold (see the example in Section 3.2), i.e., the faithfulness of the C-DAG is a weaker condition therefore may have broader applications in real-world complex systems. This result differs from [Parviainen and Kaski, 2017] as the definitions for group DAG and C-DAG are different: C-DAG requires the edges to satisfy Eq. (2), whereas the clusterings in group DAGs are known a prior.
4 Information-Theoretic C-DAGLearning
Based on the discussion above, the C-DAG learning objective of this paper is formally stated as follows.
Learning objective: Given a set of N observations D = {y1, y2, . . . , yN}, where yi ∈ Rn , ∀1 ≤ i ≤ N, the goal is to recover a C-DAG GC = (C,EC) that embodies the causal relationships in the cluster causal diagram such that the learned C-DAG satisfies faithfulness (Definition 3).
Next, we will propose an information-theoretic scoring function, the Clustering Information Criterion (CIC), that captures how well the data fit the C-DAG model while encouraging low complexity. We will then introduce an algorithm to search for the C-DAG with high CIC score.
4.1 Basics of InformationMeasures
We first review some definitions in information theory. Let H(X) = - ∫ PX log PX dx be the entropy of a random variable X with density PX, which could be vector-valued. The mutual information (MI) between X and Y with joint density PX,Y , defined as
measures the mutual dependence between X and Y . Particularly, zero MI implies statistical independence. The conditional mutual information is defined as
The total correlation extends MI to multi-variate case,
4.2 Information-Theoretic Evaluation of C-DAG
We will introduce our method in several steps. Given a dataset and candidate structures, we first evaluate the degree of fitness of the C-DAG to the data while endeavoring to group variables that may violate the faithfulness condition due to high inter-dependencies and synergistic effects.
Regarding the fitness of the data D, we exploit the loglikelihood discussed in Section 2.2. According to Eq. (1), maximizing the log-likelihood of the DAG G is equivalent to maximizing the sum of the empirical MI
noticing that the term ∑ni=1 HD(Xi) is independent of the model. To generalize the score to C-DAGs, we define the measure of log-likelihood w.r.t. a C-DAG GC = (C, EC) as
The relationship between the two functions g1(G : D) and g2(GC : D) is non-trivial, because the MI is nonmodular, i.e., the sum ∑Xi∈Pa(Y ) I(Xi; Y ) may not equal to I(Pa(Y ); Y ). There is a line of research on how the MI can be decomposed into modular components including synergistic, redundant, and unique information [Lizier et al., 2018; Niu and Quinn, 2019]. Roughly speaking, the MI between the clusters minus sum of pairwise MI indicates the presence of synergistic interaction [McGill, 1954], which will be used in our score function. In addition, to discover strongly correlated random variable, we use the total correlation which reflects the total amount of information present in a set of random variables. Adding these two elements together, we evaluate the C-DAG by:
4.3 C-DAGComplexity Penalization
Highly complex model often incurs over-fitting. We present a regularization built upon the Minimum Description Length (MDL) principle. It is desirable that the derived clustering preserves as much information as possible while maintaining a short description length. From the perspective of MDL, a model can be seen as a prefix code, and it is preferred that the code compresses the data into fewer bits.
To encode the C-DAG, the following information is necessary and sufficient: (1) a partition of the n vertices; (2) a list of the parents of each cluster, and (3) the set of conditional probabilities associated with each vertice needed to parametrize the network.
Suppose the n random variables are partitioned into m clusters C = {C1, . . . ,Cm}, and that each cluster Ci has ki parent clusters. To encode the partitioning, we consider the number of ways to partition a set of n elements into m ≤ n non-empty subsets. This number is called the Stirling number of the second kind,
Therefore, the number of bits to encode a particular partition C is log(S(n,m)). In practice, the number can be efficiently computed using recursions. Moreover, to encode the parent clusters, we need ki log(m) bits. To parametrize the network, we need the conditional probabilities PCi|Pa(Ci), which requires (∏Xj∈Ci sj - 1) ∏Xk∈Pa(Ci) sk real numbers. To summarize, we regularize the model complexity based on the minimal description length principle with a penalty:
4.4 The Clustering Information Criterion Score
With the scoring function (4) and the penalization function (5), we are now ready to introduce our Clustering Information Criterion (CIC). Throughout the previous discussion, we have omitted the sample size N. In general, the score should be normalized with factors that depend on N, i.e., score(G : D) = f1(N)g(G : D) - f2(N)C(G). To choose proper factors, we use f1(N) = 2N in the Mutual Information Test (MIT) score [de Campos, 2006] and f2(N) = 1 2 logN in the BIC score [Schwarz, 1978]. The final expression of the proposed CIC scoring function is:
4.5 Search Strategy
In order to efficiently find the structures with high scores, in this section, we develop a search strategy over the space of C-DAGs. We take advantage of the decomposibility of the score given a clustering, i.e., we only need to recalculate the score based on that local changes including adding/deleting/reversing an edge. We follow the standard greedy search strategy. Our Algorithm 1 implements Z steps of greedy search, Algorithm 2. After obtaining the clusters and edges, we run conditional independency test on each separator to make sure the v-structures are corrected recovered.
Greedy Search. We apply a local greedy search operation to search for the local optimal structure. To explore the structures, we define the neighborhood of a C-DAG GC = (C, EC) by applying one of the following possible moves that does not result in a cycle: adding, deleting, and reversing an edge in EC. We define the neighborhood of a C-DAG GC as
and the greedy search is to compare scores over the space of neighboring C-DAGs.
Random sampling. Algorithm 1 involves randomly sampling a clustering C and edges EC. To get a partition of [n], we first sample the number of clusters m and then assign each random variable to a randomly selected cluster. For each vertex, the probability of being assigned to a particular cluster is uniform. We can control the clustering sparsity by specifying the distribution of m. To sample the edges EC, we apply the standard Erd˝os-R´enyi procedure. We first generate undirected
edges Eund such that eij i.i.d. ∼ Be(ρ), ∀ 1 ≤ i < j ≤ m, where eij indicates whether there is an edge between the two clusters Ci and Cj. Next, for any edge {Ci,Cj} ∈ Eund, we set the order (Ci,Cj) if i < j. The last step is to randomly permutate the cluster labels. The resulting graph GC = (C, EC) is guaranteed to be a C-DAG.
5 Experiments
In this section, we provide numerical results to demonstrate the practical benefits of our work, that the proposed Clustering Information Criterion (CIC) score and C-DAG learning algorithm coalesce into a principled framework for learning cluster causal diagrams from observational data.
5.1 Synthetic Datasets
We begin our experimental investigation by considering two Boolean functions exhibiting different synergistic behaviors that are only available through the interaction among a set of variables. The functions of interests are the parity and the majority. The output of the parity is true if and only if the number of ones in the input is odd. The output of the majority is true if and only if at least half of the inputs are true. For these functions, it is impossible to determine the output using an individual input. In particular, the parity is purely synergistic in terms of the MI: let Xi ∼ Be(pi), i ∈ [n], and Y = Parity(X1, . . . ,Xn), then I(X \ {Xi}; Y ) = 0, but
Algorithm 1 Learning C-DAG representation
Input: Data D, Number of steps Z, Sampling parameter ρ Output: A learned structure G∗
- 1: Randomly sample a clustering C and edges EC. 2: GC = (C,EC), G∗ = GC, score = ScoreCIC(GC : D). 3: for i = 1 to Z do 4: Randomly sample a clustering C and edges EC. 5: Set GC = (C,EC). 6: G′C = GreedySearch(GC) 7: if ScoreCIC(G′C : D) > score then 8: G∗ = G′C , score = ScoreCIC(G′C : D). 9: end if 10: end for 11: for each Ci -Cj -Ck appears in G∗ do 12: if XCi ⊥XCk |XCj is False then 13: E∗ C = (E∗ C \ {(Cj,Ci), (Cj,Ck)}) ∪ {(Ci, Cj ), (Ck , Cj )}. 14: end if 15: end for 16: return G∗
Algorithm 2 Greedy Search
- Input: Data D = {y1, y2, . . . , yN}, Structure GC = (C, EC) Output: A local optimal G′C 1: G′C = GC, score = ScoreCIC(G′C : D). 2: for G′′ C ∈ N(G′C ) do 3: if ScoreCIC(G′′ C : D) > score then 4: G′C = G′′ C 5: score = Score(G′C : D) 6: end if 7: end for 8: return G′C
I(X; Y ) > 0, i.e., every strict subset of X is independent of the output, whereas the output is deterministic of the inputs.
We use the two functions of triple-wise interactions as building blocks of the clusters to construct the C-DAGs. Below, ¬ and ∧ denote the logic negation and logic AND operations. We use the Binary Symmetric Channel (BSC) to simulate noises. X = BSCp(Y ) denotes P (X = i|Y = i) = 1 - p and P(X = ¬i|Y = i) = p for i = 0, 1. We consider an underlying SCM using different combinations of the parity and the majority, and present the results of three representative scenarios. Let X1,X2,X3,X4,X5,X6 i.i.d. ∼ Be( 12 ), and we generate X7, X8 by
Scenario 1.
Scenario 2.
Scenario 3.
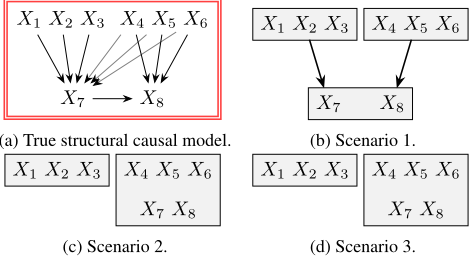
In each scenario, we simulate N = 1000 data points and run Algorithm 1 with Z = 500 iterations. We set the parameter of the Erd˝os-R´enyi graph ρ = 0.5 for random sampling and the channel noise parameters p1 = p2 = 0.1. We visualize the true DAG (Figure 2a, for all three cases) and the learned C-DAGs in Figure 2. We see that for scenario 1, our method successfully recovers the synergistic effects caused by the parity function (Figure 2b). In the other two scenarios, the majority function exhibit less synergistic effects than the parity function. Still, the learned C-DAG well identifies the clustering structure of C1 = {X1,X2,X3}. The cluster C2 = {X4, X5, X6, X7, X8} in Figure 2c and 2d is due to the high inter-dependencies. For scenario 2 and 3, although there is a missing edge between the two clusters according to (2), the correlation between the two clusters can be detected from the data, and the two directions C1 → C2 and C2 → C1 are not statistically distinguishable. As a comparison, in Figure 3, we report the results of the PC and the Hill-Climbing (HC) algorithms using the open-source pgmpy package in Python. The presented result is with significance level s = 0.01. We also tested s = 0.05, 0.1, which leads to minor changes in the edges but does not change the main conclusion. In all cases, these classical learning algorithms hardly find any informative causal relation in the data.
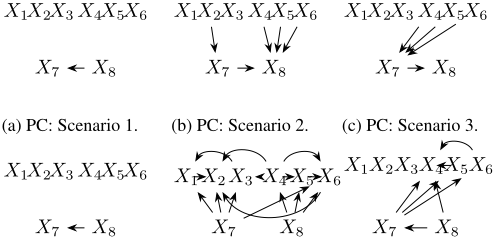
(d) HC: Scenario 1.
(e) HC: Scenario 2.
(f) HC: Scenario 3.
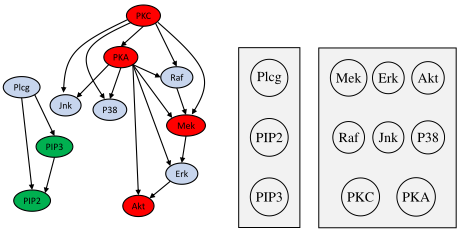
(a) Ground truth SCM from [Sachs et al., 2005]. (b) Recovered C-DAG using the proposed method.
Figure 4: Results on human immune system protein-signaling networks. The recovered C-DAG in (b) complies with the true DAG in (a). The group containing Plcg, PIP3, and PIP2 is well discovered.
5.2 Protein-Signaling Networks
As an example of real-world application, we apply our method to the protein signaling dataset [Sachs et al., 2005], which contains the expression levels of n = 11 proteins and phospholipids in human immune system cells, with N = 7466 observations. The cellular protein measurements are continuous random variables. To efficiently estimate the MI, we apply the traditional kNN-based non-parametric estimator [Kraskov et al., 2004] with k = 5. We run our algorithms with ρ = 0.5 and Z = 500. The resulting C-DAG, shown in Figure 4b, complies with definition (2). In particular, the algorithm successfully discovered the two groups of closely related molecules, {Plcg, PIP3, PIP2} and {PKC, PKA, Jnk, Raf, P38, Mek, Erk, Akt}, in the biological process, as expected from the ground truth.
6 Conclusion
To represent causal relations among clusters of random variables, the cluster causal diagrams (C-DAGs) extend the approach of the Bayesian networks to causal inference. In this paper, we show that the faithfulness assumption, enforced in most BN learning algorithms, can be relaxed using C-DAGs. We propose an information-theoretic scoring function, the Clustering Information Criterion (CIC), that represents how well the C-DAG structure fits the data. To effectively discover C-DAGs of high CIC scores, we develop a greedy searching strategy. We implement our method to recover C-DAGs using both synthetic and real data that involves complex interactions among groups of variables. We believe this work is a positive first step towards a tractable method for learning cluster causal diagrams from observational data.
@inproceedings{ijcai2022p675,
  title     = {Learning Cluster Causal Diagrams: An Information-Theoretic Approach},
  author    = {Niu, Xueyan and Li, Xiaoyun and Li, Ping},
  booktitle = {Proceedings of the Thirty-First International Joint Conference on
               Artificial Intelligence, {IJCAI-22}},
  publisher = {International Joint Conferences on Artificial Intelligence Organization},
  editor    = {Luc De Raedt},
  pages     = {4871--4877},
  year      = {2022},
  month     = {7},
  note      = {Main Track},
  doi       = {10.24963/ijcai.2022/675},
  url       = {https://doi.org/10.24963/ijcai.2022/675},
}
TY - CPAPER TI - Learning Cluster Causal Diagrams: An Information-Theoretic Approach AU - Niu, Xueyan AU - Li, Xiaoyun AU - Li, Ping T2 - Proceedings of the Thirty-First International Joint Conference on Artificial Intelligence, IJCAI-22 PB - International Joint Conferences on Artificial Intelligence Organization PY - 2022 SP - 4871 EP - 4877 DO - 10.24963/ijcai.2022/675 UR - https://doi.org/10.24963/ijcai.2022/675 ER -Copied
Machine-readable versions of this paper, for tools and AI agents:





