
Chronic Disease Management with Personalized Lab Test Response Prediction
Proceedings of the Thirty-First International Joint Conference on Artificial Intelligence. AI for Good. Pages 5038-5044.
https://doi.org/10.24963/ijcai.2022/699
Keywords
- Multidisciplinary Topics and Applications: Health and Medicine
- Humans and AI: Personalization and User Modeling
Abstract
Chronic disease management involves frequent administration of invasive lab procedures in order for
clinicians to determine the best course of treatment
regimes for these patients. However, patients are
often put off by these invasive lab procedures and
do not follow the appointment schedules. This has
resulted in poor management of their chronic conditions leading to unnecessary disease complications. An AI system that is able to personalize the
prediction of individual patient lab test responses
will enable clinicians to titrate the medications to
achieve the desired therapeutic outcome. Accurate prediction of lab test response is a challenge because these patients typically have co-morbidities and their treatments might influence the target lab test response. To address this,
we model the complex interactions among different medications, diseases, lab test response, and
fine-grained dosage information to learn a strong
patient representation. Together with information
from similar patients and external knowledge such
as drug-lab interactions and diagnosis-lab interaction, we design a system called KALP to perform
personalized prediction of patients’ response for a
target lab result and identify the top influencing
factors for the prediction. Experiment results on
real-world datasets demonstrate the effectiveness of
KALP in reducing prediction errors by a significant
margin. Case studies show that the identified factors are consistent with clinicians’ understanding.
- [Baytas et al., 2017] I. Baytas, C. Xiao, X. Zhang, F. Wang, A. K. Jain, and J. Zhou. Patient subtyping via time-aware lstm net- works. In ACM SIGKDD, 2017.
- [Bhoi et al., 2021] Suman Bhoi, M. L. Lee, W. Hsu, H. S. A. Fang, and N. C. Tan. Personalizing medication recommendation with a graph-based approach. TOIS, 40(3):1-23, 2021.
- [Brody et al., 2021] S. Brody, U. Alon, and E. Yahav. How attentive are graph attention networks? arXiv:2105.14491, 2021.
- [Choi et al., 2016] E. Choi, M. T. Bahadori, J. Sun, J. Kulas, A. Schuetz, and W. Stewart. Retain: An interpretable predic- tive model for healthcare using reverse time attention mechanism. NeurIPS, 2016.
- [Darabi et al., 2020] Sajad Darabi, Mohammad Kachuee, Shayan Fazeli, and Majid Sarrafzadeh. Taper: Time-aware patient ehr representation. JBHI, 24(11):3268-3275, 2020.
- [Dornhorst et al., 1985] Anne Dornhorst, StephenH Powell, and Jack Pensky. Aggravation by propranolol of hyperglycaemic ef- fect of hydrochlorothiazide in type ii diabetics without alteration of insulin secretion. The Lancet, 325(8421):123-126, 1985.
- [Fisher, 1992] Ronald Aylmer Fisher. Statistical methods for re- search workers. In Breakthroughs in statistics, pages 66-70. Springer, 1992.
- [Jia et al., 2020] Zheng Jia, Xian Zeng, Huilong Duan, Xudong Lu, and Haomin Li. A patient-similarity-based model for diagnostic prediction. IJMI, 135:104073, 2020.
- [Johnson et al., 2016] Alistair EW Johnson, Tom J Pollard, et al. Mimic-iii, a freely accessible critical care database. Scientific data, 3(1):1-9, 2016.
- [Kang et al., 2015] Seokho Kang, Pilsung Kang, Taehoon Ko, Sungzoon Cho, Su-jin Rhee, and Kyung-Sang Yu. An effi- cient and effective ensemble of support vector machines for anti- diabetic drug failure prediction. ESA, 42(9):4265-4273, 2015.
- [Kang et al., 2017] Seokho Kang, Sungzoon Cho, Su-jin Rhee, and Kyung-Sang Yu. Reliable prediction of anti-diabetic drug failure using a reject option. PAA, 20(3):883-891, 2017.
- [Kang, 2018] Seokho Kang. Personalized prediction of drug effi- cacy for diabetes treatment via patient-level sequential modeling with neural networks. AIM, 85:1-6, 2018.
- [Kenton and Toutanova, 2019] Jacob Devlin Ming-Wei Chang Kenton and Lee Kristina Toutanova. Bert: Pre-training of deep bidirectional transformers for language understanding. In Pro- ceedings of NAACL-HLT, pages 4171-4186, 2019.
- [Kuhn et al., 2016] Michael Kuhn, Ivica Letunic, Lars Juhl Jensen, and Peer Bork. The sider database of drugs and side effects. Nu- cleic acids research, 44(D1):D1075-D1079, 2016.
- [Le et al., 2018] Hung Le, Truyen Tran, and Svetha Venkatesh. Dual memory neural computer for asynchronous two-view se- quential learning. In SIGKDD, pages 1637-1645, 2018.
- [Li et al., 2020] Yikuan Li, Shishir Rao, Jose Roberto Ayala So- lares, et al. Behrt: transformer for electronic health records. Sci- entific reports, 10(1):1-12, 2020.
- [Lu et al., 2021] Chang Lu, Chandan K. Reddy, Prithwish Chakraborty, Samantha Kleinberg, and Yue Ning. Collaborative graph learning with auxiliary text for temporal event prediction in healthcare. In IJCAI, pages 3529-3535, 2021. IJCAI
- [Luo et al., 2016] Yuan Luo, Peter Szolovits, Anand S Dighe, and Jason M Baron. Using machine learning to predict laboratory test results. AJCP, 145(6):778-788, 2016.
- [Luo et al., 2020] Junyu Luo, Muchao Ye, et al. Hitanet: Hierar- chical time-aware attention networks for risk prediction on elec- tronic health records. In SIGKDD, pages 647-656, 2020.
- [Ma et al., 2017] Fenglong Ma, Radha Chitta, Jing Zhou, Quanzeng You, Tong Sun, and Jing Gao. Dipole: Diagno- sis prediction in healthcare via attention-based bidirectional recurrent neural networks. In SIGKDD, pages 1903-1911, 2017.
- [MacDonald et al., 2010] Michael R MacDonald, Dean T Eurich, et al. Treatment of type 2 diabetes and outcomes in patients with heart failure: a nested case-control study from the uk gen- eral practice research database. Diabetes care, 33(6):1213-1218, 2010.
- [Ni et al., 2017] Jingchao Ni, Hongliang Fei, Wei Fan, and Xiang Zhang. Cross-network clustering and cluster ranking for medical diagnosis. In ICDE, pages 163-166. IEEE, 2017.
- [Oei et al., 2021] R. W. Oei, A. Fang, W. Y. Tan, , W. Hsu, M. L. Lee, and N. C. Tan. Using domain knowledge and data-driven insights for patient similarity analytics. JPM, 11(8), 2021.
- [Prakash et al., 2021] PKS Prakash, S. Chilukuri, N. Ranade, and S. Viswanathan. Rarebert: Transformer architecture for rare dis- ease patient identification using administrative claims. In AAAI, volume 35, pages 453-460, 2021.
- [Shang et al., 2019] Junyuan Shang, Cao Xiao, Tengfei Ma, Hongyan Li, and Jimeng Sun. Gamenet: Graph augmented mem- ory networks for recommending medication combination. In AAAI, volume 33, pages 1126-1133, 2019.
- [Sukhbaatar et al., 2015] Sainbayar Sukhbaatar, Arthur Szlam, Ja- son Weston, and Rob Fergus. End-to-end memory networks. NeurIPS, 2015:2440-2448, 2015.
- [Tan et al., 2019] Qingxiong Tan, Andy Jinhua Ma, et al. Ua- crnn: Uncertainty-aware convolutional recurrent neural network for mortality risk prediction. In CIKM, pages 109-118, 2019.
- [Unnikrishnan et al., 2012] Ranjit Unnikrishnan, Ranjit Mohan Anjana, and Viswanathan Mohan. Drugs affecting hba1c levels. IJEM, 16(4):528, 2012.
- [Vaswani et al., 2017] Ashish Vaswani, Noam Shazeer, et al. At- tention is all you need. In NeurIPS, pages 6000-6010, 2017.
- [Wang et al., 2019] Shanshan Wang, Pengjie Ren, Zhumin Chen, Zhaochun Ren, Jun Ma, and Maarten de Rijke. Order-free medicine combination prediction with graph convolutional rein- forcement learning. In CIKM, pages 1623-1632, 2019.
- [Wei et al., 2013] Wei-Qi Wei, Robert M Cronin, Hua Xu, Thomas A Lasko, Lisa Bastarache, and Joshua C Denny. De- velopment and evaluation of an ensemble resource linking medi- cations to their indications. JAMIA, 20(5):954-961, 2013.
- [Wirbka et al., 2020] Lucas Wirbka, Walter E Haefeli, and An- dreas D Meid. A framework to build similarity-based cohorts for personalized treatment advice-a standardized, but flexible work- flow with the r package simbaco. PloS one, 15(5):e0233686, 2020.
References were extracted automatically from the PDF and may contain errors.
Full text extracted automatically from the PDF; figures, tables and equations may differ. The PDF is the version of record.
1 Introduction
Electronic Health Records (EHR) provide a rich repository of patient related information such as disease diagnosis, lab test results, prescribed medications, etc. over a history of visits. Advances in machine learning have led to the largescale analytics of EHR for disease inference [Ni et al., 2017], mortality prediction [Tan et al., 2019], personalized medication recommendation [Wang et al., 2019; Shang et al., 2019; Bhoi et al., 2021]. At the same time, there is a growing trend towards using patient analytics for decision support [Oei et al., 2021] to improve patient care and clinical outcomes, particularly in chronic disease management such as hypertension and diabetes. Often, these chronic disease patients are prescribed some standard treatment regime for each chronic condition independently and their conditions are monitored periodically based on lab test results such as HbA1c 1 . For patients with co-morbidities, studies have shown that their lab test results are often influenced by other treatments related to their co-morbidities, making it hard to assess the effectiveness of the prescribed treatment [Unnikrishnan et al., 2012]. The ability to predict the target lab test result of a patient, taking into consideration his condition and medications that are prescribed for co-morbidities, would enable the clinician to personalize the treatment regime for a patient. This can help eliminate invasive procedures associated with sample collection for the lab test, contributing to the Sustainable Development Goal of Good Health and Well-being 2 .
Existing research use patient specific information such as demographics and past visit records to predict lab test results [Luo et al., 2016; Kang, 2018]. These works do not consider the impact of medications on the target lab test result. For example, patients with high blood pressure are prescribed medications like Propranolol which is known to increase HbA1c [Dornhorst et al., 1985]. In practice, lab test results are often influenced by drugs and diagnosis. However, these drug-lab interactions and diagnosis-lab interactions are largely ignored by current works on lab response predictions. Another aspect that has been overlooked is to leverage on patient analytics where patients with similar demographics and diagnosis tend to have similar lab test responses.
In this work, we use a transformer encoder to capture the patient specific information, while the information of similar patients is modeled using the modified graph attention network (GATv2). With this, we obtain a strong latent patient representation and incorporate fine-grained dosage information to accurately predict patient response to a target lab test in the presence of medication titrations for chronic disease patient management. This is in contrast to existing works which mainly consider medication type. The contributions of this work are as follows:
1 https://medlineplus.gov/lab-tests/hemoglobin-a1c-hba1c-test/
2 Specific target indicators being addressed are 3.4.1 and 3.d.1 under the third SDG.
- We design a personalized deep learning system that combines the sequential information in patient visit history and information from similar patients to generate a strong patient representation.
- We augment the patient representation with external knowledge of drug-lab interactions and diagnosis-lab interactions to model the complex relationships among drugs, co-morbidities, and lab test results.
- We identify the factors that influenced the predicted lab test results, thus providing insights to changes (if any) in the lab results.
- Extensive quantitative and qualitative experiments on the benchmark MIMIC-III [Johnson et al., 2016] EHR and a proprietary outpatient dataset demonstrate the effectiveness of the proposed system to significantly lower the prediction errors by a large margin.
2 RelatedWorks
Lab test prediction has been studied using patient EHR and visit information [Luo et al., 2016; Kang et al., 2015; Kang et al., 2017; Kang, 2018]. Learning a strong latent patient representation is key to the accurate prediction of lab test results. Researchers have used recurrent neural network (RNN), bidirectional RNN, time-aware long-short term memory and memory augmented RNNs to handle long-range dependencies in patient visit history when learning patient representations [Choi et al., 2016; Ma et al., 2017; Baytas et al., 2017; Sukhbaatar et al., 2015].
Transformer encoder representations have been shown to be superior over RNN based approaches in capturing the sequential dependency in EHR for disease prediction [Li et al., 2020], mortality prediction [Darabi et al., 2020], medication recommendation [Prakash et al., 2021]. HiTANet [Luo et al., 2020] introduces a time-aware transformer to obtain a patient representation using local and global attention for risk prediction. BEHRT [Li et al., 2020] adapts a Transformer-based architecture [Kenton and Toutanova, 2019] to learn patient representation using patient's diagnostic and demographic information to predict future disease occurrence. All these works do not consider information from other similar patients and do not use fine-grained dosage information.
The work in [Lu et al., 2021] models patient similarity and ontology of diseases to learn disease representation while incorporating clinical notes for the task of diagnosis and heart failure prediction. Our work differs from this in that our notion of patient similarity includes demographics, prescribed medications information in addition to disease diagnosis to predict lab test responses.
3 Methodology
Given a sequence of past patient visits, our task is to predict the result of a target lab test for the patient's current visit. Figure 1 gives an overview of the proposed solution called KALP for Knowledge Augmented Lab test Prediction. There are two key components: (a) learning an effective latent patient representation and (b) augmenting it with knowledge of drug-lab and disease-lab interactions, as well as patients' historical responses to the lab test.
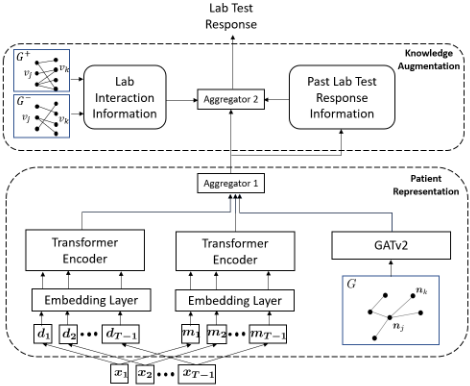
3.1 Patient Representation
Our proposed patient representation takes into account both the sequential dependency in patient diagnosis and medication information, as well as information from similar patients. Suppose a patient has T - 1 visits prior to his current visit. We represent the ith visit of a patient as
where di is a multi-hot vector depicting the diagnosis, mi is a vector of (medication, dosage) pairs, and li denotes the result of the target lab test, 1 ≤ i ≤ T - 1.
Sequential Dependency. We utilize two transformers to model the sequential dependency in the patients' diagnosis and medication information over the visits. Having dual transformers enable us to obtain representation for patients who may have missing diagnosis or medication information. We linearly embed di and mi, into a low dimensional space using embedding matrices Ed and Em respectively. These linear embeddings are combined with positional embeddings [Vaswani et al., 2017] to obtain the embeddings for diagnosis dei and medication mei which are then passed to their respective transformers (see Figure 2).
Each transformer consists of multiple layers with each layer having T - 1 encoders. Each encoder has a positionwise fully connected feed-forward network and a multi-head self-attention mechanism. The position-wise feed-forward network has two linear transformations with a ReLU layer in between. The multi-head attention employs scaled dotproduct attention to obtain the weights on the patient visits given the visit history. Since this multi-head attention can attend to future time steps, to ensure that the model's predictions are only conditioned on past visits, we apply a triangular mask to the embedding dei and mei . This mask is the same as the one used in the decoder component. The input to the ith encoder in the first layer is the concatenation of dej , 1 ≤ j ≤ i. Inputs to the ith encoder in the subsequent layers is the concatenation of the outputs from the first to the ith encoders of the previous layers. We employ residual connection around the self-attention mechanism and the feed-forward network is followed by layer normalization. We also apply dropout to avoid over-fitting. The outputs of the transformers for diagnosis and medications are given by:
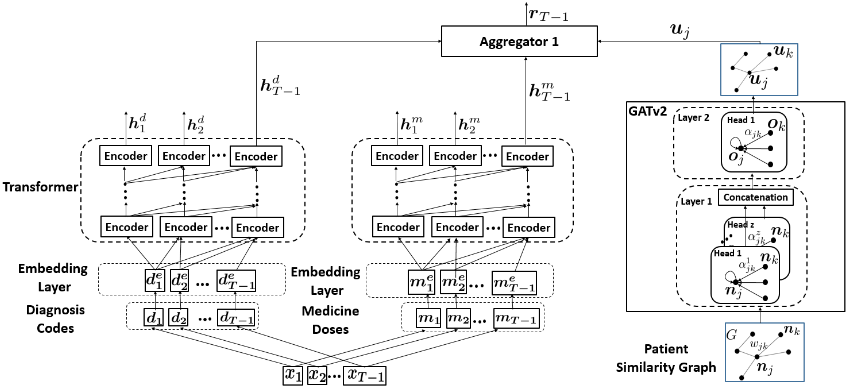
where hdi and hmi are the outputs of ith encoder in the last layer of the respective transformers. Since our goal is to predict the lab test result for the current visit T, we use the outputs hdT-1 and hmT-1 as the encoded sequential diagnosis and medication information.
Patient Similarity Information. Patient similarity has been used to improve the accuracy of diagnosis prediction [Jia et al., 2020] and treatment recommentation [Wirbka et al., 2020]. The work in [MacDonald et al., 2010] observe that patients with similar demographics and diagnosis tend to have similar lab test responses. As such, we incorporate information from similar patients to learn a more effective patient representation to improve the lab result prediction accuracy.
We construct a weighted patient similarity graph G = (V,E) where each node ni ∈ V denotes a patient i, and each labelled edge (ni,nj,wij) ∈ E denotes that patient i is similar to patient j with a degree of similarity wij. Here, ni is based on patient information at their first visit, together with their age, weight, and gender information.
Note that any similarity measure can be used. Here we use cosine similarity between ni and nj to compute wij . We adapt GATv2 [Brody et al., 2021] to learn the node representation of the weighted patient similarity graph G. GATv2 has two layers with z attention heads in the first layer, and 1 attention head in the second layer as shown in Figure 2. The attention weight between nodes nj and nk for the bth attention head in the first layer is given by:
where ‖ denotes concatenation, Sj is the set of nodes whose similarity with node j is non-zero, Eb is the embedding matrix of the bth attention head, and wjk denotes the edge weight representing the similarity between patients j and k.
The output from the first layer for a node nj is given by:
where σ is the sigmoid function. With this, the output from the second layer for node nj can be obtained as follows:
where αjk is calculated by using the average of the attention weight between node j and k from the first layer as new edge weights, i.e., wjk is updated to the average of αb jk for 1 ≤ b ≤ z, E is the embedding matrix for the second layer. Combining this uj with the diagnosis and medication representation of the most recent visit hdT-1 and hmT-1 , we obtain the patient representation rT-1:
3.2 Knowledge Augmentation
Next, we augment the obtained patient representation with drug-lab interactions and disease-lab interactions, as well as patients' past responses to the lab test.
Lab Interaction Information. We obtain the drug-lab and disease-lab interactions from AACC Effects on Clinical Laboratory Tests database 3 , SIDER [Kuhn et al., 2016] and MEDI [Wei et al., 2013]. Incorporating this information makes the system aware of the impact of these interactions on the lab test values. Since the interactions can be positive (increases the lab test value) or negative (decreases the lab test value), we use two bipartite graphs to represent them: a positive lab interaction graph G+ = (X, Y +) and a negative lab interaction graph G- = (X, Y -) where each node v ∈ X denotes either a lab test, medication or diagnosis and a labelled edge (vi, vj) ∈ Y +/Y - denotes positive/negative interaction between nodes vi and vj. The lab tests constitute one type of nodes, and medications, diagnosis together constitute another type of nodes and there is no edge between nodes of the same type.
3 https://clinfx.wiley.com/aaccweb/aacc/
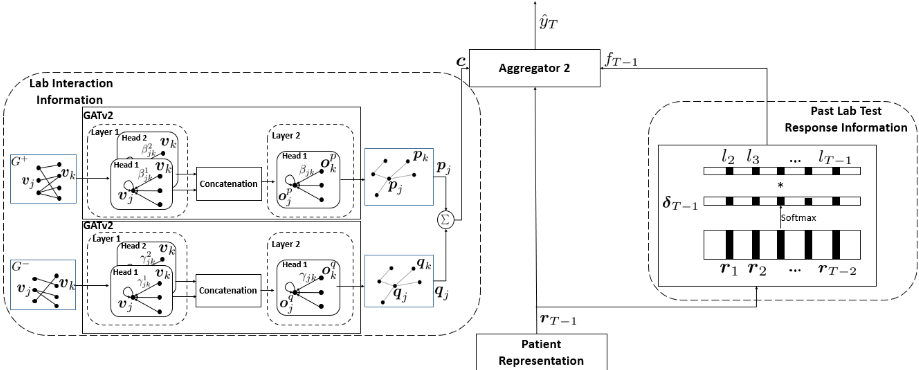
Similar to what we have done for the weighted patient similarity graph, we use GATv2 with two layers and two attention heads in the first layer to learn the node representations from the positive and negative lab interaction graphs (see Figure 3). The node representations of G+ and G- are mapped to a low dimensional space by applying the embedding matrices Eb+ and Eb- respectively in the first layer for the bth attention head where 1 ≤ b ≤ 2 . With this, we obtain the node representations p and q of the target lab test from G+ and Grespectively. Then the lab interaction vector c is given by:
where λ regulates the fusion of positive and negative lab interaction information.
Past Lab Test Response Information. Since patients respond to treatments differently, incorporating a patient's own past lab test responses will guide KALP to generate personalized lab responses. We have a repository of patients' past lab test responses stored in the form of key-value pairs where the key is the patient representation and the value is the lab test response. Given the patient representation rT-1, we compute the attention on the previous representations ri, 1 ≤ i ≤ T - 2, stored in the repository as follows:
With this attention δT-1 ∈ RT-2 , we obtain the weighted past visit lab response fT-1 as follows:
where δT-1[i] depicts the ith entry in the attention vector δT-1, and li+1 is the lab test result at the (i + 1)th visit. By concatenating rT-1, c, and fT-1, we obtain the final output vector which is then passed through a linear layer to predict the result of the target lab test:
where w is the gradient vector of the transformation function in the linear layer. Since the prediction of lab test result is a regression task, our objective function is to minimize the square of the error defined as follows:
where T is the total number of visits, ˆ yi and yi are the predicted and ground-truth lab test result for the ith visit.
3.3 Influential Factors
The design of our system allows us to identify the factors that have influenced the predicted value ˆ yT of the target lab test. Let w = wr ‖ wc ‖ wf where wr , wc , and wf are the sub-vectors of the linear transformation w in Equation 10 corresponding to patient representation rT-1, lab interaction c, and past lab test results fT-1 respectively.
Then the influence of each diagnosis for the past visits is given by:
where adT-1 is the average of attention weights across all the heads and layers of the encoders in the transformer for the diagnosis information for time T -1, adT-1 [i] is the ith entry in adT-1 , Ed is the embedding matrix for diagnosis, and di[k] is the kth diagnosis in the ith visit.
Similarly, the influence of a patient's prescribed medication on the predicted lab test result is:
where amT-1 is the average of attention weights across all the heads and layers of the encoders in the transformer for the medication information for time T - 1, amT-1 [i] is the ith entry in amT-1 , Em is the embedding matrix for medication, mi[k] is the kth medication in the ith visit.
We obtain the influence of a patient's similarity with other patients as follows:
where asj is the average of attention weights across all heads and layers of GATv2 for node j, asj [k] is the kth entry in asj , Es is the average of embedding matrix Eb over all heads for the nodes in the weighted patient similarity graph, and nk is the one-hot vector of the node for the kth patient.
The influence of both positive and negative lab interactions
where apj and aqj are the averages of attention weights across all heads and layers of the GATv2 for the lab interaction graphs G+ and G- respectively for node j, apj [k] is the kth entry in apj and aqj [k] is the kth entry in aqj , Ep and Eq are the average of embedding matrices Eb+ and Eb- over all heads in G+ and G- respectively, and vk is the one-hot vector of the kth node in the graphs.
Finally, the influence of a patient's past lab test responses is given by:
We normalize all these influences and rank them to obtain the top factors that could have influenced the prediction of the target lab test response.
4 Performance Study
We implemented KALP in PyTorch and trained the models on two NVIDIA Titan RTX GPU. We adopt the widely used metrics for evaluation namely, root mean square error (RMSE), mean absolute error (MAE), and mean absolute percentage error (MAPE). The following datasets are used:
MIMIC-III [Johnson et al., 2016]. This is the largest publicly available EHR dataset which contains clinical data for 7870 neonates (infants) and 38,597 adults admitted to ICU between 2001 and 2008, and captures attributes such as lab reports, medications, etc.
PRIVATE. This is a 10-year outpatient proprietary dataset. Compared to the inpatient MIMIC III, the number of diagnosis per patient is fewer in this dataset.
In our experiments, the target lab test is HbA1c. We filter out the patients who have less than two HbA1c results and perform 10 fold cross validation. We compare KALP with the following baselines:
- Previous Value (PV). The predicted lab response for the current visit is given by the previous visit.
- Linear Regression (LR). This is the least square method based linear regression.
- Nearest Neighbour (NN). The lab test response of the most similar patient is used.
- RNN [Kang, 2018]. This method employs gated recurrent neural networks to predict lab test results.
- DMNC [Le et al., 2018]. We adapt this dual memory neural computer to predict lab test response taking into account demographics, medication, and diagnosis.
- HiTANet [Luo et al., 2020]. We adapt HiTANet to use demographics, medication, and diagnosis to predict lab response.
- BEHRT [Li et al., 2020]. We adapt BEHRT to use medication in addition to diagnosis and demographics for lab response prediction.
Table 1 shows that KALP outperforms all baselines on both MIMIC-III and PRIVATE. The one-way ANOVA [Fisher, 1992] test shows that the improvements are statistically significant with p-values < 0.05. Compared to DMNC and BEHRT which model only sequential dependency of a patient's visits over time, our knowledge augmented approach dramatically widens the performance gap. This suggests that incorporating similar patients, lab interactions and past lab test responses is effective in reducing the prediction errors.
Table 2 shows the performance after medication titration. Here, we use a subset of the patients whose medications have dosage changes between visits. All the methods show an increase in the prediction errors compared to Table 1 as it is difficult to predict the lab test results for these patients which may not follow the general trend after titration. Despite this, KALP has the lowest prediction errors demonstrating its applicability in the real world for chronic disease management.
Additional ablation study shows that not using any medication or patient similarity information leads to the highest RMSE, MAE, and MAPE on both datasets.
5 Case Study
Finally, we present a case study from PRIVATE to show how KALP is able to identify the top influential factors that led to its lab result predictions. Figure 4 shows a chronic diabetic patient with HbA1c ranging between 5.4 and 6.5. KALP predicts the HbA1c with an error margin of 0.2 while the stateof-the-art BEHRT has an error margin as large as 0.7 (see Visit 4). On Visit 3 where the ground truth HbA1c is 5.4, KALP predicts the HbA1c to be 5.5 while BEHRT predicts it to be 5.1. The top influential factor for this prediction is the past lab response, highlighting the need to take into consideration patients' past responses to personalize the prediction. For Visit 4, we again see that KALP is able to predict the rise in the HbA1c value to within 0.1 of the ground truth value compared to BEHRT. A closer examination reveals that there is a reduction in the dosage of Glipizide on Visit 3 and KALP has correctly attributed the top influential factor for this prediction to be the reduction in Glipizide dosage.
| Methods | MIMIC-III | PRIVATE | |||
|---|---|---|---|---|---|
| RMSE MAE | MAPE | RMSE | MAE | MAPE | |
| 2.39 ± 0.21 | 1.91 ± 0.19 | 14.47 ± 2.51 | 2.08 ± 0.17 | 1.95 ± 0.19 | PV 13.22 ± 2.18 |
| 2.91 ± 0.25 | 2.52 ± 0.27 | 18.26 ± 2.76 | 2.38 ± 0.21 | 2.05 ± 0.20 | LR 15.34 ± 2.45 |
| 2.61 ± 0.20 | 2.18 ± 0.21 | 16.58 ± 2.57 | 2.11 ± 0.19 | 1.94 ± 0.17 | NN 14.48 ± 2.33 |
| 2.37 ± 0.18 | 1.88 ± 0.19 | 2.04 ± 0.17 | 1.72 ± 0.15 | 12.53 ± 2.13 | RNN 14.04 ± 2.21 |
| 1.95 ± 0.16 | 1.67 ± 0.15 | 1.83 ± 0.15 | 1.55 ± 0.12 | 10.64 ± 2.01 | DMNC 13.19 ± 2.08 |
| 1.89 ± 0.17 | 1.51 ± 0.15 | 1.72 ± 0.14 | 1.43 ± 0.11 | 9.52 ± 1.93 | HiTANet 12.37 ± 2.11 |
| 1.57 ± 0.14 | 1.38 ± 0.13 | 11.28 ± 1.95 | 1.41 ± 0.11 1.24 | ± 0.13 8.49 ± 1.82 | BEHRT |
| 1.15 ± 0.11* | 0.80 ± 0.10* | 6.87 ± 1.63* | 0.85 ± 0.09* | 0.69 ± 0.07* | KALP 3.42 ± 1.47* |
| Methods | MIMIC-III | PRIVATE | ||||
|---|---|---|---|---|---|---|
| RMSE | MAE | MAPE | RMSE | MAE | MAPE | |
| PV | 4.16 ± 0.23 | 3.73 ± 0.21 | 23.11 ± 2.61 | 3.91 ± 0.24 | 3.27 ± 0.21 | 20.52 ± 2.32 |
| LR | 4.56 ± 0.31 | 3.98 ± 0.28 | 24.03 ± 2.89 | 4.05 ± 0.29 | 3.43 ± 0.26 | 21.04 ± 2.67 |
| NN | 4.12 ± 0.28 | 3.69 ± 0.27 | 22.45 ± 2.77 | 3.87 ± 0.24 | 3.22 ± 0.22 | 20.26 ± 2.51 |
| 3.62 ± 0.25 | 3.26 ± | 0.26 | 20.64 ± 2.64 | 3.34 ± 0.23 | 3.01 ± 0.21 | RNN 19.16 ± 2.39 |
| DMNC 3.18 ± 0.22 | 2.76 ± | 0.23 | 19.01 ± 2.55 | 2.89 ± 0.21 | 2.33 ± 0.20 | 17.02 ± 2.25 |
| 3.08 ± 0.19 | 2.75 ± 0.15 | 18.41 ± 2.41 | 2.65 ± 0.18 | 2.19 ± 0.17 | HiTANet 16.18 ± 2.21 | |
| BEHRT 2.65 ± 0.18 | 2.39 ± 0.17 | 17.70 ± 2.43 | 2.26 ± 0.16 | 2.02 ± 0.15 | 15.02 ± 2.23 | |
| KALP | 1.85 ± 0.13* | 1.34 ± 0.12* | 10.28 ± 2.13* | 1.27 ± 0.10* | 1.10 ± 0.11* | 8.18 ± 1.96* |
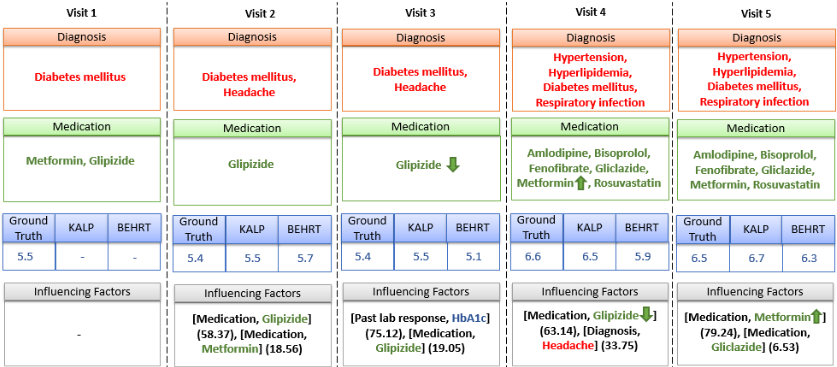
Figure 4: Predicted and ground truth HbA1c. Influencing factors are obtained from KALP. Blue depicts HbA1c values, red depicts diagnosis, and green depicts medication. ⇓ and ⇑ depict decrease and increase of dosage respectively.
6 Conclusion
In this work, we have described a personalized lab test result prediction approach that learns a strong patient representation incorporating both patient information accumulated over the visits as well as information from similar patients. This representation captures fine-grained dosage information enabling us to adjust the prediction in response to changes in treatment regime, which is often needed in the management of chronic patient care. To the best of our knowledge, KALP is the only system that takes into account dosage information when making lab test predictions. Experimental results on two real-world datasets demonstrate the effectiveness of KALP in providing predictions that are close to the actual lab results. Future work includes extending KALP to incorporate the severity and frequency of lab interactions, while jointly modeling the plethora of multi-modal EHR information.
Acknowledgements
This research/project is supported by the National Research Foundation, Singapore under its AI Singapore Programme (AISG Award No: AISG-GC-2019-001-2A). Any opinions, findings and conclusions or recommendations expressed in this material are those of the author(s) and do not reflect the views of National Research Foundation, Singapore.
@inproceedings{ijcai2022p699,
  title     = {Chronic Disease Management with Personalized Lab Test Response Prediction},
  author    = {Bhoi, Suman and Lee, Mong Li and Hsu, Wynne and Fang, Hao Sen Andrew and Chuan Tan, Ngiap},
  booktitle = {Proceedings of the Thirty-First International Joint Conference on
               Artificial Intelligence, {IJCAI-22}},
  publisher = {International Joint Conferences on Artificial Intelligence Organization},
  editor    = {Luc De Raedt},
  pages     = {5038--5044},
  year      = {2022},
  month     = {7},
  note      = {AI for Good},
  doi       = {10.24963/ijcai.2022/699},
  url       = {https://doi.org/10.24963/ijcai.2022/699},
}
TY - CPAPER TI - Chronic Disease Management with Personalized Lab Test Response Prediction AU - Bhoi, Suman AU - Lee, Mong Li AU - Hsu, Wynne AU - Fang, Hao Sen Andrew AU - Chuan Tan, Ngiap T2 - Proceedings of the Thirty-First International Joint Conference on Artificial Intelligence, IJCAI-22 PB - International Joint Conferences on Artificial Intelligence Organization PY - 2022 SP - 5038 EP - 5044 DO - 10.24963/ijcai.2022/699 UR - https://doi.org/10.24963/ijcai.2022/699 ER -Copied
Machine-readable versions of this paper, for tools and AI agents:





