
Experimental Comparison and Survey of Twelve Time Series Anomaly Detection Algorithms (Extended Abstract)
Proceedings of the Thirty-First International Joint Conference on Artificial Intelligence. Journal Track. Pages 5737-5741.
https://doi.org/10.24963/ijcai.2022/801
Keywords
- Data Mining: Anomaly/Outlier Detection
- Machine Learning: Time-series; Data Streams
- Machine Learning: Applications
Abstract
The existence of an anomaly detection method that is optimal for all domains is a myth. Thus, there exists a plethora of anomaly detection methods which increases every year for a wide variety of domains. But a strength can also be a weakness; given this massive library of methods, how can one select the best method for their application? Current literature is focused on creating new anomaly detection methods or large frameworks for experimenting with multiple methods at the same time. However, and especially as the literature continues to expand, an extensive evaluation of every anomaly detection method is simply not feasible. To reduce this evaluation burden, we present guidelines to intelligently choose the optimal anomaly detection methods based on the characteristics the time series displays such as seasonality, trend, level change concept drift, and missing time steps. We provide a comprehensive experimental validation and survey of twelve anomaly detection methods over different time series characteristics to form guidelines based on several metrics: the AUC (Area Under the Curve), windowed F-score, and Numenta Anomaly Benchmark (NAB) scoring model. Applying our methodologies can save time and effort by surfacing the most promising anomaly detection methods instead of experimenting extensively with a rapidly expanding library of anomaly detection methods, especially in an online setting.
- [Campos and others, 2016] Guilherme O Campos et al. On the evaluation of unsupervised outlier detection: measures, datasets, and an empirical study. Data Mining and Knowl- edge Discovery, 30(4):891-927, 2016.
- [Chandola and others, 2009] Varun Chandola et al. Anomaly detection: A survey. ACM computing surveys (CSUR), 41(3):15, 2009.
- [Cleveland and others, 1990] Robert B Cleveland et al. Stl: A seasonal-trend decomposition. Journal of Official Statis- tics, 6(1):3-73, 1990.
- [Cook and others, 2019] Andrew Cook et al. Anomaly de- tection for iot time-series data: A survey. IEEE Internet of Things Journal, 2019.
- [Demšar, 2006] Janez Demšar. Statistical comparisons of classifiers over multiple data sets. Journal of Machine learning research, 7(Jan):1-30, 2006.
- [Emmott and others, 2015] Andrew Emmott et al. A meta- analysis of the anomaly detection problem. arXiv preprint 1503.01158, 2015.
- [Feremans and others, 2019] Len Feremans et al. Pattern- based anomaly detection in mixed-type time series. In Joint European Conference on Machine Learning and Knowledge Discovery in Databases, pages 240-256. Springer, 2019.
- [Freeman et al., 2021] Cynthia Freeman, Jonathan Merri- man, Ian Beaver, and Abdullah Mueen. Experimental comparison and survey of twelve time series anomaly de- tection algorithms. Journal of Artificial Intelligence Re- search, 72:849-899, 2021.
- [Gupta and others, 2014] Manish Gupta et al. Outlier de- tection for temporal data: A survey. IEEE Transactions on Knowledge and Data Engineering, 26(9):2250-2267, 2014.
- [Hawkins and others, 2010] Jeff Hawkins et al. Hierarchi- cal temporal memory including htm cortical learning al- gorithms. White Paper, Numenta, Inc, Palto Alto, 2010.
- [Haykin, 2002] Simon Haykin. Adaptive Filter Theory (Fourth Edition).
- [Hochenbaum and others, 2017] Jordan Hochenbaum et al. Automatic anomaly detection in the cloud via statistical learning. arXiv preprint 1704.07706, 2017.
- [Hodge and Austin, 2004] Victoria Hodge and Jim Austin. A survey of outlier detection methodologies. Artificial intel- ligence review, 22(2):85-126, 2004.
- [Hyndman and others, 2015] Rob J Hyndman et al. Large- scale unusual time series detection. In Data Mining Work- shop (ICDMW), 2015 IEEE International Conference on, pages 1616-1619. IEEE, 2015.
- [Hyndman, 2018] Rob J Hyndman. Anomalous. https: //github.com/robjhyndman/anomalous, 2018. Accessed: 2021-11-01. Link
- [Keogh, 2006] Eamonn Keogh. A decade of progress in in- dexing and mining large time series databases. In Proceed- ings of the 32nd international conference on Very large data bases, pages 1268-1268. VLDB Endowment, 2006.
- [Laptev and others, 2015] Nikolay Laptev et al. Generic and scalable framework for automated time-series anomaly de- tection. In Proceedings of the 21th ACM SIGKDD Inter- national Conference on Knowledge Discovery and Data Mining, pages 1939-1947. ACM, 2015.
- [Makridakis and others, 2018] Spyros Makridakis et al. Sta- tistical and machine learning forecasting methods con- cerns and ways forward. PloS one, 13(3), 2018.
- [Numenta, 2017] Numenta. Anomaly labeling instructions. https://drive.google.com/file/d/ 0B1 XUjaAXeV3YlgwRXdsb3Voa1k/view, 2017. Accessed: 2021-11-21. Link
- [Numenta, 2018] Numenta. The numenta anomaly bench- mark. https://github.com/numenta/NAB, 2018. Accessed: 2021-11-21. Link
- [Saurav and others, 2018] Sakti Saurav et al. Online anomaly detection with concept drift adaptation using re- current neural networks. In Proceedings of the ACM India Joint International Conference on Data Science and Man- agement of Data, pages 78-87. ACM, 2018.
- [Tan and others, 2011] Swee Chuan Tan et al. Fast anomaly detection for streaming data. In Twenty-Second Interna- tional Joint Conference on Artificial Intelligence, 2011. IJCAI
- [Taylor and Letham, 2018] Sean J Taylor and Benjamin Letham. Forecasting at scale. The American Statistician, 72(1):37-45, 2018. [Twitter, 2015] Twitter. Anomalydetection. https://github. com/twitter/AnomalyDetectionc, 2015. Accessed: 2021- 11-01. Link
- [Wu, 2016] Hu-Sheng Wu. A survey of research on anomaly detection for time series. In 2016 13th International Com- puter Conference on Wavelet Active Media Technology and Information Processing (ICCWAMTIP), pages 426- 431. IEEE, 2016.
- [Xu and others, 2018] Haowen Xu et al. Unsupervised anomaly detection via variational auto-encoder for sea- sonal kpis in web applications. In Proceedings of the 2018 World Wide Web Conference on World Wide Web, pages 187-196. International World Wide Web Confer- ences Steering Committee, 2018.
- [Yeh and others, 2018] Chin-Chia Michael Yeh et al. Time series joins, motifs, discords and shapelets: a unifying view that exploits the matrix profile. Data Mining and Knowledge Discovery, 32(1):83-123, 2018.
References were extracted automatically from the PDF and may contain errors.
Full text extracted automatically from the PDF; figures, tables and equations may differ. The PDF is the version of record.
1 Introduction
Time series are used in almost every field: intrusion and fraud detection, tracking key performance indicators (KPIs), the stock market, and medical sensor technologies. One important use of time series is the detection of anomalies for ensuring undisrupted business, efficient troubleshooting, or, in the case of medical sensor technologies, lower the mortality rate. However, time series anomaly detection is a notoriously difficult problem for a multitude of reasons:
∗Originally published at the Journal of Artificial Intelligence Research
†Contact Author
- What is anomalous? An anomaly in a time series is a pattern that does not conform to past patterns of behavior in the series. What is defined as anomalous may differ based on application. The existence of a one-sizefits-all anomaly detection method that is optimal for all domains is a myth [Laptev and others, 2015]. In addition, inclusion of contextual variables may change initial perceptions of what is anomalous.
- Online anomaly detection. Anomaly detection often must be done on real-world streaming applications. Strictly speaking, an online anomaly detection method must determine anomalies and update all relevant models before occurrence of the next time step [Saurav and others, 2018]. Depending on the needs of the user, it may be acceptable to detect anomalies periodically. Regardless, efficient anomaly detection is vital which presents a challenge.
- Lack of labeled data. It is unrealistic to assume that anomaly detection systems will have access to thousands of tagged datasets. In addition, given the online requirement of many such systems, it can be easy to encounter anomalous (or not anomalous) behavior that was not present in the training set.
- Data imbalance. As an anomaly is a pattern that does not conform to past patterns of behavior, nonanomalous data tends to occur in much larger quantities than anomalous data. This can present a problem for a machine learning classifier approach to anomaly detection as the classes are not represented equally. Thus, an accuracy measure might present excellent results, but the accuracy is only reflecting the unequal class distribution in the data (the accuracy paradox).
- Minimize False Positives. It is important to detect anomalies as accurately and efficiently as possible, but minimizing false positives is also of great necessity to avoid alarm fatigue. Alarm fatigue can lead to a serious alert being overlooked and wasted time in checking for problems when there are none.
- What should I use? There is a massive wealth of anomaly detection methods to choose from [Campos
and others, 2016; Emmott and others, 2015; Wu, 2016; Cook and others, 2019; Chandola and others, 2009; Hodge and Austin, 2004].
Because of these difficulties inherent in time series anomaly detection, we believe there is a strong need for a comprehensive experimental comparison which can: 1 Survey the landscape and demonstrate which anomaly detection methods are more promising given different types of time series characteristics such as seasonality, trend, level change concept drift, or missing time steps. 2 Highlight the differences between various scoring methodologies. 3 Reveal omissions in the anomaly detection methods themselves.
We present guidelines for automating the classification of univariate time series and choice of anomaly detection method based on the characteristics the time series possesses. For example, if the time series in a user's application exhibits concept drift and no seasonality, which anomaly detection method would perform best? We make these analysis by conducting a thorough experimental comparison of a wide range of anomaly detection methods and evaluate them using both windowed F-scores, AUC (Area Under the receiver operating characteristic Curve), and NAB [Numenta, 2017] (Numenta Anomaly Benchmark) scores. Anomaly detection often must be done on real-world streaming applications. Thus, we include the time it took to train the methods as well as detection. Finally, in experimentally testing anomaly detection methods on a wide variety of datasets, we reveal areas where many of these methods are lacking but are not brought to light. For example, Twitter ANOMALYDETECTION VEC can only be used with seasonal datasets.
2 Methods
We ether re-implemented or used existing libraries to test 12 different anomaly detection methods. 1 These 12 anomaly detection methods include: 1 Windowed Gaussian [Numenta, 2018], 2 SARIMAX (Seasonal AutoRegressive Integrated Moving Average), 3 Facebook Prophet [Taylor and Letham, 2018], 4 ANOMALOUS [Hyndman, 2018; Hyndman and others, 2015], 5 GLiM (Generalized Linear Models) [Haykin, 2002], 6 STL (Seasonal and Trend Decomposition Using LOESS) [Cleveland and others, 1990] residual thresholding, 7 Twitter AD (Anomaly Detection) [Twitter, 2015; Hochenbaum and others, 2017], 8 Matrix Profile [Yeh and others, 2018], 9 VAE (Variational Auto-Encoders) Donut [Xu and others, 2018], 10 HS (Half-space) Trees [Tan and others, 2011], 11 PBAD (Pattern-Based Anomaly Detection) [Feremans and others, 2019], and 12 HTM (Hierarchical Temporal Memory Networks) [Hawkins and others, 2010].
Additionally, for every time series characteristic (seasonality, trend, concept drift, and missing time steps), we create a corpus of 10 datasets each containing this characteristic. Some datasets come from the Numenta Anomaly Benchmark repository [Numenta, 2018] which consists of 58 preannotated datasets across a wide variety of domains and scripts for evaluating online anomaly detection algorithms.
1 See https://github.com/dn3kmc/jair anomaly detection for all source code implementations and datasets.
Meticulous annotation instructions for Numenta's datasets are available [Numenta, 2017]. The Numenta Anomaly Benchmark repository also contains code for combining labels from multiple annotators to obtain ground truth. In cases where we do not use Numenta datasets, we have computer science undergraduate students from Eastern Washington University tag the datasets for anomalies following the Numenta instructions.
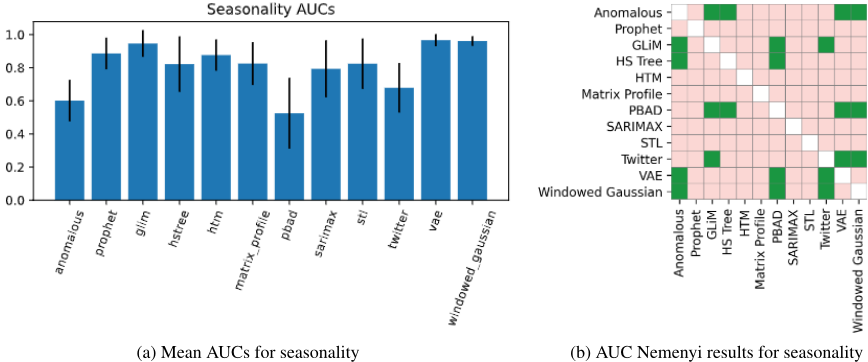
We test the 12 anomaly detection methods on the different time series characteristics. For example, we could determine how well Anomalous performs on seasonality by observing its results on the seasonality corpus: the 10 time series datasets all exhibiting seasonality. To demonstrate, in Figure 1a, we consider the time series characteristic of seasonality and the AUC. For every anomaly detection method, we obtain its mean AUC from all the datasets comprising a characteristic corpus. To determine Anomalous' abilities on seasonality, we obtain Anomalous' AUCs on every dataset in the seasonality corpus and determine the mean of those selected AUCs. However, to determine if there truly are significant differences between the bars in Figure 1a, we then conduct the Friedman average rank test [Demˇsar, 2006], a nonparameteric test similar to ANOVA, on AUCs; rejecting the null hypothesis means that there is a difference between the methods. We observe that there are indeed statistically significant differences as determined by the Friedman average rank test between anomaly detection methods for all characteristics under multiple scoring methodologies (AUC, windowed F-scores, and NAB). If the null hypothesis is rejected we follow with the post-hoc Nemenyi test where we can then actually compare every pair of anomaly detection methods. Using Figure 1a, we can determine the rank of the anomaly detection methods for example, PBAD is in 12th place. Given N datasets and k anomaly detection methods, for every two anomaly detection methods, the difference between their average ranks is ω, and if ω > qα ∗ √ k(k+1) 6N , then the performance of the two algorithms is significantly different where qα is the studentized range statistic divided by √2.
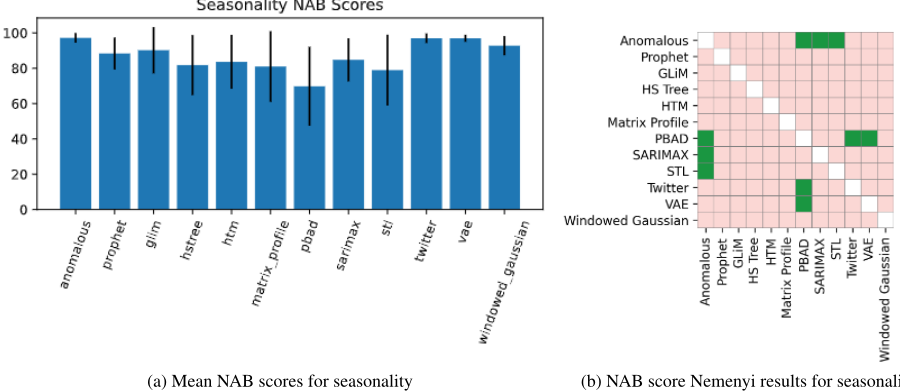
We repeat the above statistical significance and rank tests using mean Windowed F-scores in Figures 2a and 2b and the NAB scores in Figures 3a and 3b.
3 Discussion
What kind of conclusions about seasonality can we draw from these plots? We can not only analyze the performance of anomaly detection methods on time series characteristics but also compare the scoring methodologies themselves. For example, NAB's reward for early detection may be so great that it overrides the presence of many false positives and can make it difficult to compare different methods. As another example, the AUC is a classification-threshold-invariant evaluation method which is not always desirable especially in applications that may want to minimize certain types of errors like false positives. ROCs are also not highly sensitive to false positives due to the large number of real negatives typically prevalent in anomaly detection tasks.
The performance of the anomaly detection methods on the seasonality corpus as determined by the AUC is shown in Figure 1a. The Friedman test conducted on the AUCs confirmed a statistically significant difference between the methods on the seasonality corpus. A post-hoc Nenenyi test is conducted in Figure 1b showing that ANOMALOUS is outperformed by the Windowed Gaussian, VAE, HS Tree, and GLiM. GLiM outperforms Twitter and PBAD. HS Tree, Windowed Gaussian, and VAE all outperform PBAD. The Windowed Gaussian and VAE outperform Twitter.
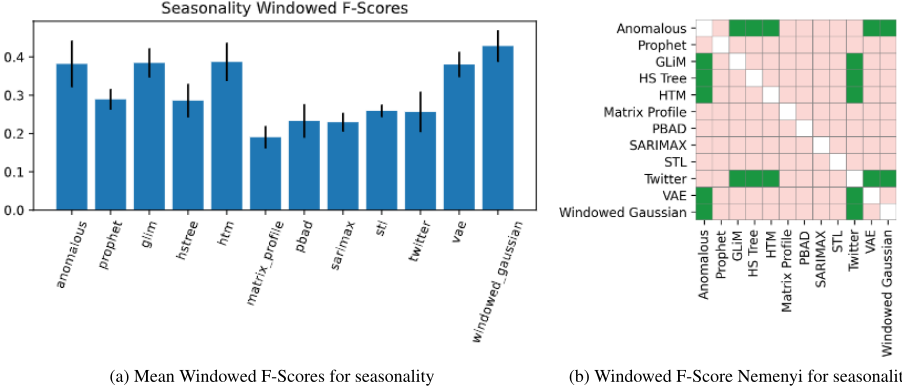
As for Windowed F-Scores on the seasonality corpus (see Figures 2a and 2b), there is a statistically significant difference between the methods also. A post-hoc Nemenyi test shows that ANOMALOUS is outperformed by the Windowed Gaussian, HTM, and GLiM. ANOMALOUS, however, outperforms VAE and HS Tree. Windowed Gaussian, VAE, GLiM, HS Tree, and HTM all outperform Twitter
As for NAB scores on the seasonality corpus (see Figures 3a and 3b), there is a statistically significant difference between the methods as well. A post-hoc Nemenyi test shows that ANOMALOUS outperforms STL, SARIMAX, and PBAD. PBAD is outperformed by VAE and Twitter.
As can be seen by these bar charts and Nemenyi tests, the performance of methods can change drastically based on the evaluation method. For example, ANOMALOUS is ranked in 11th place under the AUC but 1st place under NAB. With ANOMALOUS, a subseries that is considered anomalous will predict the first point in the subseries as anomalous. So the anomaly typically occurs latter in the subseries. Thus, the prediction is made early; NAB rewards early detection.
Considering the AUC and windowed F-score performance, a simple methodology such as the Windowed Gaussian or GLiM can perform very well; they are both ranked in the top three methods for the AUC and windowed F-score evaluation methods (Figures 1a and 2a). Under the windowed F-score, both outperform VAE, but under the AUC, they are outperformed by VAE. The VAE is a complex model with many parameters, but the simple sliding Gaussian detector or generalized linear model can compete. This confirms analysis [Makridakis and others, 2018] where it is shown that machine learning and deep learning often struggle to outperform classical statistical time series forecasting approaches.
Of interest is which methods cannot handle non-seasonal time series or time series with small periodicities. Twitter AD VEC cannot handle time series with periodicity = 1 whereas STL Residual Thresholding requires periodicity to be 4 or higher due to usage of R STLPLUS.
In our JAIR article [Freeman et al., 2021] we repeat the above experiments on datasets expressing the remaining time series characteristics of trend, concept drift, and missing time steps. We also analyze the complexity and report on training and prediction times, vital in real-time settings.
4 Conclusion
Instead of performing an extensive literature review and trying every anomaly detection method in a rapidly expanding library [Gupta and others, 2014; Wu, 2016], we observe characteristics present in the data and narrow the choice down to a smaller class of promising anomaly detection methods.
Time series are being created at an unprecedented scale [Keogh, 2006] and are used in a wide variety of domains. This huge increase in available data makes it difficult to detect anomalies, especially as the number of anomaly detection methods increases every year. In our view, although it is important to generate new anomaly detection methods, this is daunting for those who want to choose from the assortment of existing methods, especially as a one-size-fits-all method is a myth. It is our hope that our experiments and analysis will serve those individuals.
@inproceedings{ijcai2022p801,
  title     = {Experimental Comparison and Survey of Twelve Time Series Anomaly Detection Algorithms (Extended Abstract)},
  author    = {Freeman, Cynthia and Merriman, Jonathan and Beaver, Ian and Mueen, Abdullah},
  booktitle = {Proceedings of the Thirty-First International Joint Conference on
               Artificial Intelligence, {IJCAI-22}},
  publisher = {International Joint Conferences on Artificial Intelligence Organization},
  editor    = {Luc De Raedt},
  pages     = {5737--5741},
  year      = {2022},
  month     = {7},
  note      = {Journal Track},
  doi       = {10.24963/ijcai.2022/801},
  url       = {https://doi.org/10.24963/ijcai.2022/801},
}
TY - CPAPER TI - Experimental Comparison and Survey of Twelve Time Series Anomaly Detection Algorithms (Extended Abstract) AU - Freeman, Cynthia AU - Merriman, Jonathan AU - Beaver, Ian AU - Mueen, Abdullah T2 - Proceedings of the Thirty-First International Joint Conference on Artificial Intelligence, IJCAI-22 PB - International Joint Conferences on Artificial Intelligence Organization PY - 2022 SP - 5737 EP - 5741 DO - 10.24963/ijcai.2022/801 UR - https://doi.org/10.24963/ijcai.2022/801 ER -Copied
Machine-readable versions of this paper, for tools and AI agents:





