
Imbalanced Node Classification Beyond Homophilic Assumption
Proceedings of the Thirty-Second International Joint Conference on Artificial Intelligence. Main Track. Pages 7206-7214.
https://doi.org/10.24963/ijcai.2023/848
Keywords
- Machine Learning: ML: Learning graphical models
- Data Mining: DM: Class imbalance and unequal cost
- Data Mining: DM: Mining graphs
Abstract
Imbalanced node classification widely exists in real-world networks where graph neural networks (GNNs) are usually highly inclined to majority classes and suffer from severe performance degradation on classifying minority class nodes. Various imbalanced node classification methods have been proposed recently which construct synthetic nodes and edges w.r.t. minority classes to balance the label/topology distribution. However, they are all based on homophilic assumption that nodes of the same label tend to connect despite the widely existence of heterophilic edges in real-world graphs. Thus, they uniformly aggregate features from both homophilic and heterophilic neighbors and rely on feature similarity to generate synthetic edges, which cannot be applied to imbalanced graphs in high heterophily. To address this problem, we propose a novel GraphSANN for imbalanced node classification on both homophilic and heterophilic graphs. Firstly, we propose a unified feature mixer to generate synthetic nodes with both homophilic and heterophilic interpolation in a unified way. Next, by randomly sampling edges between synthetic nodes and existing nodes as candidata edges, we design an adaptive subgraph extractor to dynamically extract the contextual subgraphs of candidate edges with flexible ranges. Finally, we develop a multi-filter subgraph encoder which constructs multiple different filter channels to discriminatively aggregate neighbors’ information along the homophilic and heterophilic edges. Extensive experiments on eight benchmark datasets demonstrate the superiority of our model for imbalanced node classificaiton on both homophilic and heterophilic graphs.
- [Abu-El-Haija et al., 2019] Sami Abu-El-Haija, Bryan Per- ozzi, Amol Kapoor, Nazanin Alipourfard, Kristina Ler- man, Hrayr Harutyunyan, Greg Ver Steeg, and Aram Gal- styan. Mixhop: Higher-order graph convolutional archi- tectures via sparsified neighborhood mixing. In inter- national conference on machine learning, pages 21-29. PMLR, 2019.
- [Bo et al., 2021] Deyu Bo, Xiao Wang, Chuan Shi, and Huawei Shen. Beyond low-frequency information in graph convolutional networks. In Proceedings of the AAAI Con- ference on Artificial Intelligence, volume 35, pages 3950- 3957, 2021.
- [Buda et al., 2018] Mateusz Buda, Atsuto Maki, and Ma- ciej A Mazurowski. A systematic study of the class im- balance problem in convolutional neural networks. Neural networks, 106:249-259, 2018.
- [Chawla et al., 2002] Nitesh V Chawla, Kevin W Bowyer, Lawrence O Hall, and W Philip Kegelmeyer. Smote: syn- thetic minority over-sampling technique. Journal of artifi- cial intelligence research, 16:321-357, 2002.
- [Chen et al., 2021] Deli Chen, Yankai Lin, Guangxiang Zhao, Xuancheng Ren, Peng Li, Jie Zhou, and Xu Sun. Topology-imbalance learning for semi-supervised node classification. Advances in Neural Information Process- ing Systems, 34:29885-29897, 2021.
- [Jin et al., 2021] Di Jin, Zhizhi Yu, Cuiying Huo, Rui Wang, Xiao Wang, Dongxiao He, and Jiawei Han. Universal graph convolutional networks. Advances in Neural Infor- mation Processing Systems, 34:10654-10664, 2021.
- [Kingma and Ba, 2014] Diederik P Kingma and Jimmy Ba. Adam: A method for stochastic optimization. arXiv preprint arXiv:1412.6980, 2014.
- [Kipf and Welling, 2017] Thomas N Kipf and Max Welling. Semi-supervised classification with graph convolutional networks. In International Conference on Learning Rep- resentations, 2017.
- [Liu et al., 2023] Jie Liu, Lingyun Song, Guangtao Wang, and Xuequn Shang. Meta-hgt: Metapath-aware hyper- graph transformer for heterogeneous information network embedding. Neural Networks, 157:65-76, 2023.
- [Luan et al., 2022] Sitao Luan, Chenqing Hua, Qincheng Lu, Jiaqi Zhu, Mingde Zhao, Shuyuan Zhang, Xiao-Wen Chang, and Doina Precup. Revisiting heterophily for graph neural networks. arXiv preprint arXiv:2210.07606, 2022.
- [Park et al., 2022] Joonhyung Park, Jaeyun Song, and Eunho Yang. Graphens: Neighbor-aware ego network synthesis for class-imbalanced node classification. In International Conference on Learning Representations, 2022.
- [Qu et al., 2021] Liang Qu, Huaisheng Zhu, Ruiqi Zheng, Yuhui Shi, and Hongzhi Yin. Imgagn: Imbalanced net- work embedding via generative adversarial graph net- works. In Proceedings of the 27th ACM SIGKDD Con- ference on Knowledge Discovery & Data Mining, pages 1390-1398, 2021.
- [Shi et al., 2020] Min Shi, Yufei Tang, Xingquan Zhu, David Wilson, and Jianxun Liu. Multi-class imbalanced graph convolutional network learning. In Proceedings of the Twenty-Ninth International Joint Conference on Artificial Intelligence (IJCAI-20), 2020. IJCAI
- [Shrikumar et al., 2017] Avanti Shrikumar, Peyton Green- side, and Anshul Kundaje. Learning important features through propagating activation differences. In Interna- tional conference on machine learning, pages 3145-3153.
- PMLR, 2017.
- [Sun et al., 2021a] Xiangguo Sun, Hongzhi Yin, Bo Liu, Hongxu Chen, Jiuxin Cao, Yingxia Shao, and Nguyen Quoc Viet Hung. Heterogeneous hypergraph embedding for graph classification. In Proceedings of the 14th ACM international conference on web search and data mining, pages 725-733, 2021.
- [Sun et al., 2021b] Xiangguo Sun, Hongzhi Yin, Bo Liu, Hongxu Chen, Qing Meng, Wang Han, and Jiuxin Cao. Multi-level hyperedge distillation for social linking pre- diction on sparsely observed networks. In Proceedings of the Web Conference 2021, pages 2934-2945, 2021.
- [Sundararajan et al., 2017] Mukund Sundararajan, Ankur Taly, and Qiqi Yan. Axiomatic attribution for deep net- works. In International conference on machine learning, pages 3319-3328. PMLR, 2017.
- [Van der Maaten and Hinton, 2008] Laurens Van der Maaten and Geoffrey Hinton. Visualizing data using t-sne. Journal of machine learning research, 9(11), 2008.
- [Veličković et al., 2018] Petar Veličković, Guillem Cucurull, Arantxa Casanova, Adriana Romero, Pietro Lio, and Yoshua Bengio. Graph attention networks. In Interna- tional Conference on Learning Representations, 2018.
- [Xia et al., 2021] Xin Xia, Hongzhi Yin, Junliang Yu, Yingxia Shao, and Lizhen Cui. Self-supervised graph co- training for session-based recommendation. In Proceed- ings of the 30th ACM International conference on informa- tion & knowledge management, pages 2180-2190, 2021.
- [Yu et al., 2020] Junliang Yu, Hongzhi Yin, Jundong Li, Min Gao, Zi Huang, and Lizhen Cui. Enhancing social recom- mendation with adversarial graph convolutional networks. IEEE Transactions on knowledge and data engineering, 34(8):3727-3739, 2020.
- [Yuan and Ma, 2012] Bo Yuan and Xiaoli Ma. Sampling+ reweighting: Boosting the performance of adaboost on im- balanced datasets. In The 2012 international joint confer- ence on neural networks (IJCNN), pages 1-6. IEEE, 2012.
- [Zhang and Chen, 2018] Muhan Zhang and Yixin Chen. Link prediction based on graph neural networks. Advances in neural information processing systems, 31, 2018.
- [Zhao et al., 2021] Tianxiang Zhao, Xiang Zhang, and Suhang Wang. Graphsmote: Imbalanced node classifica- tion on graphs with graph neural networks. In Proceedings of the 14th ACM international conference on web search and data mining, pages 833-841, 2021.
- [Zheng et al., 2022] Xin Zheng, Yixin Liu, Shirui Pan, Miao Zhang, Di Jin, and Philip S Yu. Graph neural networks for graphs with heterophily: A survey. arXiv preprint arXiv:2202.07082, 2022.
- [Zhou et al., 2022] Shijie Zhou, Zhimeng Guo, Charu Ag- garwal, Xiang Zhang, and Suhang Wang. Link predic- tion on heterophilic graphs via disentangled representation learning. arXiv preprint arXiv:2208.01820, 2022.
References were extracted automatically from the PDF and may contain errors.
Full text extracted automatically from the PDF; figures, tables and equations may differ. The PDF is the version of record.
1 Introduction
Graph Neural Networks (GNNs) successfully extend deep learning approaches to graph data and have exhibited powerful learning ability on node classification task [Kipf and Welling, 2017; Veliˇckovi´c et al., 2018; Liu et al., 2023]. Despite their effectiveness, most existing GNNs neglect the widely existing class-imbalance problem in real-world networks, where certain class(es) have significantly fewer node samples for training than other classes [Sun et al., 2021b]. For example, in online transaction networks, the majority of nodes are normal customers while only a small number are fraudsters; in molecular networks, there are much more lowmass atoms than high-mass atoms. Due to the dominating role of majority class nodes in the training set, classical GNNs are often highly inclined to majority classes, leading to severe performance degradation for minority node classification.
† Corresponding authors.
To address the class-imbalance problem in the node classification task, many methods have been proposed recently. They mainly relieve the imbalance problem by generating synthetic nodes for minority classes and further constructing synthetic edges between the generated nodes and the original nodes. For example, GraphSMOTE [Zhao et al., 2021] generates synthetic nodes by interpolating nodes of the same minority class through SMOTE [Chawla et al., 2002] and generates their linkages through a pre-trained edge generator. ImGAGN [Qu et al., 2021] also synthesizes minority class nodes and connects them to real minority class nodes through a generative adversarial network. GraphENS [Park et al., 2022] further synthesizes the whole ego networks for synthetic minority nodes based on information from both minority and majority classes.
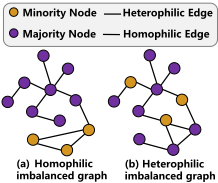
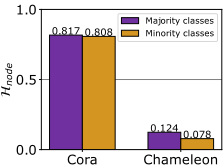
Although having acquired prominent performances on certain imbalanced datasets, these existing methods are based on the homophily assumption that edges tend to connect nodes of the same class label (Figure 1(a)). However, many investigations [Sun et al., 2021a; Yu et al., 2020] show that heterophilic connections which link nodes of different classes also widely exist in imbalanced graphs (Figure 1(b)). Existing imbalanced node classification methods suffer from three severe problems when applied to networks with a large portion of heterophilic connections. P1: Most existing methods generate synthetic nodes based on homophilic interpolation, which restricts interpolated node pairs to be the same minority class. This causes synthetic nodes to lack diversity when real minority class nodes are very limited. P2: Existing models mainly resort to node feature similarity for synthetic edge construction. This strategy works well for homophilic edges which connect nodes with similar features but fail in constructing heterophilic edges and would thus introduce structure bias (i.e., heterophilic/homophilic edge distribution drift). P3: Existing methods conduct uniform message passing for both homophilic and heterophilic edges when aggregating features, and consequently result in much noisy information from dissimilar neighbors derived from heterophilic edges to be aggregated into the target nodes. This would seriously degrade the quality of node embeddings and hurt the following node classification task.
In light of this, we propose a novel Subgraph-aware Adaptive Graph Neural Network (GraphSANN) for imbalanced node classification on both homophilic and heterophilic graphs. GraphSANN consists of three major components, i.e., unified feature mixer, adaptive subgraph extractor, and multi-filter subgraph encoder. Specifically, to tackle P1, GraphSANN first applies a unified feature mixer to carry out both homophilic and heterophilic interpolation in a unified way. Next, to tackle P2, instead of generating edges based on feature similarity, we propose an adaptive subgraph extractor to extract the surrounding subgraphs of candidate synthetic edges with flexible ranges. In this way, distant but similar nodes can be absorbed into the subgraph whose general structural information will be encoded to predict the existence of the edge. To tackle P3 and encode the subgraphs consisting of both homophilic and heterophilic connections, we design a multi-filter subgraph encoder to aggregate messages only from similar nodes instead of dissimilar ones by fusing the output messages of three distinct filters. Finally, after generating synthetic nodes/edges and attaching them to the original graph, we apply a multi-filter GNN as node classifier to encode the acquired balanced graph for node classification.
The major contributions of this work are stated as follows:
- To the best of our knowledge, this paper is the first work to tackle the imbalanced node classification problem beyond the homophilic assumption.
- We design a novel imbalanced node classification model GraphSANN which is able to build balanced graph by generating synthetic nodes and constructing both homophilic
- and heterophilic synthetic edges between generated and original nodes, and aggregates the information from homophilic and heterophilic neighbors discriminatively.
- Extensive experiments on eight benchmark datasets show that GraphSANN acquires superior performance on both imbalanced homophilic and heterophilic graphs.
2 RelatedWork
2.1 Heterophilic Graph Neural Networks
Since most existing GNNs follow the homophily assumption and thus face significant performance degradation on heterophilic graphs, heterophily-based GNNs have been proposed, which can be roughly categorized into two groups [Zheng et al., 2022]: (1) Neighbor extension methods which aim to expand local neighborhood to absorb features from distant but informative nodes. For example, MixHop [Abu-El-Haija et al., 2019] aggregates messages from multi-hop neighbors respectively and mixes them together through concatenation. UGCN [Jin et al., 2021] further restricts nodes from two-hop neighbors to have at least two different paths to the ego node. (2) Adaptive message aggregation methods which design adaptive aggregation operations to learn discriminative information from homophilic and heterophilic linkages. For example, FAGCN [Bo et al., 2021] adopts a self-gating attention mechanism to uniformly learn low-frequency and high-frequency signals from neighbors. ACM [Luan et al., 2022] further designs a linear combination of low-pass and high-pass filters to adaptively learn information from different filter channels.
2.2 Imbalanced Node Classification
Generally, imbalanced node classification methods can be divided into two groups, generic and network-specific methods. Generic ones directly combine general class-imbalance approaches (e.g. oversampling, re-weight, SMOTE [Chawla et al., 2002], etc.) with GNNs to graph data. For example, Oversampling [Buda et al., 2018] replicates existing node embeddings learned from GNNs to produce more minority node representations; Re-weight [Yuan and Ma, 2012] assigns larger penalty weights to minority nodes when computing training loss. Network-specific methods usually take account of the sophisticated topology of graphs to generate synthetic nodes and further determine the connections between the generated nodes and original nodes [Chen et al., 2021; Xia et al., 2021]. Among them, DR-GCN [Shi et al., 2020] utilizes class-conditional adversarial training to enhance the separation of different classes. GraphSMOTE [Zhao et al., 2021] interpolates nodes from minority classes as synthetic nodes and generates linkages through a pre-trained edge generator. ImGAGN [Qu et al., 2021] synthesizes minority nodes and connects them to original nodes through a generative adversarial network. GraphENS [Park et al., 2022] demonstrates the overfitting problem of neighbor memorization and proposes to generate the whole ego-networks for synthetic nodes based on information from all classes.
However, these models are all based on the homophily assumption and thus suffer from performance degradation when applied to networks with strong heterophily.
3 Notations and ProblemDefinition
Definition 1. Graph Homophily and Heterophily. Given a graph G = {V, E}, where V represents the node set, and for each edge e = (v, µ), v, µ ∈ V, if v and µ have the same class label, the edge e is homophilic. Otherwise, e is heterophilic. Most graphs have both homophilic and heterophilic edges at the same time. We define the node homophily Hnode and edge homophily Hedge to quantitatively measure the homophily degree of a graph as follows.
Based on the definitions of Hnode,Hedge ∈ [0, 1], the node heterophily and edge heterophily can be defined as 1-Hnode and 1 -Hedge, respectively. Graphs with strong homophily have higher Hnode and Hedge, and vice versa.
Problem Definition. Let G = {V, E,X} denote an attribute graph, where X ∈ R|V|×d is node feature matrix whose ith row represents a d-dimensional feature vector of the ith node. For node classification, each node is also associated with a one-hot node label Yi,: ∈ RC where C is the number of node classes. If the class size distribution is imbalanced, we name it as an imbalanced node classification problem. The imbalance ratio is defined as im ratio = minc(|Vc|) maxc(|Vc|) ≪ 1, where |Vc| denotes the node set with class label c ∈ {1, 2, · · · ,C}. Then, we give the formal definition of imbalanced node classification as follows.
Given an imbalanced graph G = {V, E,X} composed of both homophilic and heterophilic edges, our goal is to learn a node classifier f : f(V, E,X) → Y that can well classify both majority and minority classes and can be well generalized on graphs with either low or high heterophily.
4 Methodology
In this section, we introduce our novel GraphSANN for imbalanced node classification. As illustrated in Figure 2, GraphSANN consists of three core components, (1) Unified Feature Mixer which carries out both homophilic and heterophilic interpolation to generate synthetic nodes (Subsection 4.1); (2) Adaptive Subgraph Extractor which adaptively extracts subgraphs around candidate synthetic edges (Subsection 4.2) and (3) Multi-filter based subgraph encoder which encodes the subgraphs extracted from component (2) into edge score using multiple passes of filters (Subsection 4.3). Please refer to Algorithm 1 in the Appendix for the forward propagation procedure of GraphSANN . We elaborate on each component in the following subsections.
4.1 Unified Feature Mixer
Most existing class-imbalance models apply homophilic interpolation on existing node pairs < vs, vt > to generate synthetic nodes, which restricts vs and vt to be the nearest neighbors of the same minority class [Zhao et al., 2021;
Qu et al., 2021]. The generated nodes under this strategy suffer from feature diversity problem especially when original minority nodes are very limited [Park et al., 2022]. To address this problem, we propose a unified feature mixer that conducts both homophilic and heterophilic interpolation in a unified way, which consists of two steps: (1) unified node pair sampling and (2) integrated gradient based feature mixup.
Unified Node Pair Sampling
Before conducting feature mixup to generate synthetic minority nodes, we first sample node pairs < vs, vt > from the existing node set for interpolation. Here vs is sampled from minority classes while vt is from the entire classes, and thus it could have either the same or different class compared to vs, formed as Spair = {< vs, vt >| vs ∈ Vminor, vt ∈ V}. Let C = {1, 2, . . . , C} and CM ⊂ C be the entire class set and minority class set, the sampling distributions for vs and vt are denoted as vs ∼ ps(u | CM) and vt ∼ pt(u | C), respectively. To obtain a uniformly sampling vt from all the classes, we define ps and pt as follows:
It is straightforward to get that pt reaches the peak when |Vc| = 2 and gets 0 when |Vc| = 0 or |Vc| = ∞. In this way, even if the sizes of majority classes are significantly larger than minority classes, nodes from the entire classes have roughly equal chances to be sampled as vt. Here we use over-sampling scale ζ to control the amount of sampled node pairs.
Integrated Gradient based Feature Mixup
Afterward, we interpolate the raw features of each node pair < vs, vt > to generate synthetic nodes. Since vt is sampled beyond the same minority class as vs, we only preserve generic node attributes which are irrelevant to class prediction to avoid introducing distracting information. As introduced by [Sundararajan et al., 2017], integrating gradient can effectively evaluate the contributions of input features to the model prediction. Compared to directly using gradients to evaluate feature importance [Park et al., 2022], integrated gradient addresses the saturation and thresholding problems [Shrikumar et al., 2017] and can acquire more reliable feature importance. Specifically, the integrated gradient IGi(x) along the i-th dimension of input node feature x ∈ Rd is calculated as follows:
where y represents the vector of true class labels and Lcls denotes the node classification loss. Then, we compute the distance ψst between vs and vt by:
where Wp ∈ Rd×d′ represents the projection matrix, and xs and xt are raw attributes of vs and vt, respectively. We define ˆ ψst = 1 1+ψst ∈ [0, 1] as the similarity between vs and vt. Finally, we construct the masking vector Mt ∈ Rd as follows:
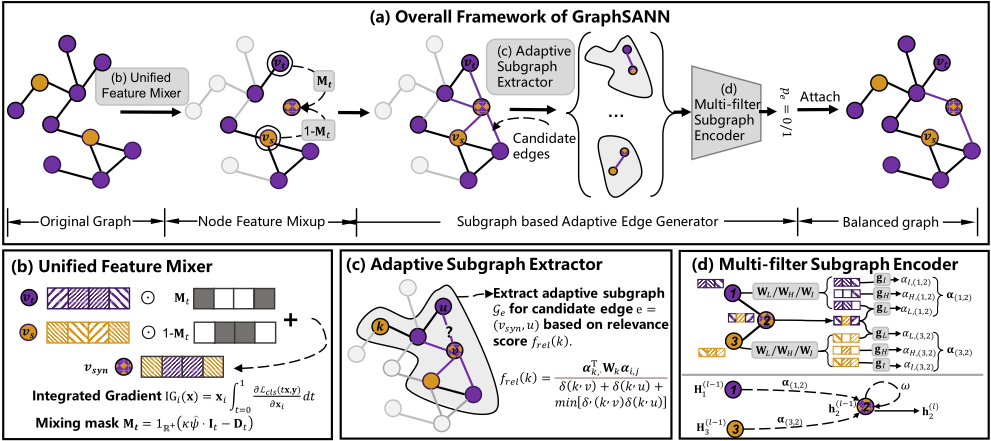
where It ∈ Rd is an all-ones vector, κ is a hyper-parameter, Dt = [IG1(xt), . . . , IGd(xt)] is the feature importance vector for xt, and 1R+(·) is an indicator function which returns 1 when the input is positive otherwise 0. Thus, the mixed feature xsyn of synthetic nodes is formulated as follows:
4.2 Adaptive Subgraph Extractor
After generating synthetic nodes vsyn ∈ Vsyn for the minority classes, we need to determine their connections to the original graph. The existence of an edge e = (vsyn, u) is highly related to the structural information embedded in its surrounding subgraph Ge = {Ve, Ee} regardless of its homophily or heterophily [Zhang and Chen, 2018]. Here, we first randomly sample connections between synthetic and original nodes as candidate edges, then we adaptively extract the subgraphs of candidate edges and finally encode their structure information to predict edge existence. Specifically, given the node pair set Spair and synthetic node set Vsyn, the candidate synthetic edge set Esyn is constructed as follows:
where N1(v) returns 1-hop neighbors of v and v itself, [·]ξ is random sampling with sampling ratio ξ. After obtaining Esyn, we extract the enclosing subgraph Ge for each e ∈ Esyn. Considering that nodes with high structural and semantic similarities might be distant from each other in heterophilic graphs, instead of fixing the subgraph to h-hop neighbors, we adaptively adjust the range of a subgraph based on a relevance score function frel(·). For any h-hop neighbor k ∈ Nh(v) ∪Nh(u), frel(k) is calculated as follows:
Where δ(k, v) is the length of shortest path from k to v, αk,i ∈ R3 represents the multi-pass weight vector between node k and i (further illustrated in Subsection 4.3). α(l) k,· is the mean value of all the coefficient vectors between k and its 1-hop neighbors, which reflects the homophily status of node k. Wk ∈ R3×3 is a weight matrix. Then we select top M nodes from frel(k) along with central nodes u and v to construct the enclosing subgraph. The M is calculated based on subgraph density: M = ⌈|Ve|(1+ 2|Ee| |Ve|(|Ve-1|) )⌉.
4.3 Multi-filter Subgraph Encoder
In this section, we propose a novel subgraph encoder to embed the subgraph surrounding a candidate edge e ∈ Esyn into a vector, and then predict whether the edge e should be generated or not based on that. Let Ge be the extracted enclosing subgraph of the candidate edge e. Considering the widely existing heterophilic connections in Ge, we design a multi-filter subgraph encoder that can discriminatively aggregate information from homophilic and heterophilic neighbors. Specifically, let h(l-1) u ∈ Rdl-1×1 denote the (l - 1)- th layer feature of node u ∈ Ge, h(0) u = [xu ∥ zu] where zu is one-hot labeling feature acquired by DRNL[Zhang and Chen, 2018]. We now compute the weight coefficients α(l) L,(u,k) , α(l) H,(u,k) , α(l) I,(u,k) which reflect the importance of different frequencies of signals as follows:
Where W(l) L ,W(l) H , W(l) I ∈ Rdl×dl-1 are the weight matrices that project h(l-1) u into low-frequency, high-frequency and identity messages, respectively. gT L ∈ R2dl×1 , gTH , gT I ∈ Rdl×1 are the convolutional vectors, σ(·) is the Sigmoid function. Then we compute weight vector α(l) (u,k) by normalizing the importance weights of different frequencies:
Next, we aggregate multi-frequency messages of neighbor nodes k with weight vector α(l) (u,k) to compute the central node embedding h(l) u :
Where ω is a hyper-parameter, h(L) u denotes the aggregated node embedding of node u ∈ Ge after stacking L-layer encoders. To acquire structural information from different orders of neighbors, we concatenate node embeddings from different layers and utilize a mean readout to compute the existence probability pe of subgraph Ge:
Where Wpool ∈ R1×(d1+...+dL) projects the latent embeddings into a scalar pe which reflects the existence probability of synthetic edge e. We remove the edges with low pe from Esyn based on threshold η and attach the rest of synthetic edges to the original graph to construct the adjacency matrix ˜A after over-sampling:
4.4 Optimization Objective
In this section, we introduce the optimization objective of our proposed GraphSANN for imbalanced node classification, which consists of two optimization tasks: 1) adjacency matrix reconstruction and 2) node classification.
| Datasets | Nodes | Edges | Features | Classes | Hedge | Hnode |
|---|---|---|---|---|---|---|
| Cora | 2,708 | 5,429 | 1,433 | 7 | 0.8100 | 0.8252 |
| Pubmed | 19,717 | 44,338 | 500 | 3 | 0.8024 | 0.7924 |
| Citeseer | 2,277 | 4,732 | 3,703 | 6 | 0.7362 | 0.7175 |
| Chameleon | 5,201 | 36,101 | 2,325 | 5 | 0.2795 | 0.2470 |
| Squirrel | 5,201 | 217,073 | 2,089 | 5 | 0.2416 | 0.2156 |
| Film | 7,600 | 33,544 | 931 | 5 | 0.2200 | 0.2400 |
| Amazon-CP | 13,381 | 245,778 | 767 | 10 | 0.7721 | 0.7853 |
| Amazon-PH | 7,487 | 119,043 | 745 | 8 | 0.8272 | 0.8365 |
Adjacency Matrix Reconstruction. We train our multi-filter subgraph encoder with an adjacency matrix reconstruction task. Let A denote the adjacency matrix of the original graph, and A(u, v) = 1 indicate the existence of an edge between u and v. Considering the sparsity of positive edges, we also adopt negative sampling [Zhou et al., 2022]. Specifically, for each positive edge A(u, v) = 1, we randomly sample an unlinked edge which makes A(u, m) = 0 as a negative sample and constructs a negative set M-. The loss function for adjacency matrix reconstruction is formed as follows:
where ˆA is the predicted adjacency matrix of original graph. Node classification. After attaching the synthetic nodes and edges to the original graph, we transform it into a balanced network. Since the balanced graph can also be heterophilic, we adopt the multi-filter graph encoder introduced in 4.3 as node classifier by replacing the readout procedure with a onelayer MLP followed by Softmax:
The output dimension of MLP(·) is equal to class number C. The loss function of node classification is defined as follows:
The overall objective function is then formed as follows with λ ∈ (0, 1]:
5 Experiment
In this section, we conduct extensive experiments on eight public datasets to evaluate the effectiveness of GraphSANN, which aim to answer five research questions: RQ1: How does GraphSANN perform compared to other baselines in imbalanced node classification on both homophilic and heterophilic graphs? RQ2: How effective is GraphSANN under different imbalance ratios? RQ3: How does each core component of GraphSANN contribute to the performance gain? RQ4: How do different hyper-parameter values affect the performance of GraphSANN ? RQ5: Can GraphSANN learn effective node representation to separate different classes of nodes in the embedding space?
| Method Hedge | Cora 0.8100 | Pubmed 0.8024 | Citeseer 0.7362 | Amazon-Computers 0.7721 | ||||||||
|---|---|---|---|---|---|---|---|---|---|---|---|---|
| Metrics(%) | ACC | F1 | AUC | ACC | F1 | AUC | ACC | F1 | AUC | ACC | F1 | AUC |
| GCN | 53.68±1.61 | 45.63±0.35 | 81.30±0.62 | 53.69±0.49 | 51.66±2.53 | 71.86±0.45 | 44.59±0.60 | 28.38±1.37 | 74.35±0.63 | 55.32±0.35 | 44.16±0.36 | 89.80±1.79 |
| ACM | 55.28±0.75 | 47.95±0.48 | 85.23±0.48 | 49.72±0.73 | 50.43±1.28 | 68.25±1.02 | 48.32±0.58 | 30.47±1.03 | 78.56±0.47 | 56.32±0.43 | 46.13±0.47 | 91.26±1.78 |
| OverSamp | 62.79±0.79 | 52.06±0.51 | 89.48±0.78 | 61.15±0.37 | 60.33±0.36 | 78.67±1.38 | 51.05±0.43 | 32.86±1.26 | 82.99±0.69 | 55.39±0.31 | 44.31±1.07 | 88.03 ± 1.59 |
| Re-weight | 63.16±1.53 | 52.39±0.32 | 90.16±0.51 | 62.21±0.44 | 61.12±0.54 | 79.02±2.41 | 50.91±0.35 | 32.79±0.65 | 82.86±1.38 | 56.78±0.69 | 48.12±1.25 | 91.12 ± 1.84 |
| DR-GCN | 67.77±1.09 | 67.67±0.74 | 87.23±0.28 | 55.33±0.23 | 46.56±0.43 | 67.45±1.01 | 46.84±1.42 | 34.54±1.33 | 72.48±0.83 | 24.86±1.27 | 30.93±1.76 | 64.53 ± 2.11 |
| ImGAGN | 63.60±0.55 | 62.89±0.60 | 91.87±0.53 | 63.21±1.25 | 62.13±0.87 | 78.32±2.34 | 48.04±0.78 | 36.14±1.01 | 80.61±0.21 | 60.69±1.25 | 42.55±1.91 | 91.25 ± 0.39 |
| Gsmote | 66.76±0.80 | 65.86±0.81 | 93.75±0.23 | 64.98±1.70 | 64.05±2.12 | 81.62±2.75 | 48.20±0.81 | 34.65±0.51 | 77.72±0.43 | 70.02±0.98 | 62.01±0.85 | 96.26 ± 0.04 |
| GraphENS | 72.68 ±0.76 | 67.94±0.94 | 94.32±0.54 | 69.98 ±2.41 | 69.53 ±2.31 | 87.46± 1.58 | 53.18 ±2.90 | 49.48 ±3.28 | 83.52±2.14 | 83.20±0.27 | 80.59±0.37 | 98.13 ± 0.06 |
| Ours | 77.73±0.75 | 74.94±0.29 | 95.59±0.33 | 75.54±1.12 | 74.81±0.65 | 90.68±0.40 | 66.39 ±0.15 | 61.97 ±0.14 | 85.62 ±0.72 | 85.68±0.43 | 84.21±0.65 | 99.69±0.33 |
| Dataset Hedge | Chameleon | Film | Amazon-Photo | |||||||||
| 0.2795 | 0.2516 | Squirrel 0.2416 | 0.8272 | |||||||||
| Metrics(%) | ACC | F1 | AUC | ACC | F1 | AUC | ACC | F1 | AUC | ACC | F1 | AUC |
| GCN | 36.40±2.14 | 26.47±1.91 | 61.75±2.33 | 23.39±1.12 | 17.09 ±1.33 | 55.39±1.07 | 22.69±1.06 | 17.43±0.87 | 49.51±1.11 | 67.23±1.98 | 54.53±1.99 | 88.70 ± 1.77 |
| ACM | 38.16±0.86 | 28.33±0.82 | 62.43±1.45 | 24.56±1.08 | 18.56 ±0.76 | 57.41±0.47 | 24.22±1.28 | 18.96±0.92 | 51.26±1.28 | 68.66±1.73 | 56.28±0.63 | 90.65 ± 0.84 |
| OverSamp | 37.28±2.19 | 28.05±1.71 | 61.32±2.85 | 23.78±1.17 | 16.68± 1.05 | 56.02 ± 1.37 | 22.11±1.81 | 17.15±1.45 | 50.39±1.21 | 66.00±2.02 | 55.52±1.79 | 89.14 ± 1.53 |
| Re-weight | 36.40±1.36 | 27.59±1.25 | 59.47±1.61 | 27.98±1.34 | 20.95± 1.19 | 58.52±1.38 | 21.34±1.85 | 16.08±1.70 | 51.52±1.58 | 65.69±1.35 | 55.65±1.06 | 89.39 ±1.53 |
| DR-GCN | 37.36±2.85 | 28.78±2.44 | 60.34±1.63 | 19.03±0.75 | 15.23±0.46 | 47.43±0.49 | 15.57±1.34 | 11.62±1.34 | 47.28±0.82 | 65.92±1.64 | 60.90±1.25 | 84.35 ±4.49 |
| ImGAGN | 44.05±0.75 | 33.21±0.60 | 69.62±0.16 | 21.23±0.45 | 13.86±0.46 | 51.81±0.36 | 18.86 ±0.72 | 13.82±0.67 | 54.16±0.24 | 79.97±1.42 | 63.83±1.06 | 95.59 ±0.44 |
| Gsmote | 36.92±0.59 | 27.43±0.54 | 61.13±0.29 | 23.75±0.41 | 17.26 ±0.38 | 53.37 ±0.21 | 21.54±1.73 | 16.11±1.71 | 50.39±0.28 | 82.81±0.59 | 72.44±1.29 | 96.49 ±0.18 |
| GraphENS | 31.43±0.56 | 26.06±0.52 | 64.37±0.15 | 26.72±0.27 | 18.96±0.92 | 51.87±0.08 | 26.80±0.43 | 24.63±0.55 | 55.95±0.10 | 89.68±0.25 | 87.22±0.28 | 98.90 ±0.04 |
| Ours | 49.01±1.24 | 48.29±0.25 | 77.07±0.87 | 30.20±1.02 | 26.53±0.14 | 61.41±0.97 | 27.89±0.56 | 26.07±0.28 | 57.64±1.04 | 91.56±0.72 | 90.43±0.41 | 99.43±0.25 |
5.1 Experimental Setup
Datasets. To thoroughly evaluate the performance of GraphSANN , we conduct experiments on eight benchmark datasets including six artificial imbalanced datasets and two genuine ones. Among the artificial datasets, Cora, Citeseer and Pubmed are three citation networks with high homophily, while Chameleon, Squirrel and Film are three Wikipedia networks with high heterophily. 3, 3, 2, 2, 2, and 2 classes are randomly selected as minority classes for these six datasets by down-sampling. Following [Zhao et al., 2021], all majority classes have 20 nodes while minority classes only have 20 × im ratio nodes in the training set. For two Amazon product networks whose class distributions are genuinely imbalanced, we use their original class ratios. The detailed statistical information of the six datasets is summarized in Table 1.
Baselines. We compare GraphSANN with eight state-ofthe-art baselines for imbalanced node classification problem, including two vanilla models: GCN [Kipf and Welling, 2017] and ACM [Luan et al., 2022]; two generic classimbalance methods: Oversampling and Reweight; and four network-specific methods: DR-GCN [Shi et al., 2020], ImGAGN [Qu et al., 2021], GraphSMOTE [Zhao et al., 2021] and GraphENS [Park et al., 2022]. Please refer to Appendix 7.5 for detailed descriptions of each baseline.
Evaluation Metrics. Following existing works [Zhao et al., 2021] in evaluating imbalanced classification, three evaluation metrics are adopted in this paper: Accuracy, AUC-ROC, and Macro-F1, where both AUC-ROC and Macro-F1 are reported by averaging the metrics over each class.
Parameter settings. The following hyper-parameters are set for our model in all the datasets. Layer number L = 2 with hidden dimensions 64 and 32 for both edge generation and node classification. Adam optimizer with learning rate lr = 0.001 for homophilic graphs and 0.01 for heterophilic graphs. Dropout rate γ = 0.7. Epochs = 2000 with early stop strategy. Weight decay= 5e-4. Hyper-parameters κ = 1.05, ω = 0.3. Initial hop h = 2, threshold η = 0.5 and loss weight λ = 1e-6. Sampling ratio of candidate edges ξ = 0.3. Over-sampling scale ζ = 1.0.
5.2 Imbalanced Node Classification (RQ1)
To answer RQ1, we compare the node classification performance of GraphSANN with other baselines across all eight datasets and report the average performances along with standard deviations of each metric. Table 2 shows the node classification results for six imitative datasets and two genuine datasets. From the table, we can observe that: (1) GraphSANN outperforms all the other baselines by all metrics on all eight datasets. This indicates our proposed model consistently acquires better performance on either homophilic or heterophilic networks. (2) On three heterophilic datasets, most class-imbalance baselines only acquire slightly better, or even worse performance (e.g. DR-GCN on Film and GraphSMOTE on Squirrel) than vanilla models i.e., GCN or ACM. This is because these baselines rely on homophilic assumption and generate synthetic edges based on feature similarity. Thus they perform poorly on heterophilic graphs whose edges link nodes with dissimilar features. GraphSANN, however, thanks to the adaptive subgraph extractor and multi-filter encoder blocks, can discriminatively aggregate similar node features to generate heterophilic edges, and thus achieve significant performance gains over the baselines. (3) On genuine datasets, compared to the most competitive baseline GraphENS, GraphSANN still acquires 4.5%
| Method | Cora | Chameleon | ||||
|---|---|---|---|---|---|---|
| ACC | F1 | AUC | ACC | F1 | AUC | |
| w/o UFM | 68.32 | 66.45 | 93.87 | 43.25 | 42.68 | 69.61 |
| w/o ASE | 75.14 | 73.21 | 94.21 | 45.65 | 43.95 | 72.25 |
| w/o MSE | 76.20 | 73.52 | 94.33 | 42.33 | 40.75 | 70.39 |
| GraphSANN | 77.73 | 74.94 | 95.59 | 49.01 | 48.29 | 77.07 |
and 3.6% performance gains w.r.t. F1-score on AmazonComputers and Amazon-Photo, respectively.
5.3 Influence of Imbalance Ratio (RQ2)
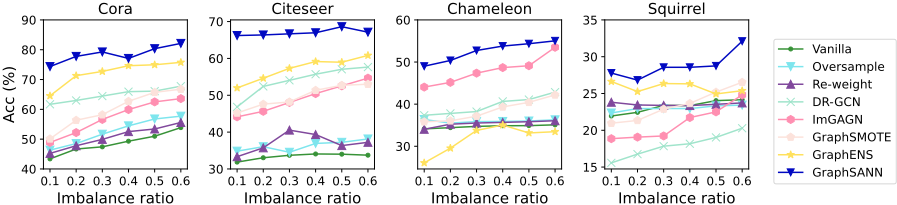
To answer RQ2, in this subsection, we further compare the performance of GraphSANN with other baselines under different im ratios. The imbalance ratio varies from 0.1 to 0.6. Each experiment is repeated 5 times and the average results are reported in Figure 3. From Figure 3, we can observe that (1) GraphSANN consistently outperforms other baselines across all the imbalance ratios on all the datasets, this demonstrates the generalization and robustness of our model under different imbalanced scenarios. (2) Generally, GraphSANN has more significant performance improvement over other baselines under more extreme imbalance ratios. As imbalance ratio increases, the datasets become more balanced, which offsets the effects brought by node/edge augmentation.
5.4 Ablation Study (RQ3)
To further investigate the contribution of each component of GraphSANN, we perform an ablation study and report the results in Table 3. w/o UFM replaces the unified feature mixer component with simple SMOTE strategy [Chawla et al., 2002]; w/o ASE replaces the adaptive subgraph extractor with fixed 2-hop neighbors of target edge to form subgraphs; and w/o MSE replaces multi-filter subgraph encoder component with a raw GCN. GraphSANN represents the full model with all the components available. From this table, we can observe that: (1) All three components contribute to the performance improvement of GraphSANN ; (2) Adaptive subgraph extractor and multi-filter encoder exhibit crucial effects on heterophilic networks in view of sharp performance drops between w/o ASE and GraphSANN and between w/o MSE and GraphSANN on Chameleon.
5.5 Parameter Sensitivity Study (RQ4)
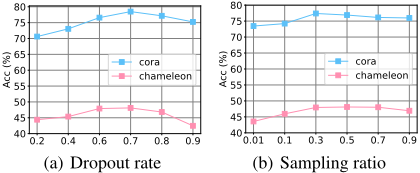
In this subsection, we investigate the impact of two crucial hyper-parameters, i.e., dropout rate γ of adaptive classifier and sampling ratio ξ of candidate synthetic edges on model performance. We vary γ from 0.1 to 0.9 with step size 0.1 and vary ξ from 0.01 to 0.9. The experiments are conducted on both Cora and Chameleon and test accuracy curves are shown in Figure 4. From Figure 4, we can observe that: (1) As γ increases, model performance gradually rises and reaches peak values when γ reaches 0.7 on both datasets. Then, as dropout rate keeps increasing, the performance gradually drops. (2) The performance decreases as the sampling ratio is under 0.3 or over 0.5. Our explanation is that the original edge distribution is not sufficiently simulated at low ξ, while a high ξ impedes feature aggregations by introducing too many noisy edges, resulting in performance degradation.
5.6 Visualization (RQ5)
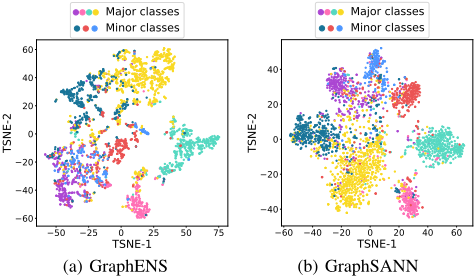
In this subsection, we project the latent node embeddings of GraphSANN and the most competitive baseline GraphENS on Cora into two-dimensional space using t-SNE [Van der Maaten and Hinton, 2008] and color the nodes based on their class labels. As shown in Figure 5, we can observe that the minority class representations of GraphENS (e.g. blue and dark cyan dots) are hard to be distinguished and have large mixed areas with majority clusters, while node representations of GraphSANN are clustered tightly together with clear boundaries for both majority and minority classes. This proves the superiority of GraphSANN in terms of embedding quality for separating different classes despite the classimbalance problem.
6 Conclusion
In this paper, we design a novel GraphSANN for imbalanced node classification on both homophilic and heterophilic graphs. The elaborately designed three components within it can unifiedly interpolate synthetic nodes, adaptively extracts surrounding subgraphs of candidate synthetic edges, and discriminatively encode them to predict the existence of synthetic edges. Extensive experiments on eight benchmark datasets have demonstrated the superiority of GraphSANN.
Acknowledgments
This work is partially supported by The National Key Research and Development Program of China (Grant No. 2020AAA0108504), Australian Research Council Future Fellowship (Grant No. FT210100624), Discovery Project (Grant No. DP190101985), and Discovery Early Career Research Award (Grant No.DE200101465).
@inproceedings{ijcai2023p848,
  title     = {Imbalanced Node Classification Beyond Homophilic Assumption},
  author    = {Liu, Jie and He, Mengting and Wang, Guangtao and Nguyen, Quoc Viet Hung and Shang, Xuequn and Yin, Hongzhi},
  booktitle = {Proceedings of the Thirty-Second International Joint Conference on
               Artificial Intelligence, {IJCAI-23}},
  publisher = {International Joint Conferences on Artificial Intelligence Organization},
  editor    = {Edith Elkind},
  pages     = {7206--7214},
  year      = {2023},
  month     = {8},
  note      = {Main Track},
  doi       = {10.24963/ijcai.2023/848},
  url       = {https://doi.org/10.24963/ijcai.2023/848},
}
TY - CPAPER TI - Imbalanced Node Classification Beyond Homophilic Assumption AU - Liu, Jie AU - He, Mengting AU - Wang, Guangtao AU - Nguyen, Quoc Viet Hung AU - Shang, Xuequn AU - Yin, Hongzhi T2 - Proceedings of the Thirty-Second International Joint Conference on Artificial Intelligence, IJCAI-23 PB - International Joint Conferences on Artificial Intelligence Organization PY - 2023 SP - 7206 EP - 7214 DO - 10.24963/ijcai.2023/848 UR - https://doi.org/10.24963/ijcai.2023/848 ER -Copied
Machine-readable versions of this paper, for tools and AI agents:





