
PCAN: A Pandemic-Compatible Attentive Neural Network for Retail Sales Forecasting
Proceedings of the Thirty-Fourth International Joint Conference on Artificial Intelligence. AI4Tech: AI Enabling Technologies. Pages 9232-9240.
https://doi.org/10.24963/ijcai.2025/1026
Keywords
- Domain-specific AI4Tech: AI4Manufacturing
- Domain-specific AI4Tech: AI4Social and AI4Society
Abstract
The outbreak of pandemic has a huge impact on production and consumption in the business world, especially for the retail sector. As a crucial component of decision-support technology in the retail industry, sales forecasting is significant for production planning and optimizing the supply of essential goods during the pandemic. However, due to the irregular fluctuation pattern caused by uncertainty and the complex temporal correlation between multiple covariates and sales, there is still no effective approach for sales forecasting in this extreme event. To fill this gap, we propose a Pandemic-Compatible Attentive Network (PCAN) for retail sales forecasting. Specifically, to capture the irregular fluctuation patterns from the sales series, we design a fluctuation attention mechanism based on association discrepancy in the time series. Then, a parallel attention module is developed to learn the complex relationship between target sales and various dynamic influence factors in a decoupled manner. Finally, we introduce a novel rectification decoding strategy to indicate fluctuation points in prediction. By evaluating PCAN on four real-world retail food datasets from the SF Express international supply chain system, the results show that our method achieves superior performance over the existing state-of-the-art baselines. The model has been deployed in the supply chain system as a fundamental component to serve a world-leading food retailer.
- [Becdach et al., 2020] Camilo Becdach, Brandon Brown, Ford Halbardier, Brian Henstorf, and Ryan Murphy. Rapidly forecasting demand and adapting commercial plans in a pandemic. McKinsey & Company, 2020.
- [Bello et al., 2017] Irwan Bello, Barret Zoph, Vijay Vasude- van, and Quoc V Le. Neural optimizer search with re- inforcement learning. In ICML, pages 459-468. PMLR, 2017.
- [Box et al., 2015] George EP Box, Gwilym M Jenkins, Gre- gory C Reinsel, and Greta M Ljung. Time series analysis: forecasting and control. John Wiley & Sons, 2015.
- [Burgos and Ivanov, 2021] Diana Burgos and Dmitry Ivanov. Food retail supply chain resilience and the covid-19 pandemic: A digital twin-based impact analysis and improvement directions. Transportation Research Part E: Logistics and Transportation Review, 152:102412, 2021.
- [Cao et al., 2023] Haizhou Cao, Zhenhao Huang, Tiechui Yao, Jue Wang, Hui He, and Yangang Wang. Inparformer: evolutionary decomposition transformers with interactive parallel attention for long-term time series forecasting. In AAAI, volume 37, pages 6906-6915, 2023.
- [Chen and Guestrin, 2016] Tianqi Chen and Carlos Guestrin. Xgboost: A scalable tree boosting system. In SIGKDD, pages 785-794, 2016.
- [Cheriyan et al., 2018] Sunitha Cheriyan, Shaniba Ibrahim, Saju Mohanan, and Susan Treesa. Intelligent sales pre- diction using machine learning techniques. In 2018 Inter- national Conference on Computing, Electronics & Com- munications Engineering (iCCECE), pages 53-58. IEEE, 2018.
- [Cui et al., 2021] Yue Cui, Kai Zheng, Dingshan Cui, Jian- dong Xie, Liwei Deng, Feiteng Huang, and Xiaofang Zhou. Metro: a generic graph neural network framework for multivariate time series forecasting. Proceedings of the VLDB Endowment, 15(2):224-236, 2021.
- [Di Pillo et al., 2016] Gianni Di Pillo, Vittorio Latorre, Ste- fano Lucidi, and Enrico Procacci. An application of sup- port vector machines to sales forecasting under promo- tions. 4OR, 14:309-325, 2016.
- [Feizabadi, 2022] Javad Feizabadi. Machine learning de- mand forecasting and supply chain performance. Inter- national Journal of Logistics Research and Applications, 25(2):119-142, 2022.
- [Gasthaus et al., 2019] Jan Gasthaus, Konstantinos Benidis, Yuyang Wang, Syama Sundar Rangapuram, David Sali- nas, Valentin Flunkert, and Tim Januschowski. Probabilis- tic forecasting with spline quantile function rnns. In AIS- TATS, pages 1901-1910. PMLR, 2019.
- [Hewage et al., 2020] Pradeep Hewage, Ardhendu Behera, Marcello Trovati, Ella Pereira, Morteza Ghahremani, Francesco Palmieri, and Yonghuai Liu. Temporal con- volutional neural (tcn) network for an effective weather forecasting using time-series data from the local weather station. Soft Computing, 24:16453-16482, 2020.
- [Ioffe and Szegedy, 2015] Sergey Ioffe and Christian Szegedy. Batch normalization: Accelerating deep net- work training by reducing internal covariate shift. In ICML, pages 448-456. PMLR, 2015.
- [Ismail Fawaz et al., 2020] Hassan Ismail Fawaz, Benjamin Lucas, Germain Forestier, Charlotte Pelletier, Daniel F Schmidt, Jonathan Weber, Geoffrey I Webb, Lhassane Idoumghar, Pierre-Alain Muller, and Franc ¸ois Petitjean. Inceptiontime: Finding alexnet for time series classifica- tion. Data Mining and Knowledge Discovery, 34(6):1936- 1962, 2020.
- [Jha et al., 2023] Pradeep K Jha, Suvadip Ghorai, Rakhi Jha, Rajul Datt, Gowrishankar Sulapu, and Surya Prakash Singh. Forecasting the impact of epidemic outbreaks on the supply chain: modelling asymptomatic cases of the covid-19 pandemic. International Journal of Production Research, 61(8):2670-2695, 2023.
- [Ke et al., 2017] Guolin Ke, Qi Meng, Thomas Finley, Taifeng Wang, Wei Chen, Weidong Ma, Qiwei Ye, and Tie-Yan Liu. Lightgbm: A highly efficient gradient boost- ing decision tree. NeurIPS, 30, 2017.
- [Lai et al., 2018] Guokun Lai, Wei-Cheng Chang, Yiming Yang, and Hanxiao Liu. Modeling long-and short-term temporal patterns with deep neural networks. In SIGIR, pages 95-104, 2018.
- [Li and Yu, 2023] Qianying Li and Mingyang Yu. Achiev- ing sales forecasting with higher accuracy and efficiency: A new model based on modified transformer. Journal of Theoretical and Applied Electronic Commerce Research, 18(4):1990-2006, 2023.
- [Li et al., 2024a] Fan Li, Xiaoyang Wang, Dawei Cheng, Wenjie Zhang, Ying Zhang, and Xuemin Lin. Hypergraph self-supervised learning with sampling-efficient signals. In IJCAI, pages 4398-4406, 2024. IJCAI
- [Li et al., 2024b] Fan Li, Zhiyu Xu, Dawei Cheng, and Xi- aoyang Wang. Adarisk: risk-adaptive deep reinforcement learning for vulnerable nodes detection. TKDE, 2024.
- [Liang et al., 2019] Yunxin Liang, Jiyu Wu, Wei Wang, Yu- jun Cao, Biliang Zhong, Zhenkun Chen, and Zhenzhang Li. Product marketing prediction based on xgboost and lightgbm algorithm. In Proceedings of the 2nd inter- national conference on artificial intelligence and pattern recognition, pages 150-153, 2019.
- [Masini et al., 2023] Ricardo P Masini, Marcelo C Medeiros, and Eduardo F Mendes. Machine learn- ing advances for time series forecasting. Journal of economic surveys, 37(1):76-111, 2023.
- [Nicola et al., 2020] Maria Nicola, Zaid Alsafi, Catrin Sohrabi, Ahmed Kerwan, Ahmed Al-Jabir, Christos Iosi- fidis, Maliha Agha, and Riaz Agha. The socio-economic implications of the coronavirus pandemic (covid-19): A review. International journal of surgery, 78:185-193, 2020.
- [Nigam and Shukla, 2021] Bhanuj Nigam and AC Shukla. Sales forecasting using box jenkins method based arima model considering effect of covid-19 pandemic situation. International Journal of Engineering Applied Sciences and Technology, 6(7):87-97, 2021.
- [Paszke et al., 2019] Adam Paszke, Sam Gross, Francisco Massa, Adam Lerer, James Bradbury, Gregory Chanan, Trevor Killeen, Zeming Lin, Natalia Gimelshein, Luca Antiga, et al. Pytorch: An imperative style, high- performance deep learning library. NeurIPS, 32, 2019.
- [Qi et al., 2019] Yan Qi, Chenliang Li, Han Deng, Min Cai, Yunwei Qi, and Yuming Deng. A deep neural framework for sales forecasting in e-commerce. In CIKM, pages 299- 308, 2019.
- [Ramos et al., 2015] Patrícia Ramos, Nicolau Santos, and Rui Rebelo. Performance of state space and arima mod- els for consumer retail sales forecasting. Robotics and computer-integrated manufacturing, 34:151-163, 2015.
- [Ryali et al., 2023] Gayatri Ryali, Sivaramakrishnan Kaveri, and Prakash Mandayam Comar. Trendspotter: Forecasting e-commerce product trends. In CIKM, pages 4808-4814, 2023.
- [Ryan, 2020] Ryan. Top ten food companies in 2020. https://www.foodprocessing-technology.com/features/ top-ten-food-companies-in-2020, 2020. Link
- [Sayyida et al., 2021] Sayyida Sayyida, Sri Hartini, Sri Gu- nawan, and Syarief Nur Husin. The impact of the covid-19 pandemic on retail consumer behavior. Aptisi Transactions on Management (ATM), 5(1):79-88, 2021.
- [Sugiarto et al., 2016] Vicky Chrystian Sugiarto, Riyanarto Sarno, and Dwi Sunaryono. Sales forecasting using holt- winters in enterprise resource planning at sales and dis- tribution module. In 2016 International Conference on Information & Communication Technology and Systems (ICTS), pages 8-13. IEEE, 2016.
- [Tan et al., 2025] Xingyu Tan, Xiaoyang Wang, Qing Liu, Xiwei Xu, Xin Yuan, and Wenjie Zhang. Paths-over- graph: Knowledge graph empowered large language model reasoning. In WebConf, pages 3505-3522, 2025.
- [Tas ¸demir, 2022] Funda Ahmetoglu Tas ¸demir. Machine learning sales forecasting for food supplements in pan- demic era. Journal of Risk Analysis and Crisis Response, 12(2), 2022.
- [Taylor and Letham, 2018] Sean J Taylor and Benjamin Letham. Forecasting at scale. The American Statistician, 72(1):37-45, 2018.
- [Vaswani et al., 2017] Ashish Vaswani, Noam Shazeer, Niki Parmar, Jakob Uszkoreit, Llion Jones, Aidan N Gomez, Łukasz Kaiser, and Illia Polosukhin. Attention is all you need. NeurIPS, 30, 2017.
- [Wang et al., 2024] Jinghao Wang, Yanping Wu, Xiaoyang Wang, Ying Zhang, Lu Qin, Wenjie Zhang, and Xuemin Lin. Efficient influence minimization via node blocking. Proceedings of the VLDB Endowment, 17(10):2501-2513, 2024.
- [Wang et al., 2025] Jinghao Wang, Yanping Wu, Xiaoyang Wang, Chen Chen, Ying Zhang, and Lu Qin. Effective influence maximization with priority. In WebConf, pages 4673-4683, 2025.
- [Xu et al., 2021] Jiehui Xu, Haixu Wu, Jianmin Wang, and Mingsheng Long. Anomaly transformer: Time series anomaly detection with association discrepancy. arXiv preprint arXiv:2110.02642, 2021.
- [Yu et al., 2023] Jianke Yu, Hanchen Wang, Xiaoyang Wang, Zhao Li, Lu Qin, Wenjie Zhang, Jian Liao, and Ying Zhang. Group-based fraud detection network on e-commerce platforms. In SIGKDD, pages 5463-5475, 2023.
- [Yu et al., 2024] Jianke Yu, Hanchen Wang, Xiaoyang Wang, Zhao Li, Lu Qin, Wenjie Zhang, Jian Liao, Ying Zhang, and Bailin Yang. Temporal insights for group- based fraud detection on e-commerce platforms. TKDE, 2024.
- [Zhang et al., 2021] Qi Zhang, Hengshu Zhu, Ying Sun, Hao Liu, Fuzhen Zhuang, and Hui Xiong. Talent demand forecasting with attentive neural sequential model. In SIGKDD, pages 3906-3916, 2021.
- [Zhou et al., 2021a] Haoyi Zhou, Shanghang Zhang, Jieqi Peng, Shuai Zhang, Jianxin Li, Hui Xiong, and Wancai Zhang. Informer: Beyond efficient transformer for long se- quence time-series forecasting. In AAAI, volume 35, pages 11106-11115, 2021.
- [Zhou et al., 2021b] Haoyi Zhou, Shanghang Zhang, Jieqi Peng, Shuai Zhang, Jianxin Li, Hui Xiong, and Wancai Zhang. Informer: Beyond efficient transformer for long sequence time-series forecasting. In AAAI, 2021.
- [Zhou et al., 2022] Tian Zhou, Ziqing Ma, Qingsong Wen, Xue Wang, Liang Sun, and Rong Jin. Fedformer: Fre- quency enhanced decomposed transformer for long-term series forecasting. In ICML, pages 27268-27286. PMLR, 2022.
References were extracted automatically from the PDF and may contain errors.
Full text extracted automatically from the PDF; figures, tables and equations may differ. The PDF is the version of record.
1 Introduction
The global pandemics (e.g., COVID-19) would result in profound socio-economic consequences [Nicola et al., 2020], especially for the retail industry [Sayyida et al., 2021]. For example, the Canadian leading food retail supply chain Sysco saw a 12% drop in its sales in 2020 versus the 2019 financial year, significantly impacted by the pandemic [Ryan, 2020]. Sales forecasting plays an important role in the supply chain management of the retail sector. It can help retailers achieve better production planning, inventory control, and financial estimation [Tas¸demir, 2022; Li et al., 2024b; Wang et al., 2025], thus optimizing their business decisionmaking. Furthermore, accurate sales prediction can help provide the required quantities of essential goods (e.g., food and clothing) for people in need and reduce the waste of resources [Burgos and Ivanov, 2021]. This is especailly important for safeguarding the well-being of people and maintaining social stability during the pandemic. However, shifts in consumer behaviors and government's containment measures (e.g., social distancing and lockdown) can greatly alter the sales patterns of retail products, thereby disrupting the sales forecasting process [Jha et al., 2023]. Thus, it is necessary yet challenging to develop a sales forecasting model that is adaptable to the pandemic scenario.
∗Corresponding author
Traditional approaches like Holt-Winter's method [Sugiarto et al., 2016] and autoregressive integrated moving average (ARIMA) [Ramos et al., 2015] employ techniques of time series analysis for sales forecasting. To achieve better nonlinear modeling capacity, machine learning methods such as support vector machine (SVM) [Di Pillo et al., 2016] and gradientboosting decision trees (GBDT) [Cheriyan et al., 2018] are utilized and perform exceptionally well in the sales prediction task [Feizabadi, 2022]. Recently, deep learning approaches have been widely used in designing end-to-end sales forecasting models. DSF [Qi et al., 2019] and MQ-RNN [Gasthaus et al., 2019] are two popular deep forecasting models based on Recurrent Neural Networks (RNNs), which focus on sequential modeling. To achieve efficient parallel training and better capture long-term temporal dependencies in sales series, Convolution Neural Network (CNN) based models such as InceptionTime [Ismail Fawaz et al., 2020] and TrendSpotter [Ryali et al., 2023] have been devised. Furthermore, some studies attempted to apply transformer-based models, which have achieved remarkable success in Natural Language Processing, to sales forecasting [Li and Yu, 2023] (e.g., Autoformer [Zhou et al., 2021a], FEDformer [Zhou et al., 2022] and InParformer [Cao et al., 2023]), and achieve the state-ofthe-art prediction performance.
Nevertheless, developing a retail sales forecasting model adapted to the pandemic environment is challenging due to the following reasons: (1) Sales series are prone to fluctuating in an irregular manner since changes in disease transmission risks and pandemic policies can swiftly alter consumer behaviors [Becdach et al., 2020; Tan et al., 2025]. Existing methods fail to capture these complex fluctuation patterns in sales series, resulting in severe forecast bias. (2) Many dynamic covariates related to pandemic events (e.g., newly infected cases) and real business operations (e.g., daily promotions) may significantly influence the target sales. However, these covariate time series are often composed of intricate temporal patterns and entangled noise. How to model their latent relationship with sales and learn informative covariate representations remains challenging for existing approaches.
To address the aforementioned issues, we propose PCAN, a novel attention-based framework that is adaptable to retail sales forecasting during the pandemic period. Specifically, we first design a group embedding layer to encode heterogeneous features, including static item profiles and dynamic covariates. We also develop a series augmentation strategy to better represent target sales in the network. Next, to address the challenge of capturing abnormal fluctuation patterns, we propose a fluctuation attention module based on association discrepancy. This module effectively learns fluctuation information in sales series and guides the model to rectify its predictions accordingly. Additionally, we present a parallel attention module consisting of a pandemic attention stream (PAS) and a business attention stream (BAS), aiming at extracting sales-related dynamic features. The cross-attention mechanism within the module filters irrelevant noise in covariates and captures complex correlations between dynamic features and target sales. To make the final forecast, the decoder integrates the knowledge from the above modules and applies novel rectification coefficients learned from fluctuation information. Extensive experiments on four real-world retail food datasets from the SF Express intelligent supply chain system 1 demonstrate that PCAN consistently achieves an improvement of over 2% in ACC and a reduction of over 9% in RMSE compared to the state-of-the-art methods. The case study shows that our model significantly outperforms the existing online prediction model. The main contributions of our work can be summarized as follows:
- We present PCAN, an end-to-end pandemic-compatible attentive network, for retail sales forecasting. The model significantly enhances production planning and supply management in the retail industry during extreme events such as pandemics. It has now been deployed as a functional component in a real-world intelligent supply chain system, serving a world-leading food retailer.
- We propose a parallel stream attention module to better learn the latent relationship between dynamic covariates and sales sequence. Besides, we design a fluctuation attention mechanism to capture irregular fluctuation patterns in sales series and apply a rectification decoding strategy to inject learned fluctuation information into the final prediction.
- We conduct extensive experiments on four real-world re-
1 https://www.sf-international.com/
tail food datasets and establish the new state-of-the-art performance with a clear gain compared to the existing state-of-the-art sales forecasting methods.
2 Preliminary
2.1 Notations
In practice, retail sales forecasting during the pandemic is a complex temporal analysis problem with multiple influence factors. We denote historical sales of the product as Y = {yt}Tt=1 , where T is the length of the time series and yt is the sale on the day t. Moreover, we consider salesrelated features Xs including static item profile P and temporal covariates C. P includes various types of time-invariant product-related inputs, such as product text attributes and store attributes. In this problem, C can be divided into Cp and Cb, which are covariate series related to pandemic events and retail business, respectively.
2.2 ProblemFormulation
Given a series of historical sales Y and sales-related features Xs =< P,Cp,Cb >, our task is to learn a regression model fΘ to precisely estimate the sales of the product over period [T + 1, T + l], where parameter l is the prediction horizon. The sales forecasting problem can be formulated as follows:
where ˆ Y = {ˆ yT+k}lk=1 are predicted sales and Θ is the set of learnable model parameters.
3 Methodology
In this section, we present the proposed PCAN in detail. We first give an overview of our architecture. After that, we describe each component of PCAN. Finally, we report the loss function and optimization strategy.
3.1 Overview
Figure 1. shows the overall architecture of PCAN. The model takes historical sales series, product profiles, pandemicrelated covariates, and business-related covariates as inputs. Then, it processes each kind of feature in the group embedding layer. After that, we apply the fluctuation attention module (FAM) to detect abnormal sales fluctuations caused by pandemic events and generate instruction messages. Moreover, the parallel attention module, which consists of a pandemic attention stream (PAS) and a business attention stream (BAS), is adopted to capture complex relationships between sales and pandemic events as well as business features. Finally, the rectification decoder integrates extracted knowledge from historical sales and multiple covariates to forecast sales.
3.2 Group Embedding Layer
To better vectorize various types of input data including sales records and auxiliary features that can boost forecasting accuracy, we propose a group embedding layer with four encoding strategies: static profile embedding, temporal covariates encoding, series augmentation, and timestamp tagging.
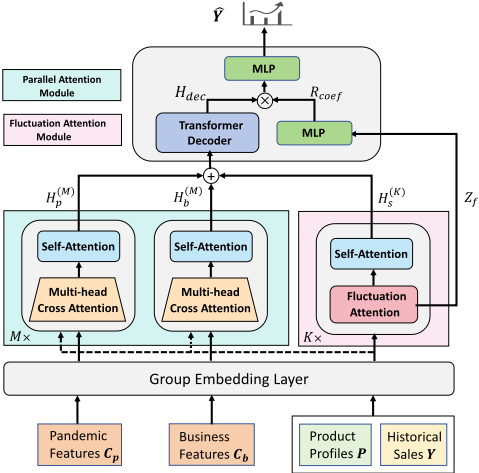
Static Profile Embedding. The static item profile contains various time-invariant features related to the product (e.g., the product category and store location). As most of them are discrete in our task, we apply a learnable embedding method to encode them. Suppose P = {pi}mi=1 , where pi is the i-th static feature. For each pi, we first use one-hot encoding to transform it to a sparse vector oi ∈ Rci where ci is the category number of pi. Then we map it to a column of learnable embedding matrix Ei ∈ Rd×ci , where d is the embedding dimension, and output dense embedding ei as:
We aggregate the embedded static features of each item as:
where Ps ∈ Rd is the encoded static profile representation. Temporal Covariates Encoding. For sales-related covariates, we consider pandemic events covariates Cp ∈ RN1×T and business covariates Cb ∈ RN2×T , where N1, N2 denote the number of two covariates, respectively. We apply multichannel 1-D convolutional filters on the time dimension to extract complex temporal information and extend zero vectors along the time dimension as placeholders for unknown future features. This process can be formulated as:
where Ep, Eb ∈ Rd×(T+l) are denoted as embedding matrices of two kinds of covariates, respectively. E0p ,E0b ∈ Rd×l are zero padding matrices. || is the concatenation operator.
Series Augmentation. The sales series Y = {yt}Tt=1 contains a single value at each time step, which cannot fully reflect the temporal pattern. We propose to augment it into a multivariate series to better represent the status of each position in the series. These augmented sales include lag sale value, average sales of the last week, etc. The augmented time series ˜ Y can be formulated as:
where ˜ yt ∈ RN3+1 is the augmented sale vector at time point t and at,i refers to the i-th augmented value. N3 denotes the number of augmentation sales. After that, we apply a linear transformation to embed this multi-value series as:
where W ∈ Rd×(N3+1) is a learnable matrix and E0s ∈ Rd×l is the padding matrix. Finally, to inject inductive knowledge of the product attributes, we add Ps to each position of Es.
Timestamp Tagging. To make the model better capture temporal information in sales series and covariates, we utilize a time-encoding strategy. Specifically, we apply sinusoidal encoding as the local timestamp Sl ∈ Rd×(T+l) to model the contextual dependencies of time and use aggregated embeddings of date features (i.e., week, month, year) as the global stamp Sg ∈ Rd×(T+l) to encode date information. The embedding and aggregation methods are the same as those in static profile embedding. Then we tag the augmented sales series and two kinds of covariates with these timestamps to get model input as follows:
where Ek ∈ {Es, Ep, Eb}.
3.3 Fluctuation AttentionModule
Pandemic events will result in a chain of influences that may cause irregular fluctuations in retail sales due to their huge uncertainty. It is crucial to measure the degree of abnormal fluctuation in time series as it can help guide the model to learn more informative representations and achieve more robust forecasting performance. To quantify the degree of abnormality in time series, we apply Association Discrepancy, a time series anomaly criterion that estimates abnormality by computing the distribution discrepancy between prior association and series association. Specifically, prior association refers to the inductive bias of adjacent concentration, which implies that anomalies should primarily occur at adjacent time points that are prone to having similar abnormal patterns. The series association denotes that each time point can be characterized by its associations with all the time points, presenting as a distribution of association weights along the time horizon. This distribution offers an informative description of the temporal context. To estimate two distributions, we devise the fluctuation attention function in the k-th block of the module as:
K,Q, V ∈ Rd×(T+l) corresponds to key, query, and value in self-attention. H(k-1) s is sales embeddings from block k - 1 and H(0) s denotes sales input Is. W(k) is a parameter matrix. P (k) and S (k) denote the prior association distribution and series association distribution, respectively. σi represents the i-th value of the learnable variance parameter σ ∈ R(T+l)×1 . O(k) is the output of the function. Scale(·) refers to normalization to transform the association weights to the discrete distributions P (k) . After the fluctuation attention function, we reconstruct sales representations in the k-th block as:
where LayerNorm(·) denotes layer normalization and FFN(·) represents feed-forward neural network. We adopt KL divergence to measure association discrepancy as:
Previous work [Xu et al., 2021] shows that abnormal time points will present smaller discrepancies than normal time points, which makes the criterion inherently distinguishable. In this study, we apply a multi-layer perceptron (MLP) to further extract useful messages from discrepancies, making the model pay more attention to time points that tend to have irregular fluctuations during the pandemic. This fluctuation knowledge can be computed in each layer k as:
where Z(k) f ∈ RT+l is the fluctuation instruction message. To aggregate the hierarchy information in the deep neural network, we concatenate the representations from each block as:
where Zf ∈ RK×(T+l) is the aggregated representation of fluctuation pattern and K is the number of stacked blocks.
3.4 Parallel Attention StreamModule
In this subsection, we design a parallel attention stream module that consists of a pandemic attention stream (PAS) and a business attention stream (BAS) to learn the latent relationship between sales and two kinds of covariates, respectively. To achieve this, we employ a two-stage attention mechanism in both submodules. In the first stage, we apply sales representations as queries to distill sales-related covariate knowledge. Particularly, we use the multi-head attention strategy, which allows the model to jointly learn from different latent subspaces. For each type of covariate, this cross-attention mechanism in the m-th layer can be formulated as:
where H(m-1) c denotes covariate representations output from layer m - 1. W(m) c,h ,W(m) s,h ∈ R(d/H)×d are learnable matrices for covariate embeddings and sales embeddings, respectively. H is the number of heads. After the cross-attention function, we further stack a self-attention layer to learn context dependency within the series of covariates as:
where H(m) c is the reconstruction output of the covariates from the m-th layer. Both streams have M identical blocks.
3.5 Rectification Decoder
In this module, we propose a rectification decoding strategy, which injects the fluctuation knowledge learned from association discrepancy into decoded representations for prediction. Specifically, the outputs from PAS, BAS, and FAM are aggregated and then fed into a vanilla transformer decoder [Vaswani et al., 2017] for the decoding process:
where Hdec ∈ Rd×(T+l) . To reflect fluctuation patterns in sales, we apply an MLP to learn scale factors called rectification coefficients (Rcoef ) from Zf . Rcoef ∈ RT+l can be viewed as unnormalized attention scores to reweigh the decoded embeddings Edec as:
where Hrec ∈ Rd×(T+l) is the rectified output and ⊙ denotes dot product operator. Finally, the rectified output will be forwarded to a feed-forward network and predict future sales:
3.6 Optimization Strategy
In the training process, we take the mean square error as the objective function to guide parameter learning:
| Coffee Bean | Croissant | Hot Cups | Cold Cups | |||||||||
|---|---|---|---|---|---|---|---|---|---|---|---|---|
| ACC ↑ | MAE ↓ | RMSE ↓ | ACC ↑ | MAE ↓ | RMSE ↓ | ACC ↑ | MAE ↓ | RMSE ↓ | ACC ↑ | MAE ↓ | RMSE ↓ | |
| ARIMA | 53.17% | 2.04 | 4.02 | 47.48% | 3.02 | 5.71 | 50.15% | 58.16 | 75.41 | 48.39% | 62.73 | 90.71 |
| Prophet | 61.25% | 1.49 | 2.21 | 53.08% | 2.55 | 4.42 | 54.75% | 40.43 | 59.87 | 58.19% | 48.53 | 74.26 |
| LSTNet | 77.09% | 0.77 | 1.51 | 59.98% | 2.00 | 3.84 | 50.70% | 51.02 | 74.57 | 69.25% | 41.23 | 68.82 |
| MQ-RNN | 72.08% | 0.83 | 1.20 | 60.55% | 3.25 | 4.17 | 67.99% | 33.30 | 51.64 | 69.56% | 40.88 | 65.31 |
| TCN | 77.47% | 0.99 | 1.32 | 72.28% | 1.61 | 2.50 | 78.20% | 23.17 | 35.04 | 74.70% | 33.32 | 51.20 |
| TrendSpotter | 80.11% | 0.88 | 1.24 | 73.07% | 1.58 | 2.46 | 79.14% | 22.73 | 33.45 | 75.48% | 31.93 | 47.52 |
| Informer | 81.63% | 0.84 | 1.20 | 69.65% | 1.76 | 2.83 | 78.02% | 22.82 | 38.50 | 75.82% | 32.46 | 52.70 |
| FEDformer | 84.97% | 0.64 | 1.03 | 71.18% | 1.66 | 2.40 | 78.43% | 22.39 | 33.50 | 76.45% | 31.63 | 46.39 |
| InParformer | 83.75% | 0.70 | 1.11 | 73.63% | 1.45 | 2.22 | 79.09% | 22.78 | 33.27 | 77.16% | 30.65 | 43.41 |
| PCAN | 87.32% | 0.59 | 1.01 | 76.51% | 1.31 | 1.72 | 84.03% | 19.38 | 27.38 | 81.22% | 27.35 | 38.88 |
| Product | Category | Unit |
|---|---|---|
| Coffee Bean | raw material | kg |
| Croissant | food | pcs |
| Hot Cups | cups and lids | pcs |
| Cold Cups | cups and lids | pcs |
where ˆ yT+k is sales forecast value at the time point T + k, and yT+k is the ground truth label in the corresponding position. λ is the regularization parameter to restrict the complexity of the deep network. We use Adam [Bello et al., 2017] optimizer, with the learning rate initialized to 10-4 and adaptively decreased during the optimization process. Our model is implemented in PyTorch [Paszke et al., 2019] and trained on an NVIDIA Tesla V100 32GB GPU.
4 Experiments
4.1 Experimental Setups
Dataset We conduct experiments on four real-world retail food datasets from the SF Express intelligent supply chain system, which serves a world-leading food retailer. The data are collected from the retailer's 898 offline stores in Shanghai from 01/09/2019 to 01/05/2022. During this period, the city is under the influence of the COVID-19 pandemic. The four products including Coffee Bean, Croissant, Hot Cups, and Cold Cups are among the top ten best-selling products for the retailer. We present detailed information about products in Table 2. The datasets also contain product attributes (e.g., product type and store location), pandemic features (e.g., daily number of infection cases), and business features (e.g., daily promotion type) provided by the retailer. We split the data into the train set (01/09/2019-30/04/2021), the validation set (01/05/2021-31/08/2021), and the test set (01/09/202101/05/2022), respectively.
Baselines To validate the effectiveness of PCAN, We compare it against the following baselines: (1) Statistical models: ARIMA [Box et al., 2015] and Prophet [Taylor and Letham, 2018]. (2) RNN-based models: LSTNet [Lai et al., 2018] and MQ-RNN [Gasthaus et al., 2019]. (3) CNNbased models: TCN [Hewage et al., 2020] and TrendSpotter [Ryali et al., 2023]. (4) Transformer-based models: Informer [Zhou et al., 2021a], FEDformer [Zhou et al., 2022], and InParformer [Cao et al., 2023].
Implementation details We set the length of historical observation T to 30 days (a month) and the prediction window l to 7 days. The dimension of feature embedding d is set to 512. We choose 8 as the number of heads in the multi-head attention mechanism. The numbers of stacked attention blocks in the parallel attention stream module, fluctuation attention module, and rectification decoder are all set to 6 in implementation. During training, the maximum epoch is set to 5, with a batch size of 128. We adopt batch normalization [Ioffe and Szegedy, 2015] with epsilon 0.01. we have released the code in https://github.com/Coco-Hut/PCAN
Evaluation metrics. We employ Mean Absolute Error (MAE) and Root Mean Square Error (RMSE), which are two common time series forecasting metrics [Zhou et al., 2021b]. Moreover, we use a metric utilized in the SF supply chain system called Accuracy (ACC). This metric is formulated as:
where n is the prediction horizon, yt and ˆ yt are target and forecast sales at time step t, respectively. wMAPE refers to the Weighted Mean Absolute Percentage Error.
4.2 Performance Comparison
The overall results of different approaches are summarized in Table 1. Obviously, PCAN consistently outperforms all the baselines in all metrics across four product datasets, which validates its effectiveness for sales forecasting during the pandemic. ARIMA and Prophet perform poorly. This is because their predictions are constrained to be linear functions of past observation, and they fail to leverage multiple pandemic features. The RNN-based models (LSTNet and MQRNN) and CNN-based models (TCN and TrendSpotter) yield a significant improvement over these two statistical models.
| Model | ACC ↑ | MAE ↓ | RMSE ↓ |
|---|---|---|---|
| PCANw/o SA | 85.31% | 0.63 | 1.07 |
| PCAN w/o PAS | 82.69% | 0.74 | 1.20 |
| PCANw/o BAS | 82.42% | 0.75 | 1.17 |
| PCANw/o FAM | 81.85% | 0.77 | 1.28 |
| PCAN w/o Rec | 83.48% | 0.71 | 1.18 |
| PCAN | 87.32% | 0.59 | 1.01 |
This strongly demonstrates the necessity of deep models for sales forecasting and shows the effectiveness of deep sequential networks in extracting temporal patterns from input data. Among all baselines, transformer-based approaches (i.e., Informer, FEDformer, and InParformer) prove to be the most competitive. This is because the attention mechanism can effectively learn latent relationships between complex covariates and target sales and capture long-term patterns without decay. Notably, compared to InParformer, the state-of-the-art attention-based method, PCAN consistently achieves an improvement of over 2.8% in terms of ACC on four product datasets. Moreover, our model yields 9.0% (1.11 → 1.01) RMSE reduction in Coffee Bean, 22.5% (2.22 → 1.72) in Croissant, 17.7% (33.27 → 27.38) in Hot Cups and 10.4% (43.41 → 38.88) in Cold Cups. We attribute these significant and stable improvements to our specific designs. Through the parallel attention module, we can adaptively learn representations of sales-related pandemic features and business features. With fluctuation attention and rectification mechanisms, PCAN can effectively detect potential irregular fluctuations in the time series and make more accurate predictions.
4.3 Ablation Analysis
In this subsection, we verify the effectiveness of modules and techniques designed in our framework through an ablation analysis. We conduct this experiment on the Coffee Bean dataset. The experimental results are presented in Table 3. We observe that PCAN outperforms all variants across 3 metrics, demonstrating the effectiveness of each module (technique). PCAN w/o SA suffers a drop of 2.01% in ACC compared to PCAN. This proves that augmented multi-value sales input can better represent trends in sales series. We also find a significant performance degradation when replacing the PAS or BAS with vanilla self-attention blocks. For instance, PAS brings about a 4.6% improvement in ACC and a decrease of about 0.15 in MAE. This highlights the effectiveness of our cross-attention mechanism, which utilizes sale embeddings as queries to learn sales-related covariate knowledge. Additionally, we find that PCAN w/o FAM performs poorly among several variants. The full model outperforms it by an ACC difference of 5.47%. This indicates that it is crucial to learn contextual dependency in sales series with multi-layer attention blocks. Furthermore, the fluctuation knowledge learned from the association discrepancy can also enhance model performance. To further evaluate the rectification process, we remove the Rcoef and the scaling operation. This results in a drop of 3.84% in ACC and a 0.17 higher RMSE value. This observation further validates the effectiveness of our Rcoef in capturing fluctuations in sales series.
4.4 Case Study
To analyze the performance of PCAN more intuitively, we conduct an empirical case study in this subsection. We compare our method with the online model (i.e. LightGBM [Ke et al., 2017]) deployed in the SF Express international supply chain system to further illustrate its effectiveness in the real-world industry environment.
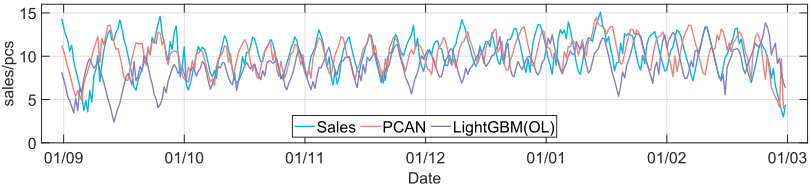
Case #1. In the first case, we consider all food retail stores in Shanghai from 09/2021 to 03/2022. Figure 2 shows the target average sale of Croissant in these stores and the predicted results of PCAN and the online model. We find that product sales fluctuate frequently and sharply under the impact of the pandemic. The online model fails to capture the irregular fluctuation of sales and even shows the opposite trend from the ground truth when sales fluctuate intensely. In contrast, our PCAN reacts to abnormal fluctuations quickly and outputs accurate prediction results for a long period of time.
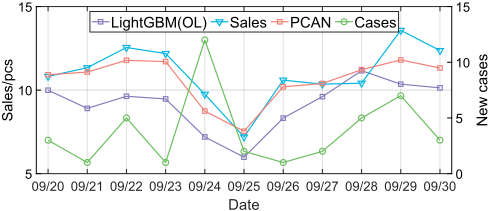
Case #2. In the second case, we select an offline retail store and present how the pandemic information influences product sales. We choose Croissant as the target product. In Figure 3, we plot ground truth sales, predicted sales of two models, and the daily number of new COVID-19 cases in the area around the store from 20/09/2022 to 30/09/2022. We find that when new cases increased sharply on September 24th, 2022, the sale of the product saw a drastic downward trend the next day. When new cases remained at a low level, the sales started to recover. The above observation indicates that the epidemic information has a significant impact on product sales. Moreover, we note that PCAN accurately predicts this sudden decline in sales and the subsequent recovery trend. The prediction of PCAN nearly matches the real sales during this period, while the results from the current online model show an apparent gap between target sales.
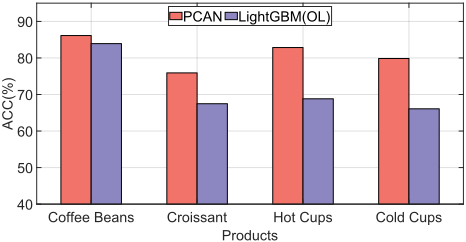
Case #3. In the third case, we compare the prediction results of PCAN and the online model in April 2022, during which Shanghai was under lockdown due to the COVID-19 pandemic. We consider all offline shops in Shanghai and report the average ACC of two models on four products. As shown in Figure 4, our model significantly outperforms the online model in terms of ACC. PCAN enhances the accuracy of Coffee Bean prediction from 83.92% to 86.13%. The performance improvements are more considerable in Croissant, which increases from 67.47% to 75.91%. Furthermore, our model demonstrates much better predictive capability for Hot Cups and Cold Cups. PCAN can achieve an ACC of over 80% on these two products, while the existing online model LightGBM can only achieve an ACC of no more than 70%. This case strongly validates the superior performance of our proposed method in the context of the pandemic.
5 RelatedWork
5.1 Statistical Time Series Forecasting
Time-series forecasting is an active research area that covers various fields such as e-commerce [Yu et al., 2023], transportation, and climate [Zhang et al., 2021]. Statistical models have been the most classic solutions for this problem.
ARIMA [Box et al., 2015] takes different ideas from autoregression (AR), moving averages (MA), and differencing (I) and combines them to find patterns and trends in temporal data. Prophet [Taylor and Letham, 2018] is a powerful time series forecasting framework based on an additive model that fits trends, seasonal effects, and holiday effects. Although these methods are widely utilized in realworld applications [Nigam and Shukla, 2021; Li et al., 2024a; Wang et al., 2024], most of them suffer from the strong approximation of linearity [Cui et al., 2021]. Besides, they fail to consider product features and other covariates, which are crucial for accurate sales prediction.
5.2 Learning-based Time Series Forecasting
In recent years, machine learning models have emerged as powerful tools in time series forecasting due to their flexible nonlinear modeling capacity [Masini et al., 2023]. Among them, boosting regression trees such as XGBoost [Chen and Guestrin, 2016] and LightGBM [Ke et al., 2017] are widely used in industry for product sales prediction [Liang et al., 2019]. However, these methods require handcrafted features, which can be labor-intensive. Recurrent neural networks (RNNs) such as GRU and LSTM can automatically capture temporal information in sequence data, which makes them suitable for time series prediction [Zhang et al., 2021]. LSTNet [Lai et al., 2018] designs a novel Reccurent-skip module to capture long-term dependence patterns and make the optimization easier. MQ-RNN [Gasthaus et al., 2019] combines quantile regression with LSTM and achieves great success in the Amazon e-commerce platform [Yu et al., 2024]. Lately, transformer-based models have been applied to time series prediction due to their outstanding sequential modeling capacity. Informer [Zhou et al., 2021a] devises a sparse selfattention mechanism to support the long sequence forecasting task. FEDformer [Zhou et al., 2022] introduces the seasonal trend decomposition method into the transformer to better capture the global view of time series. [Cao et al., 2023] proposes interactive parallel attention to learn long-range dependencies in both frequency and time domains, achieving superior performance. However, the above models cannot effectively capture complex sales patterns during the pandemic.
6 Conclusion
In this work, we introduce PCAN, a pandemic-compatible attentive network for retail sales forecasting. To achieve this, we propose a fluctuation attention module based on association discrepancy in sales series to capture irregular fluctuation trends. Additionally, we develop a parallel attention module that learns intricate temporal relationships between two types of covariates and target sales series in a decoupled manner. Furthermore, we devise a rectification decoding strategy, which predicts the volatility of sales with fluctuation patterns and heterogeneous information learned from the aforementioned modules. We conduct extensive experiments on four real-world food datasets from the SF Express supply chain system. The results demonstrate the superior performance of PCAN compared to state-of-the-art baselines. The model has been deployed as a fundamental component in the supply chain system to serve a world-leading food retailer.
Acknowledgments
This work was supported by ARC DP240101322, DP230101445.
@inproceedings{ijcai2025p1026,
  title     = {PCAN: A Pandemic-Compatible Attentive Neural Network for Retail Sales Forecasting},
  author    = {Li, Fan and Wang, Guoxuan and Chu, Huiyu and Cheng, Dawei and Wang, Xiaoyang},
  booktitle = {Proceedings of the Thirty-Fourth International Joint Conference on
               Artificial Intelligence, {IJCAI-25}},
  publisher = {International Joint Conferences on Artificial Intelligence Organization},
  editor    = {James Kwok},
  pages     = {9232--9240},
  year      = {2025},
  month     = {8},
  note      = {AI4Tech: AI Enabling Technologies},
  doi       = {10.24963/ijcai.2025/1026},
  url       = {https://doi.org/10.24963/ijcai.2025/1026},
}
TY - CPAPER TI - PCAN: A Pandemic-Compatible Attentive Neural Network for Retail Sales Forecasting AU - Li, Fan AU - Wang, Guoxuan AU - Chu, Huiyu AU - Cheng, Dawei AU - Wang, Xiaoyang T2 - Proceedings of the Thirty-Fourth International Joint Conference on Artificial Intelligence, IJCAI-25 PB - International Joint Conferences on Artificial Intelligence Organization PY - 2025 SP - 9232 EP - 9240 DO - 10.24963/ijcai.2025/1026 UR - https://doi.org/10.24963/ijcai.2025/1026 ER -Copied
Machine-readable versions of this paper, for tools and AI agents:





