
CycSeq: Leveraging Cyclic Data Generation for Accurate Perturbation Prediction in Single-Cell RNA-Seq
Proceedings of the Thirty-Fourth International Joint Conference on Artificial Intelligence. AI4Tech: AI Enabling Technologies. Pages 9277-9285.
https://doi.org/10.24963/ijcai.2025/1031
Keywords
- Domain-specific AI4Tech: AI4Care and AI4Health
- Domain-specific AI4Tech: AI4Biotech
- Domain-specific AI4Tech: AI4Medicine and AI4Drug
- Emerging AI4Tech: Emerging AI4Tech areas
Abstract
Understanding and predicting the effects of cellular perturbations using single-cell sequencing technology remains a critical and challenging problem in biotechnology. In this work, we introduce CycSeq, a deep learning framework that leverages cyclic data generation and recent advances in neural architectures to predict single-cell responses under specified perturbations across multiple cell lines, while also generating the corresponding single-cell expression profiles. Specifically, CycSeq addresses the challenge of learning heterogeneous perturbation responses from unpaired single-cell gene expression data by generating pseudo-pairs through cyclic data generation. Experimental results demonstrate that CycSeq outperforms existing methods in perturbation prediction tasks, as evaluated using computational metrics such as R-squared and MAE. Furthermore, CycSeq employs a unified architecture that integrates information from multiple cell lines, enabling robust predictions even for long-tail cell lines with limited training data. The source code is publicly available at https://github.com/yczju/cycseq.
- [Baldi, 2012] Pierre Baldi. Autoencoders, unsupervised learning, and deep architectures. In Proceedings of ICML workshop on unsupervised and transfer learning, pages 37-49. JMLR Workshop and Conference Proceedings, 2012.
- [Bendall et al., 2014] Sean C Bendall, Kara L Davis, El- ad David Amir, Michelle D Tadmor, Erin F Simonds, Tiffany J Chen, Daniel K Shenfeld, Garry P Nolan, and Dana Pe'er. Single-cell trajectory detection uncovers pro- gression and regulatory coordination in human b cell de- velopment. Cell, 157(3):714-725, 2014.
- [Bravo González-Blas et al., 2023] Carmen Bravo González-Blas, Seppe De Winter, Gert Hulselmans, Nikolai Hecker, Irina Matetovici, Valerie Christiaens, Suresh Poovathingal, Jasper Wouters, Sara Aibar, and Stein Aerts. Scenic+: single-cell multiomic inference of enhancers and gene regulatory networks. Nature methods, 20(9):1355-1367, 2023.
- [Bunne et al., 2023] Charlotte Bunne, Stefan G Stark, Gabriele Gut, Jacobo Sarabia Del Castillo, Mitch Levesque, Kjong-Van Lehmann, Lucas Pelkmans, An- dreas Krause, and Gunnar Rätsch. Learning single-cell perturbation responses using neural optimal transport. Na- ture methods, 20(11):1759-1768, 2023.
- [Chen et al., 2023] Yao Chen, Ziyang Xu, Hongxiang Sun, Xinxing Ouyang, Yuheng Han, Haihui Yu, Ningbo Wu, Yiting Xie, and Bing Su. Regulation of cd8+ t memory and exhaustion by the mtor signals. Cellular & Molecular Immunology, 20(9):1023-1039, 2023.
- [Chiyonobu et al., 2018] Norimichi Chiyonobu, Shu Shi- mada, Yoshimitsu Akiyama, Kaoru Mogushi, Michiko Itoh, Keiichi Akahoshi, Satoshi Matsumura, Kosuke Ogawa, Hiroaki Ono, Yusuke Mitsunori, et al. Fatty acid binding protein 4 (fabp4) overexpression in intratumoral hepatic stellate cells within hepatocellular carcinoma with metabolic risk factors. The American journal of pathology, 188(5):1213-1224, 2018.
- [Ding and Regev, 2021] Jiarui Ding and Aviv Regev. Deep generative model embedding of single-cell rna-seq profiles on hyperspheres and hyperbolic spaces. Nature communi- cations, 12(1):2554, 2021.
- [Dufva et al., 2023] Olli Dufva, Sara Gandolfi, Jani Huuh- tanen, Olga Dashevsky, Hanna Duàn, Khalid Saeed, Jay Klievink, Petra Nygren, Jonas Bouhlal, Jenni Lahtela, et al. Single-cell functional genomics reveals determinants of sensitivity and resistance to natural killer cells in blood cancers. Immunity, 56(12):2816-2835, 2023.
- [Grønbech et al., 2020] Christopher Heje Grønbech, Max- imillian Fornitz Vording, Pascal N Timshel, Casper Kaae Sønderby, Tune H Pers, and Ole Winther. scvae: varia- tional auto-encoders for single-cell gene expression data. Bioinformatics, 36(16):4415-4422, 2020.
- [icg, 2020] Pan-cancer analysis of whole genomes. Nature, 578(7793):82-93, 2020.
- [Kamimoto et al., 2023] Kenji Kamimoto, Blerta Stringa, Christy M Hoffmann, Kunal Jindal, Lilianna Solnica- Krezel, and Samantha A Morris. Dissecting cell identity via network inference and in silico gene perturbation. Na- ture, 614(7949):742-751, 2023.
- [Levine and Davidson, 2005] Michael Levine and Eric H. Davidson. Gene regulatory networks for develop- ment. Proceedings of the National Academy of Sciences, 102(14):4936-4942, 2005.
- [Li et al., 2015] Shufeng Li, Qiwei Wang, Qian Qiang, Haitao Shan, Minke Shi, Baojun Chen, Sheng Zhao, and Liudi Yuan. Sp1-mediated transcriptional regulation of malat1 plays a critical role in tumor. Journal of cancer research and clinical oncology, 141:1909-1920, 2015.
- [Lopez et al., 2018] Romain Lopez, Jeffrey Regier, Michael B Cole, Michael I Jordan, and Nir Yosef. Deep generative modeling for single-cell transcriptomics. Nature methods, 15(12):1053-1058, 2018.
- [Lotfollahi et al., 2019] Mohammad Lotfollahi, F Alexander Wolf, and Fabian J Theis. scgen predicts single-cell pertur- bation responses. Nature methods, 16(8):715-721, 2019.
- [Moon et al., 2019] Kevin R Moon, David Van Dijk, Zheng Wang, Scott Gigante, Daniel B Burkhardt, William S Chen, Kristina Yim, Antonia van den Elzen, Matthew J Hirn, Ronald R Coifman, et al. Visualizing structure and transitions in high-dimensional biological data. Nature biotechnology, 37(12):1482-1492, 2019.
- [Piran et al., 2024] Zoe Piran, Niv Cohen, Yedid Hoshen, and Mor Nitzan. Disentanglement of single-cell data with biolord. Nature Biotechnology, pages 1-6, 2024.
- [Replogle et al., 2022] Joseph M Replogle, Reuben A Saun- ders, Angela N Pogson, Jeffrey A Hussmann, Alexan- der Lenail, Alina Guna, Lauren Mascibroda, Eric J Wag- ner, Karen Adelman, Gila Lithwick-Yanai, et al. Map- ping information-rich genotype-phenotype landscapes with genome-scale perturb-seq. Cell, 185(14):2559-2575, 2022.
- [Roohani et al., 2024] Yusuf Roohani, Kexin Huang, and Jure Leskovec. Predicting transcriptional outcomes of novel multigene perturbations with gears. Nature Biotech- nology, 42(6):927-935, 2024.
- [Srivatsan et al., 2020] Sanjay R. Srivatsan, José L. McFaline-Figueroa, Vijay Ramani, Lauren Saunders, Junyue Cao, Jonathan Packer, Hannah A. Pliner, Dana L. Jackson, Riza M. Daza, Lena Christiansen, Fan Zhang, Frank Steemers, Jay Shendure, and Cole Trapnell. Mas- sively multiplex chemical transcriptomics at single-cell resolution. Science, 367(6473):45-51, 2020.
- [Wolf et al., 2019] F Alexander Wolf, Fiona K Hamey, Mireya Plass, Jordi Solana, Joakim S Dahlin, Berthold Göttgens, Nikolaus Rajewsky, Lukas Simon, and Fabian J Theis. Paga: graph abstraction reconciles clustering with trajectory inference through a topology preserving map of single cells. Genome biology, 20:1-9, 2019.
- [Zhang et al., 2020] Yuqing Zhang, Giovanni Parmigiani, and W Evan Johnson. Combat-seq: batch effect adjust- ment for rna-seq count data. NAR genomics and bioinfor- matics, 2(3):lqaa078, 2020.
- [Zhou et al., 2016] Tinghui Zhou, Philipp Krahenbuhl, Mathieu Aubry, Qixing Huang, and Alexei A Efros. Learning dense correspondence via 3d-guided cycle consistency. In Proceedings of the IEEE conference on computer vision and pattern recognition, pages 117-126, 2016.
- [Zhou et al., 2023] Yifan Zhou, Kaixuan Luo, Lifan Liang, Mengjie Chen, and Xin He. A new bayesian factor anal- ysis method improves detection of genes and biological processes affected by perturbations in single-cell crispr screening. Nature Methods, 20(11):1693-1703, 2023.
References were extracted automatically from the PDF and may contain errors.
Full text extracted automatically from the PDF; figures, tables and equations may differ. The PDF is the version of record.
1 Introduction
Single-cell experiments provide fine-grained insights into cell types and states, thereby enabling researchers to analyze cellular heterogeneity at an unprecedented resolution. Moreover, single-cell perturbation studies are particularly crucial because they allow researchers to investigate gene function and cellular responses to various stimuli or genetic modifications at the individual cell level. However, the high dimensionality of gene expression data can pose substantial challenges for extracting valuable information from single-cell sequencing datasets.
As single-cell technologies continue to advance and the demand for detailed medicinal insights grows, the use of CRISPR-based perturbation data is increasing. Nonetheless, current datasets covering multiple cell lines remain limited in both scale and comprehensiveness. Consequently, there is an urgent need for computational methods capable of generating and analyzing such data to support expanding integrative studies.
∗ Corresponding authors.
1.1 RelatedWork
Several deep learning-based approaches have been developed to predict the effects of perturbations in single-cell data, often through latent representations. For example, CellOT [Bunne et al., 2023] employs input convex neural networks to model cell state transitions via optimal transport, and Guided Sparse Factor Analysis (GSFA) [Zhou et al., 2023] defines gene modules in a latent space to predict perturbations. However, these methods typically generate a latent representation of original scRNA-seq data rather than the perturbed single-cell expression profiles. This focus on latent representations limits the scope of downstream analyses and may introduce bias when assessed against ground truth data.
Other methods leverage Variational AutoEncoders (VAEs) [Baldi, 2012] to generate single-cell expression data. For instance, scGen [Lotfollahi et al., 2019] predicts single-cell perturbation responses using an architecture that adapts vector arithmetic for scRNA-seq data. Meanwhile, scVI [Lopez et al., 2018] employs a scalable hierarchical Bayesian model implemented with VAEs to analyze scRNA-seq data, and scVAE [Grønbech et al., 2020] extends traditional VAE frameworks to better accommodate zero-inflation. Biolord [Piran et al., 2024], on the other hand, leverages disentangled representations to predict perturbed gene expression. While such approaches demonstrate promising performance, they often struggle to adapt to novel cell lines and are limited to perturbations included in the training data.
As a result, attempts have been made to incorporate prior knowledge of gene regulatory networks [Levine and Davidson, 2005] to more accurately capture gene-gene interactions. For example, CellOracle [Kamimoto et al., 2023] and SCENIC+ [Bravo Gonz´alez-Blas et al., 2023] model in silico gene perturbations by inferring gene regulatory networks, although constructing precise networks can be challenging for incomplete datasets and typically focuses on predicting transcription factor perturbations. GEARS [Roohani et al., 2024] integrates a knowledge graph of gene-gene relationships with deep learning to simulate genetic perturbations, allowing it to generalize to novel perturbation spaces. However, practical application of these models can still be constrained by data scarcity, especially when dealing with long-tail cell lines or extensive perturbation spaces.
1.2 Associated Challenges and Our Approach
Single-cell RNA sequencing (scRNA-seq) data are highdimensional, although they are often well-described by lower-dimensional manifolds or principal components [Ding and Regev, 2021]. Many previous methods leverage graphbased or neural network models in these reduced-dimensional spaces [Bendall et al., 2014; Wolf et al., 2019], but considerable challenges remain. Specifically, model training is complicated by the lack of paired data-i.e., before- and afterperturbation observations from the same cell, and by the longtail data distribution characterizing cell lines. These factors make out-of-sample predictions particularly challenging and often restrict analyses to single cell lines or tissue types, requiring multiple sub-models to be trained for different lines. Cell lines with limited data are especially problematic because they reduce model generalizability, and many frameworks are not designed to handle multi-cell line data simultaneously.
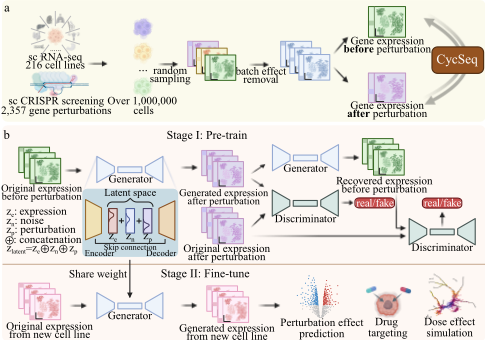
To address these challenges, we present CycSeq, a deep learning framework that leverages cyclic data generation for unpaired before- and after-perturbation datasets. CycSeq incorporates a pre-training stage across multiple cell lines, followed by a fine-tuning stage on a specific cell line. In this way, CycSeq develops a generalized multi-cell line model that can transfer knowledge from data-rich lines to those with fewer samples. Upon fine-tuning, CycSeq achieves accurate predictions for various tasks, including drug effect analysis and drug target discovery, even in scenarios where only limited data are available.
2 Methodology
2.1 Overall Structure
We present CycSeq, a deep learning framework designed to handle unpaired before-perturbation (control) and afterperturbation single-cell expression profiles without relying on simulation data (Figure 1). In the pre-training stage, our model assumes that gene inactivation in different cell lines often produces similar effects. For example, in A549, HeLa, and HepG2 cell lines, knock-down of the MALAT1 gene yields comparable responses [Li et al., 2015]. During finetuning, the model could learn the data distribution of a specific cell line to guide data generation processes and achieve improved performance.
CycSeq employs an integrated single-cell gene expression training set that includes multiple cell lines, incorporating effective batch-effect elimination for the pre-training stage, and focuses on a target cell line for the fine-tuning stage. Datarich cell lines can be leveraged during pre-training to transfer knowledge to data-insufficient cell lines in both the pretraining and fine-tuning stages. Consequently, the perturbation prediction problem is addressed through an inherent logical sequence: (1) using the pre-trained CycSeq to predict perturbation effects in data-insufficient or previously unseen cell lines, and (2) employing the fine-tuned CycSeq to predict perturbation effects more accurately for specific cell lines that have sufficient training data. As such, the model remains adaptable to most cell lines, even in scenarios where the target cell line for generated data is excluded from the training process.
2.2 Data Integration
Data Source
We utilize multiple data sources to train CycSeq. The first source derives from a comprehensive study on aberrations in patients who underwent radical hepatectomy as a treatment for hepatocellular carcinoma (HCC)[Chiyonobu et al., 2018], encompassing 25 gene-level perturbations in the K562 (chronic myeloid leukemia) cell line.
Our second dataset comprises single-cell CRISPR natural killer (NK) cells and non-natural killer (noNK) cells from Crop-Seq [Dufva et al., 2023]. Perturbations were introduced in 5 distinct representative cell lines (K562, LP1, MM1, NALM6, and SUDHL4) within both NK and noNK cell populations, targeting the functionality of 78 genes. For comparative analysis, the single-cell expressions from noNK cells were used as a control group.
Our third data source stems from a genome-wide perturbseq study[Replogle et al., 2022] that involved perturbing all expressed genes in the RPE1 and K562 cell lines. We selected targeted common essential genes for the RPE1 cell line (n=2,057) and the K562 cell line (n=1,973).
Lastly, the Pan-cancer analysis [icg, 2020] dataset was integrated from 201 unique cell lines, each serving as a putative normal control sample.
Data Pre-process
Initially, the single-cell gene expression data was log normalized, utilizing the original count metrics. Let's denote the original count metrics as
where g and c represent for gene number and cell number, respectively. Next, for generalized training process, the intersection of genes across all metrics was identified, represented as gi = 6, 742. M gi,c is used for model training and validation. The metrics were then log-normalized as
In order to ensure that the observed variations in the dataset reflect authentic biological differences rather than artifacts arising from different experimental conditions and to enhance the precision and eliminate the potential batch effect, ComBat [Zhang et al., 2020] was employed across 4,728 batches in 9 cell lines to eliminate batch effects. We used single-cell data from 201 distinct cell lines in the Pan-cancer project[icg, 2020] as the reference. The single-cell expression profile was aligned to this reference in each batch.
Subsequently, we defined cs as randomly selected cells in each single cell gene expression data. We defined a bit vector cls for each data to identify perturbed genes. The concatenation operation is symbolized as ⊕. Random samplings were performed on the gene expression data with selected cells Dgi,cs for R times, represented as
where cs and NR denotes the number of random samplings applied to each gene knockout spectrum across each cell line, respectively. cs and gi are adjustable hyper-parameter and could be defined by users. We set the value of cs = 50 and NR = 50. We designated N i c as the number of cells within the i - th expression spectrum. In instances where c < 50, we implemented sampling with duplicates. After random sampling, in the instance of each control set of each cell line, we made adjustments to D in accordance with their corresponding knockout genes, represented by K. This procedure yielded a putatively gene-paired dataset P , consisting of perturbed and unperturbed datasets. This is conveyed as
where P denotes the basic dataset unit in the training process and NK implies the number knocked-out genes gk across all cell lines. To guarantee that every gene knockout is incorporated in the intersection of genes across all datasets, we subsequently filtered the knocked-out genes as gk = gk ∩ gi.
Finally, datasets were split into training and validation sets. We implemented the leave-one-out (LOO) strategy, in which, out of R samplings, one single random instance j was designated as the validation set, and the remaining R-1 instances were allocated as the training set.
2.3 Pre-train with Generalized Cell Lines
CycSeq is a deep learning generative model with several components for joint optimization. The input of CycSeq is a dataset
where K is the number of distinct gene knock across all cell lines and R is the number of the random sampling. For each perturbation k, Dgi,c k,r ∈ Rgi ×Rc .
We defined two gene expression distribution fields corresponding to perturbed and unperturbed single cell expression data. The aim of CycSeq is to learn the mappings from perturbed data to unperturbed data G (and F vice versa). In an effort to construct generalized mappings Gpt and Fpt applicable across multiple cell lines, we have employed a pretraining process with data sourced from various cell lines, where Gpt and Fpt denotes mappings in pre-training stage. We deal with unpaired data using cyclic data generation.
2.4 Fine-tune with Specific Cell Line
Following the pre-training stage, mappings G and F undergoes fine-tuning. In instances where data Dgi,cs kc,r is available for a particular cell line, where kc denotes the perturbed genes in this specific cell line, enhanced models in the fine-tuning stage Gft and Fft is conceived through the guidance of Gpt and Fpt.
By utilizing specific data for each cell line with available data and fine-tuning the model, we are able to significantly augment the data generation competencies of the model for the corresponding cell line.
2.5 Network Architecture
We assume that specific nonlinear relationships exist between the corresponding cells in P and N, which represent two distinct states of the same cell line and can be captured by a deep neural network. Although we lack explicit paired examples, we can generate the corresponding expression through a cyclic model architecture. Concretely, we have one set of scRNA-seq expression profiles in P and another set in N. First, our goal is to learn a mapping G: P → N which transforms the expression from distribution of Pdata to Ndata. The mapping G we trained :P → N produce output ˆn = G(p), p ∈ P, is indistinguishable from expression n ∈ N by an adversary trained to classify ˆn apart from n. This objective is designed to induce an output distribution that conform to distribution of all n ∈ N. The optimal G thereby translates the domain P to a domain ˆN distributed identically to N. However, without the format of supervised learning, there exists many G for each p to induce the same distribution over ˆn which is not a meaningful way. In practice, without supervision, models tend to generate same ˆn when optimizing the adversarial object. We follow the definition cycle consistent proposed in CycleGAN. In our task, that is we transform scRNA-seq expression from perturbation to control, then transform again from control to perturbation. Mathematically, we have a generator G : P → N and another generator F : N → P , then G and F should be inverses of each other, and both mappings should be bijection. We apply this structural assumption by training both the mapping G and F simultaneously, and adding a cycle consistency loss [Zhou et al., 2016] that encourages F(G(p)) ≈ p and G(F(n)) ≈ n. Therefore, we train the unsupervised model in a supervised formula by generating corresponding target in another field without any simulated dataset. These two mappings are both guided by adversarial losses. The full training objective is
Each stage of the CycSeq model can be defined as training two mappings based on the fundamental architecture of an auto-encoder. Taking the pre-training stage as an example, one mapping Fpt ◦ Gpt : N → N is learned jointly with another mapping Gpt ◦ Fpt : P → P. However, these mappings diverge from the original auto-encoders in that they map an expression spectrum to the corresponding expression via a latent representation, which translates the spectrum into another domain (perturbation to control, and vice versa).
Generator Architecture
Our model utilizes an encoder-decoder architecture for the generator, purposed for the generation of gene expression data. The generator utilize an input that is a concatenation of gene expression data as well as condition information which encompasses the perturbed gene condition and the batch condition. In particular, the input vector is assembled from these three components:
- Gene expression data: Denoted as x ∈ RN , where N delineates the number of genes.
- Perturbed Gene Condition: Shown as a one-hot encoded vector p ∈ 0, 1Kp , where Kp characterizes the number of unique perturbed genes.
- Batch condition: Expressed as a one-hot encoded vector b ∈ 0, 1Kb , where Kb signifies the number of batches.
The unified input vector is thus represented as zin = [x; p; b] ∈ RN+Kp+Kb .
To more effectively capture the impact of condition information on gene expression, we introduce condition embedding layers. The one-hot encoded vectors for the perturbed gene condition and batch condition are mapped onto a lowerdimensional embedding space. Specifically: Perturbed gene embedding: ep = Embeddingp (p) ∈ RH , batch embedding: eb = Embeddingb (b) ∈ RH . Here, the H is the dimensionality of the embedding space.
Encoder Network
The Generator employs an encoder-decoder architecture that begins with an encoder network, which maps the concatenated input of gene expression data, perturbed gene embeddings, and batch embeddings into a structured latent space. The input to the encoder combines the gene expression vector x, the perturbed gene embedding ep, and the batch embedding eb. These are concatenated to form the input vector h0,
with dimensionality N + 2H, where N is the dimensionality of the gene expression data, and H is the dimensionality of the embedding space. The concatenated input is processed by a fully connected layer and then activated by PReLU to introduce nonlinearity:
where W1 and b1 denote the weights and biases of the fully connected layer, respectively. To enhance feature extraction, the network sequentially applies L residual blocks, which are designed to improve gradient flow and representation learning:
for l = 1 to L. A self-attention mechanism is subsequently applied to capture the dependencies among genes. This enables the encoder to focus on important features:
The final output of the encoder is projected into six distinct latent vectors, representing the mean and log variance parameters for expression, KO (KnockOut) perturbation, and noise latent spaces.
Reparameterization
To enable efficient sampling in the latent space while maintaining back-propagation capabilities, we employ the reparameterization trick. The mean and log variance parameters output by the encoder are used to compute the latent vectors as follows: The standard deviation is computed as: σ = exp (0.5 log σ2 ). The latent vector for each space is then sampled by introducing a noise vector ϵ ∼ N(0, I), and performing the following transformation: z = µ+σ⊙ϵ, where z corresponds to the samples drawn from the KO perturbation, expression, and noise latent distributions (zko, zexp, znoise).
Decoder Network
The decoder reconstructs the input gene expression and conditional information by processing the latent vectors and embeddings. After latent vector concatenation, the sampled latent vectors zko, zexp, and znoise are concatenated with the perturbed gene embedding ep and the batch embedding eb to form the decoder input:
where the dimensionality becomes 3D + 2H. The concatenated input is passed through a fully connected layer with PReLU activation:
Similar to the encoder, the decoder applies L residual blocks to model complex non-linear mappings to capture dependencies and refine the feature representations:
for l = 1 to L. A self-attention mechanism is subsequently applied to capture the dependencies among genes. This enables the encoder to focus on important features:
A final linear projection maps the output into the original dimensionality space, representing the reconstructed gene expression and the one-hot encoding for perturbed gene and batch conditions:
The output vector o is split into three segments:
- The first segment corresponds to the gene expression data, activated using PReLU: ˆx = PReLU(o[:N]).
- The second segment represents the embedding for the perturbed gene condition: ˆ p = o[N:N+Kp].
- The final segment contains the embedding for batch conditions: ˆb = o[N+Kp:].
In this way, the decoder faithfully reconstructs the original input while preserving essential features and conditional information encoded in the latent spaces.
Residual Blocks
Incorporating residual blocks into our architecture improves gradient flow during back-propagation and enables deeper networks to capture complex non-linear relationships. First, the input h is linearly transformed and passed through a PReLU activation: r1 = PReLU(Wr1h + br1), then Dropout is applied to r1 to reduce over-fitting by randomly deactivating a fraction p of neurons: rdrop = Dropout(r1, p). Next, another linear transformation produces r2: r2 = Wr2rdrop+br2, which is added to the original input h, and a final PReLU activation is applied: hout = PReLU(r2+h). This residual connection simplifies identity learning and allows the optimizer to guide the residual function toward zero when necessary, thus stabilizing and accelerating the training process.
Self-AttentionMechanism To enhance the model's ability to learn dependencies within the input data, particularly longrange dependencies among gene interactions, we employ a self-attention mechanism. This mechanism enables the model to focus on critical parts of the input sequence by dynamically weighting its elements. The self-attention process is defined as follows:
The input feature vector h is linearly projected into three separate spaces to form queries Q, keys K, and values V : Q = WQh, K = WKh, V = WV h. Attention Scores Calculation: The attention scores are computed by taking the dot product between the queries and keys, scaled by the square root of the dimensionality of the keys (dk), and applying a softmax function to ensure that the scores sum to one:
The self-attention mechanism provides the model with the capability to assign varying importance to different parts of the gene expression input, thus learning more sophisticated feature representations.
2.6 Training Objective
The training process of the generator and discriminator is driven by a composite loss function that integrates adversarial, reconstruction, and regularization components.
Adversarial Loss
The adversarial loss guides the generator to produce outputs that are indistinguishable from real data samples, while the discriminator aims to correctly classify real and generated samples:
Generator Loss: Encourages the generation of realistic scRNA profiles by minimizing the negative log-likelihood of the discriminator classifying the generated samples as real:
Discriminator Loss: Directs the discriminator to maximize the separation between real and generated samples:
Reconstruction Loss
The reconstruction loss measures the discrepancy between the original and reconstructed gene expression data and conditions, ensuring that the generator maintains fidelity to the input data. The total reconstruction loss is split into three parts as follows:
- Gene expression reconstruction loss:
- Perturbed gene reconstruction loss:
- Batch label reconstruction loss:
Regularization
The Kullback-Leibler (KL) divergence term imposes a regularization constraint that aligns the approximate posterior distribution with the prior distribution:
Total Loss Function
The ultimate objective minimizes a weighted sum of the adversarial, reconstruction, and regularization losses to ensure optimal performance of both the generator and discriminator:
where λrec, λp, λb, and λKL are hyper-parameters that control the contributions of each component.
Implementation Details
The data integration of the experiments were conducted using R version 4.3.1, with the Seurat package version 5.0.1 and SeuratDisk version 0.0.0.9021. All other experiments were conducted using python 3.9.11, PyTorch 2.3.1, CUDA 12.4, numpy 1.23.5, scanpy 1.9.6 and scikit-learn 1.0.2.
Hyperparameters
In both the pre-training and fine-tuning stages, we configure all generator architectures of G and F with hidden linear layers of widths 1,024, 512, 256, and 128. A learning rate decay of 0.9 is applied after each ⌊0.1 ∗ num epoch⌋. G and F are learned in an iterative fashion.
In the pre-training stage, we set the maximum training epoch to 100, the batch size to 512, the optimizer to Adam (with a learning rate of 0.0002, (β1 = 0.5, β2 = 0.9), and λ = 1. In the fine-tuning stage, which adapts the pre-trained model to a small dataset of a specific cell line, the maximum training epoch is set to 30, the batch size to 64, and the optimizer to RMSprop with a learning rate of 0.00001. Early stopping is employed to mitigate overfitting, with patience values of 30 and 10 for the two stages, respectively.
3 Experiments
3.1 Performance
Pre-trained CycSeq Successfully Predict Perturbation Effects Across Cell Lines
We pre-trained CycSeq on over 1 million cells covering 4,728 gene perturbations across nine cell lines. Then, CycSeq was applied to a published genome-scale Perturb-seq dataset, which involves CRISPR interference (CRISPRi) of all expressed genes in over 2.5 million human cells [Replogle et al., 2022].
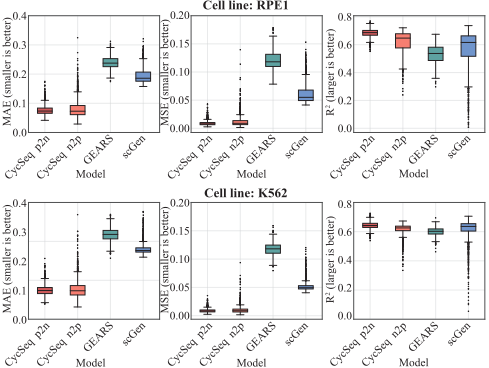
To evaluate the performance of the model, we employed several metrics commonly used in generative models, including R-suqared, Mean Square Error (MSE), and Mean Absolute Error (MAE). In two cell lines, RPE1 and K562, CycSeq outperforms other methods (Figure 2).
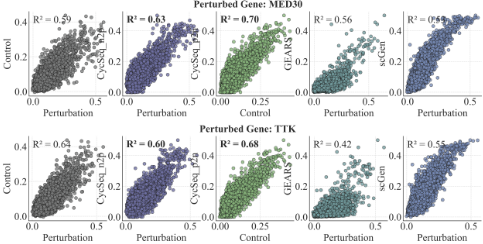
Knocking out a single gene usually results in minimal alterations on global expression profile, thus, the similarity between perturbation and control remains high. In generative models, targets highly similar to the input can inflate performance metrics. Consequently, we selected key cancer-related genes to test whether the similarity between the target and the output surpasses that between the input and the output, thereby providing a rigorous validation of the model.
The MED30 gene encodes a subunit of the Mediator complex, a pivotal co-activator in transcriptional regulation, and its altered expression has been linked to various cancers, underscoring its therapeutic potential. TTK protein kinase (TTK), also known as Monopolar Spindle 1 (MPS1), is a key regulator of the spindle assembly checkpoint (SAC), which preserves genomic integrity. We used perturbation data from the knockout of these two genes in the K562 cell line to validate CycSeq in both prediction directions. As a result, CycSeq achieves average R-squared of 0.70 and 0.68 between the target and the output, surpassing both the input-output similarity and the performance of other models, including GEARS and scGen (Figure 3).
| Model | Cell line | R2 ↑ | MAE ↓ | MSE ↓ |
|---|---|---|---|---|
| scGen | K562 | 0.723 | 0.158 | 0.042 |
| LP1 | 0.881 | 0.102 | 0.019 | |
| MM1 | 0.875 | 0.1 | 0.019 | |
| SUDHL4 | 0.846 | 0.116 | 0.024 | |
| NALM6 | 0.86 | 0.108 | 0.022 | |
| GEARS | K562 | 0.625 | 0.242 | 0.102 |
| LP1 | 0.652 | 0.192 | 0.061 | |
| MM1 | 0.757 | 0.162 | 0.044 | |
| SUDHL4 | 0.637 | 0.223 | 0.094 | |
| NALM6 | 0.673 | 0.196 | 0.072 | |
| CycSeq p2n | K562 | 0.827 | 0.035 | 0.002 |
| LP1 | 0.849 | 0.048 | 0.004 | |
| MM1 | 0.868 | 0.049 | 0.004 | |
| SUDHL4 | 0.807 | 0.05 | 0.004 | |
| NALM6 | 0.85 | 0.053 | 0.005 | |
| CycSeq n2p | K562 | 0.835 | 0.031 | 0.002 |
| LP1 | 0.845 | 0.036 | 0.003 | |
| MM1 | 0.927 | 0.02 | 0.001 | |
| SUDHL4 | 0.877 | 0.028 | 0.001 | |
| NALM6 | 0.909 | 0.022 | 0.001 |
Fine-tuned CycSeq Accurately Predict Single Cell Perturbation Effect in Multiple Cell Lines
During the CycSeq fine-tuning stage, our proposed CycSeq n2p generally outperforms other models across multiple metrics, achieving higher R-squared and lower MAE and MSE on the K562, LP1, MM1, SUDHL4, and NALM6 cell lines derived from Crop-Seq (Table 1). This robust performance validates the model's ability to generalize across different cell lines, reflecting CycSeq's effective adaptation to various batch effect removal strategies. By specifically optimizing CycSeq for target cell lines, we further enable the prediction of cell line-specific features with greater precision.
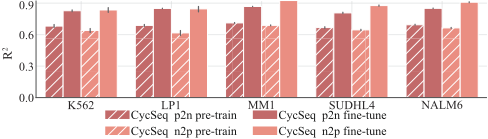
It is important to note that, despite exhibiting similarity to the pre-trained CycSeq in most indicators, the finetuned model evinces significant out-performance over the pre-trained model of R2 across various cell lines (Figure 4). This observation lends further support to the assertion that CycSeq can attain more precise predictions through the finetuning stage, especially for those data-rich cell lines.
| Drug name | R2 ↑ | MAE ↓ | MSE ↓ |
|---|---|---|---|
| Capecitabine | 0.549 | 0.026 | 0.002 |
| Disulfiram | 0.559 | 0.024 | 0.001 |
| Entacapone | 0.588 | 0.022 | 0.001 |
| Meprednisone | 0.566 | 0.026 | 0.001 |
| Mercaptopurine | 0.514 | 0.025 | 0.001 |
CycSeq Simulates Dynamic Drug Perturbation Effects on Expression
To test the practical applications of CycSeq, we carried out performance evaluation of CycSeq on a series of compoundinduced perturbations. CycSeq was evaluated using a singlecell high-throughput screening library that includes 290,888 transcriptional profiles of 188 active compounds targeting a diverse range of enzymes and molecular pathways [Srivatsan et al., 2020]. We split the dataset based on the number of genes each compound impacts. Single gene-targeting compound affected profiles are chosen as the test set.
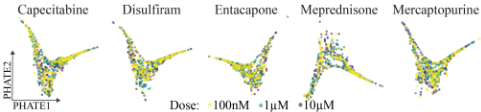
Among the screened cell lines, K562 was treated with each of these 188 compounds at four dosages (10 nM, 100 nM, 1 µM, 10 µM). We trained our CycSeq n2p model to predict the perturbation response of cells exposed to increasingly higher dosages, visualizing the results with PHATE [Moon et al., 2019]. We found that the fine-tuned CycSeq n2p could accurately predict gene expression in cells receiving higher dosages from sc-RNA-seq data of cells exposed to lower dosages (Table 2). Notably, predictions from different dosages clustered together (Figure 5).
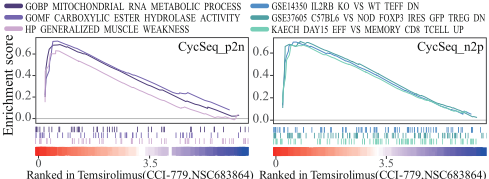
We performed Gene Set Enrichment Analysis (GSEA) on the results predicted by CycSeq, using Temsirolimus (CCI779 NSC683864) as an example. Temsirolimus, a piperidine ketone derivative and a specific inhibitor of the mammalian target of rapamycin (mTOR), is an anti-tumor drug that regulates cell proliferation, growth, survival, and angiogenesis.
Ranked in Temsirolimus(CCI-779,NSC683864)
Ranked in Temsirolimus(CCI-779,NSC683864)
Figure 6: GSEA analysis of CycSeq prediction on Temsirolimus.
By inhibiting mTOR activity, Temsirolimus effectively halts cancer cell growth and reproduction.
The top three enriched pathways identified from the CycSeq n2p predictions include: (1) regulation of regulatory T cell (Treg) development and homeostasis via interleukin-2 receptor (IL-2R) signaling; (2) downregulated genes in Foxp3ires-GFP T regulatory cells; and (3) upregulated genes in effector CD8+ T cells compared to memory CD8+ T cells during contraction. Consistent with these findings, it is reported that CD8+ T cells typically exhibit impaired mTORC1 and mTORC2 activity [Chen et al., 2023]. The IL-2R signaling pathway is critical for Treg cells, with mTOR signaling serving as a key regulatory factor in Treg cell development. Consequently, knockdown of FKBP1A may alter mTOR signaling, indirectly affecting IL-2R signal transduction, and thus influencing Treg cell development and function. Notably, mTOR signaling plays a pivotal role in Treg cell differentiation, and altered FKBP1A expression may impact Foxp3 expression and its downstream genes in Treg cells.
In contrast, the top enriched pathways predicted by CycSeq p2n in cell expression data include: (1) hydrolysis of carboxylic ester bonds; and (2) pathways related to RNA transcription from the mitochondrial genome in mitochondria. These pathways are primarily linked to cellular metabolism, reflecting fundamental biological processes.
This analysis indicates the ability of CycSeq to predict biologically relevant pathways consistent with known mechanisms, thereby highlighting the model's potential in capturing complex cellular dynamics.
4 Conclusion
To efficiently leverage before- and after-perturbation unpaired data in multi-cell lines for training, we developed CycSeq, which integrates a pre-training stage across multiple cell lines with fine-tuning stage within a specific cell line. The pre-trained CycSeq is designed to produce a generalized model capable of transferring knowledge from data-rich cell lines to those with limited data. Subsequently, the fine-tuned CycSeq can provide accurate predictions for individual cell lines in applications such as drug effect analysis. By facilitating the exploration of gene functions in diverse cellular contexts and accelerating drug dose analysis, CycSeq holds promise for more efficient and personalized healthcare solutions.
Ethical Statement
There are no ethical issues.
Acknowledgments
This work has been supported by Zhejiang Province "Jianbing" Key R&D Project of China (No.2025C01010).
@inproceedings{ijcai2025p1031,
  title     = {CycSeq: Leveraging Cyclic Data Generation for Accurate Perturbation Prediction in Single-Cell RNA-Seq},
  author    = {Liu, Yicheng and Wu, Sai and Zhang, Tianyun and Yao, Chang and Shen, Ning},
  booktitle = {Proceedings of the Thirty-Fourth International Joint Conference on
               Artificial Intelligence, {IJCAI-25}},
  publisher = {International Joint Conferences on Artificial Intelligence Organization},
  editor    = {James Kwok},
  pages     = {9277--9285},
  year      = {2025},
  month     = {8},
  note      = {AI4Tech: AI Enabling Technologies},
  doi       = {10.24963/ijcai.2025/1031},
  url       = {https://doi.org/10.24963/ijcai.2025/1031},
}
TY - CPAPER TI - CycSeq: Leveraging Cyclic Data Generation for Accurate Perturbation Prediction in Single-Cell RNA-Seq AU - Liu, Yicheng AU - Wu, Sai AU - Zhang, Tianyun AU - Yao, Chang AU - Shen, Ning T2 - Proceedings of the Thirty-Fourth International Joint Conference on Artificial Intelligence, IJCAI-25 PB - International Joint Conferences on Artificial Intelligence Organization PY - 2025 SP - 9277 EP - 9285 DO - 10.24963/ijcai.2025/1031 UR - https://doi.org/10.24963/ijcai.2025/1031 ER -Copied
Machine-readable versions of this paper, for tools and AI agents:





