
City-Level Foreign Direct Investment Prediction with Tabular Learning on Judicial Data
Proceedings of the Thirty-Fourth International Joint Conference on Artificial Intelligence. AI and Social Good. Pages 9936-9944.
https://doi.org/10.24963/ijcai.2025/1104
Keywords
- Multidisciplinary Topics and Applications: General
Abstract
To advance the United Nations Sustainable Development Goal on promoting sustained, inclusive, and sustainable economic growth, foreign direct investment (FDI) plays a crucial role in catalyzing economic expansion and fostering innovation. Precise city-level FDI prediction is quite important for local government and is commonly studied based on economic data (e.g., GDP). However, such economic data could be prone to manipulation, making predictions less reliable. To address this issue, we try to leverage large-scale judicial data which reflects judicial performance influencing local investment security and returns, for city-level FDI prediction. Based on this, we first build an index system for the evaluation of judicial performance over twelve million publicly available adjudication documents according to which a tabular dataset is reformulated. We then propose a new Tabular Learning method on Judicial Data (TLJD) for city-level FDI prediction. TLJD integrates row data and column data in our built tabular dataset for judicial performance indicator encoding, and utilizes a mixture of experts model to adjust the weights of different indicators considering regional variations. To validate the effectiveness of TLJD, we design cross-city and cross-time tasks for city-level FDI predictions. Extensive experiments on both tasks demonstrate the superiority of TLJD (reach to at
least 0.92 R2) over the other ten state-of-the-art baselines in different evaluation metrics.
- [Akbari et al., 2021] Amir Akbari, Lilian Ng, and Bruno Solnik. Drivers of economic and financial integration: A machine learning approach. Journal of Empirical Finance, 61:82-102, 2021.
- [Breiman, 2001] Leo Breiman. Random forests. Machine Learning, 45(1):5-32, 2001.
- [Briviba et al., 2024] Andre Briviba, Bruno Frey, Louis Moser, and Sandro Bieri. Governments manipulate offi- cial statistics: Institutions matter. European Journal of Political Economy, 82:102523, 2024.
- [Bruneckiene et al., 2019] Jurgita Bruneckiene, Robertas Jucevicius, Ineta Zykiene, Jonas Rapsikevicius, and Man- tas Lukauskas. Assessment of investment attractiveness in european countries by artificial neural networks: What competences are needed to make a decision on collective well-being? Sustainability, 11(24), 2019.
- [Chen and Guestrin, 2016] Tianqi Chen and Carlos Guestrin. XGBoost: A scalable tree boosting system. In Proc. of KDD, page 785-794, 2016.
- [Cheng et al., 2024] Yi Cheng, Renjun Hu, Haochao Ying, Xing Shi, Jian Wu, and Wei Lin. Arithmetic feature inter- action is necessary for deep tabular learning. In Proc. of AAAI, pages 11516-11524, 2024.
- [Chentouf et al., 2024] Amine Chentouf, Jihad Ait Sous- sane, and Zahra Mansouri. Deep learning-driven forecast- ing of Moroccan FDI: an LSTM-based approach. In Proc. of ICCSC, pages 1-6, 2024.
- [Demirguc-Kunt, 2022] Asli Demirguc-Kunt. Europe and central asia economic update, spring 2022: War in the re- gion. Technical report, World Bank Group, 2022.
- [Friedman, 2001] Jerome H. Friedman. Greedy function ap- proximation: A gradient boosting machine. The Annals of Statistics, 29(5):1189-1232, 2001.
- [Gorishniy et al., 2021] Yury Gorishniy, Ivan Rubachev, Valentin Khrulkov, and Artem Babenko. Revisiting deep learning models for tabular data. In Proc. of NeurIPS, pages 18932-18943, 2021.
- [He et al., 2016] Kaiming He, Xiangyu Zhang, Shaoqing Ren, and Jian Sun. Deep residual learning for image recog- nition. In Proc. of CVPR, pages 770-778, 2016.
- [Huang et al., 2021] Juan Huang, Bifang Zhou, Huajun Huang, Jianjiang Liu, and Neal N. Xiong. An adap- tive lasso grey model for regional FDI statistics predic- tion. Computers, Materials and Continua, 69(2):2111- 2121, 2021.
- [Ke et al., 2017] Guolin Ke, Qi Meng, Thomas Finley, Taifeng Wang, Wei Chen, Weidong Ma, Qiwei Ye, and Tie-Yan Liu. LightGBM: a highly efficient gradient boost- ing decision tree. In Proc. of NeurIPS, page 3149-3157, 2017.
- [Kilanioti and A. Papadopoulos, 2023] Irene Kilanioti and George A. Papadopoulos. A knowledge graph-based deep learning framework for efficient content similarity search of sustainable development goals data. Data Intelligence, 5(3):663-684, 2023.
- [Kingma and Ba, 2015] Diederik P. Kingma and Jimmy Ba. Adam: A method for stochastic optimization. In Proc. of ICLR, 2015.
- [Konovsky, 2000] Mary A Konovsky. Understanding pro- cedural justice and its impact on business organizations. Journal of Management, 26(3):489-511, 2000.
- [Lei Ba et al., 2016] Jimmy Lei Ba, Jamie Ryan Kiros, and Geoffrey E Hinton. Layer normalization. arXiv preprint arXiv:1607.06450, 2016.
- [Prokhorenkova et al., 2018] Liudmila Prokhorenkova, Gleb Gusev, Aleksandr Vorobev, Anna Veronika Dorogush, and Andrey Gulin. CatBoost: unbiased boosting with categor- ical features. In Proc. of NeurIPS, page 6639-6649, 2018.
- [Rapoo et al., 2023] Mogari Ishmael Rapoo, Martin Chanza, and Elias Munapo. Modelling and forecasting foreign di- rect investment: A comparative application of machine learning based evolutionary algorithms hybrid models. In Proc. of ICO, pages 23-35, 2023.
- [Roy, 2021] Sourabh Singha Roy. Prediction of foreign di- rect investment: An application of long short-term mem- ory. Psychology And Education, 58(2):4001-4015, 2021.
- [Shi et al., 2012] Hongyan Shi, Xin Zhang, Xiaoming Su, and Zhongju Chen. Trend prediction of FDI based on the intervention model and ARIMA-GARCH-M model. AASRI Procedia, 3:387-393, 2012.
- [Singh, 2023] Devesh Singh. Comparison between artificial neural network and linear model prediction performance for FDI disparity and the growth rate of companies in hun- garian counties. International Journal of Business Infor- mation Systems, 43(4):542-552, 2023.
- [Slinker and Glantz, 1990] Bryan K Slinker and Stan- ton Arnold Glantz. Primer of applied regression and analysis of variance. McGraw-Hill, 1990.
- [Somepalli et al., 2021] Gowthami Somepalli, Micah Gold- blum, Avi Schwarzschild, C Bayan Bruss, and Tom Gold- stein. Saint: Improved neural networks for tabular data via row attention and contrastive pre-training. arXiv preprint arXiv:2106.01342, 2021.
- [Somvanshi et al., 2024] Shriyank Somvanshi, Subasish Das, Syed Aaqib Javed, Gian Antariksa, and Ahmed Hossain. A survey on deep tabular learning. arXiv preprint arXiv:2410.12034, 2024.
- [Song et al., 2019] Weiping Song, Chence Shi, Zhiping Xiao, Zhijian Duan, Yewen Xu, Ming Zhang, and Jian Tang. Autoint: Automatic feature interaction learning via self-attentive neural networks. In Proc. of CIKM, page 1161-1170, 2019.
- [Turolla and Margarido, 2011] Frederico Ara ÃTurolla and M ário Ant ônio Margarido. Modeling and forecasting foreign direct investment into Brazil with ARIMA. Econo- mia Global e Gest Ã, 16:83 -100, 09 2011.
- [Tyler, 1987] T. Tyler. Procedural justice research. Social Justice Research, 1:41-65, 1987.
- [United Nations, 2015] United Nations. Transforming our world: The 2030 agenda for sustainable development. Technical report, United Nations, 2015.
- [Vaswani et al., 2017] Ashish Vaswani, Noam Shazeer, Niki Parmar, Jakob Uszkoreit, Llion Jones, Aidan N. Gomez, Łukasz Kaiser, and Illia Polosukhin. Attention is all you need. In Proc. of NeurIPS, page 6000-6010, 2017.
- [Voigt, 2016] Stefan Voigt. Determinants of judicial effi- ciency: a survey. European Journal of Law and Eco- nomics, 42:183-208, 2016.
- [Vujanović et al., 2021] Nina Vujanović, Bruno Casella, and Richard Bolwijn. Unctad insights: Forecasting global FDI: A panel data approach. Transnational Corporations, 28(1):97-125, 2021.
- [Wang et al., 2023] Hongjun Wang, Jiyuan Chen, Zipei Fan, Zhiwen Zhang, Zekun Cai, and Xuan Song. ST- ExpertNet: A Deep Expert Framework for Traffic Predic- tion . IEEE Transactions on Knowledge & Data Engineer- ing, 35(07):7512-7525, 2023.
- [World Bank, 2024] World Bank. Global economic prospects, june 2024. Technical report, World Bank Group, 2024.
- [Ye et al., 2024] Han-Jia Ye, Si-Yang Liu, Hao-Run Cai, Qi- Le Zhou, and De-Chuan Zhan. A closer look at deep learning on tabular data. arXiv preprint arXiv:2407.00956, 2024.
- [Zain Al-Thalabi et al., 2022] Sahera Hussein Zain Al- Thalabi, Ali Akbar Heydari, and Masoud Tavakoli. Modeling and prediction using an artificial neural network to study the impact of foreign direct investment on the growth rate/a case study of the state of qatar. Journal of Statistics and Management Systems, 25(8):1991-2003, 2022.
References were extracted automatically from the PDF and may contain errors.
Full text extracted automatically from the PDF; figures, tables and equations may differ. The PDF is the version of record.
1 Introduction
One of the key objectives of the Sustainable Development Goals [Kilanioti and A. Papadopoulos, 2023] of the United Nations is to "promote sustained, inclusive, and sustainable economic growth" [United Nations, 2015]. However, realizing this objective has become increasingly challenging, especially considering that the past ten years have been marked by a series of global economic recessions, because of heightened geopolitical tensions, regional conflicts, and unforeseen public health crises. According to the estimation of the World Bank, the Ukrainian economy shrinks by 45.1%, the Russian economy shrinks by 11.2%, and the economies of emerging markets and developing countries in the Eurasian region contract by 4.1% [Demirguc-Kunt, 2022]. It is also expected that from 2024 to 2025, the growth rate of nearly 60% of the world's economies (accounting for more than 80% of the global population) will be below the average level of the 2010s [World Bank, 2024]. Amidst the worsening global economic climate, foreign direct investment (FDI), with the positive impact on economic growth, industrial upgrading, and the innovation of cutting-edge technologies, has emerged as a crucial tool to combat local economic recessions.
∗Corresponding authors.
As the world's second largest economy, China has introduced a range of policies and laws to attract FDI in recent years. A significant milestone is the promulgation and enforcement of the Foreign Investment Law of the People's Republic of China on January 1, 2020, which explicitly states the goal to "further expand the opening-up policy, actively promote foreign investment, and protect the legitimate rights and interests of foreign investors" 1 . Additionally, the State Council of the People's Republic of China issued the Opinions on Further Optimizing the Foreign Investment Environment and Increasing the Attraction of Foreign Investment 2 on August 13, 2023, further emphasizing the need to create a world-class business environment that is internationalized, law-governed, and market-oriented.
Despite the increasing significance of FDI in China's economic strategy, decision-making regarding city-level FDI is fraught with uncertainties. With a lack of capability to predict city-level FDI, it is simply impractical for local governments to make effective and efficient decisions that maximize the benefits and minimize the risks associated with incoming FDI. Economists and computer scientists have conducted extensive studies [Akbari et al., 2021; Rapoo et al., 2023; Huang et al., 2021; Zain Al-Thalabi et al., 2022; Bruneckiene et al., 2019; Singh, 2023; Vujanovi´c et al., 2021] to improve the prediction accuracy and uncover the determinants of FDI. These studies rely heavily on economic data (e.g., GDP) from official statistics, which could be prone to manipulation by statistical agencies [Briviba et al., 2024]. This will cause inaccurate city-level FDI prediction, potentially misleading policymakers for local governments.
1 https://www.gov.cn/xinwen/2019-03/20/content 5375360.htm
2 https://www.gov.cn/zhengce/zhengceku/202308/content 6898049.htm
To address this issue, we propose to leverage judicial data to predict city-level FDI. Such judicial data are over twelve million publicly available China's adjudication documents, which reflect local judicial performance through large-scale individual cases, offering a more transparent, verifiable, and reliable information source. To systematically evaluate local judicial performance, we build an index system that contains 380 indicators categorized into four types. According to this index system, we first transform adjudication documents into a structured tabular dataset. We then propose a new Tabular Learning method on Judicial Data (TLJD) to predict citylevel FDI. In TLJD, transformer layers with arithmetic attention are utilized to encode indicators as embeddings incorporating row features and column features within our built tabular dataset, and a mixture of experts (MoE) model is employed to predict city-level FDI. Considering potential scenarios in the application of city-level FDI prediction, we finally design two evaluation tasks (i.e., estimating missing historical FDI data for specific cities and forecasting future FDI for each city) in the experiments, and the results show the superiority of TLJD compared with the state-of-the-art baselines in different evaluation metrics.
Contributions. The main contributions are summarized as:
- We propose to use judicial data to predict city-level FDI, which is the first work trying to mine adjudication documents for FDI prediction and provides a reliable and practical alternative to traditional economic data based predictions, which may be inaccurate due to data manipulation.
- We build an index system containing 380 indicators of four types for judicial performance evaluation. By calculating the indicator values of each city in a specific year, we build a tabular judicial dataset for city-level FDI prediction.
- We present a new tabular learning method TLJD for citylevel FDI prediction. It emphasizes both the feature similarities and sample similarities by fusing the column features and row features in encoding indicators, and fully considers the regional variations on how judicial performance influences FDI by employing an MoE model to dynamically generate weights of indicators.
- We conduct comprehensive experiments on both designed evaluation tasks to validate the effectiveness of our method TLJD. Experimental results not only demonstrate that TLJD outperforms the state-of-the-art baselines in most situations, but also reflect the practicality of using judicial data for city-level FDI prediction.
2 RelatedWork
2.1 FDI Prediction
FDI prediction is to predict the unknown FDI value of a region over a given period, and it is a long-standing research topic due to its significance in economic policymaking [Huang et al., 2021]. Previous works apply traditional statistical models [Turolla and Margarido, 2011; Shi et al., 2012] to predict FDI, but the accuracy is always unsatisfied since the real data distributions do not satisfy model assumptions. Recently, many works have employed machine learning techniques to develop more effective FDI prediction methods [Rapoo et al., 2023; Huang et al., 2021; Chentouf et al., 2024; Roy, 2021; Zain Al-Thalabi et al., 2022; Bruneckiene et al., 2019; Singh, 2023]. For example, an adaptive Lasso grey model [Huang et al., 2021] is proposed to eliminate less important features and alleviate overfitting in FDI prediction. A neural network [Zain Al-Thalabi et al., 2022] is used to model complex relationships among economic features and predict the FDI of Qatar. To capture longterm dependencies in FDI data, a long short-term memory network [Chentouf et al., 2024] is applied in the FDI prediction for Morocco based on various types of data.
All of the existing studies on FDI prediction rely on economic data, which could be prone to manipulation by statistical agencies [Briviba et al., 2024], making the prediction results less reliable. Additionally, the majority of these studies focus on country-level FDI, which cannot effectively help local governments in decision making on economic development. In this paper, we aim to use judicial data extracted from objective large-scale individual cases to predict citylevel FDI, providing a reliable and practical technical path of FDI prediction.
2.2 Tabular Learning
Tabular learning [Ye et al., 2024] refers to learning on the tabular data organized in a structured table format to solve regression or classification tasks. The judicial data we used in this paper is transformed to a tabular dataset, on which we learn our TLJD for city-level FDI prediction, and TLJD is technically treated as a tabular learning task. This is why tabular learning is relevant to our work. Traditional machine learning methods such as random forest [Breiman, 2001] and GBDTs [Friedman, 2001] are widely used in tabular learning, as they are quick to train while maintaining competitive performance [Somvanshi et al., 2024]. Recently, deep tabular learning models [Somvanshi et al., 2024] are proposed due to their ability of capturing high-order feature interactions. For example, AutoInt [Song et al., 2019] proposes a multihead self-attentive neural network with residual connections to explicitly model the feature interactions for tabular learning. SAINT [Somepalli et al., 2021] is a specialized tabular learning architecture which projects all categorical and continuous features into a vector space, and applies a hybrid attention mechanism to boost learning performance. FTTransformer [Gorishniy et al., 2021] adopts a stack of transformer layers to feature embedding learning for prediction tasks. AMFormer [Cheng et al., 2024] designs a modified transformer architecture enabling arithmetical feature interactions in the tabular learning process. However, such methods cannot be well applied in the scenario of city-level FDI prediction since they do not effectively model the indicators of judicial performance in the tabular dataset, which can be solved by our method TLJD.

Procedural Justice (PJ): Rate of first-instance jury trial, rate of cases heard by a single judge, … Distributive Justice (DJ): Rate of withdrawal, rate of mediation, rate of appeal, rate of prosecutorial objection, … Judicial Efficiency (JE): Number of cases closed per judge, average trial duration, ... Judicial Characteristics (JC): Rate of party appearance or defense, average number of evidence, ...Figure 1: The examples of (a) adjudication documents and (b) judicial performance indicators.
3 Preliminaries
3.1 Data Preparation
This study utilizes China's judicial data and FDI data, covering the period from 2016 to 2019. The FDI data record annual foreign direct investments (FDIs) of all cities in China. Such data are extracted from China City Statistical Yearbooks, which are sourced from China Economic and Social Big Data Research Platform 3 . The judicial data refer to over twelve millions of unstructured adjudication documents, sourced from China Judgments Online database 4 .
In order to measure the judicial performance corresponding to each city, and further help predict city-level FDI, we design a comprehensive index system based on the given adjudication documents, guided by legal domain knowledge. This system comprises 380 indicators which are classified into four types: 1) procedural justice (PJ), reflecting the fairness of decision processes in adjudication [Tyler, 1987]; 2) distributive justice (DJ), indicating the fairness of decision outcome [Konovsky, 2000]; 3) judicial efficiency (JE), measuring the efficiency of judicial decisions [Voigt, 2016]; 4) judicial characteristics (JC), capturing other features of judicial performance. Figure 1(b) exhibits several examples of these four types indicators.
To obtain the above designed judicial performance indicators, we extract and compute key information such as court location, case types, filing dates, and judgment dates from adjudication documents (illustrated in Figure 1(a)). Then, according to the judgment dates and court locations, the caselevel data are grouped into city-level data associated with each city in each year, so that a tabular dataset is built. In this dataset, each row contains two indexes which are a city and a specific year respectively, and the values of 380 judicial performance indicators.
3 https://data.oversea.cnki.net/
4 https://wenshu.court.gov.cn/
3.2 ProblemDefinition
In this paper, city-level FDI prediction aims to predict the unknown FDI value of a given city in a specific year with its judicial performance indicators. We denote the judicial performance data as X = {x1, x2, . . . , xN}, where N means the number of all samples, xi ∈ RK is the i-th sample denoting specific judicial performance indicators of a city in some year (e.g., ⟨Shanghai, 2019⟩), and K = 380 denotes the number of indicators. The FDI data is denoted as Y = {y1, y2, . . . , yN}, where yi denotes the FDI of xi. X and Y compose the training data, which are utilized to learn a function F(X; Y ; θ) with all trainable parameters θ. When given a new sample with its judicial performance indicators, we use F to compute the corresponding FDI.
4 Methodology
In this section, we introduce our method TLJD for city-level FDI prediction in detail. As shown in Figure 2, TLJD consists of two main parts: 1) Indicator Feature Encoding which encodes values of judicial performance indicators as embeddings by transformer layers with arithmetic attention while simultaneously considering both row features and column features; 2) City-Level FDI Prediction which leverages an MoE model consisting of four expert models (i.e., PJ Expert, DJ Expert, JE Expert, and JC Expert) to predict city-level FDIs.
4.1 Indicator Feature Encoding
All judicial performance indicators in the built tabular dataset are numerical values, and TLJD transforms them into embeddings to capture complex relationships between such numerical features for downstream tasks, which is widely used in tabular learning [Somvanshi et al., 2024; Ye et al., 2024]. More specifically, given the judicial performance data X, we first design a row encoder to encode each row of indicators as a matrix describing each sample xi. We then propose a column encoder to map all columns of X to another vector space so that the global similarities between indicators can be computed. We finally fuse the output of these two encoders and apply transformer layers with arithmetic attention to incorporate the contextual information of relevant indicators for each indicator embedding.
The row encoder uses K different linear functions to encode K indicators of each sample, respectively. For the j-th indicator xi,j of the sample xi, its encoded vector is denoted as ϕrj (xi,j), where ϕrj (xi,j) = wjxi,j + bj is the j-th linear function that maps the scaler value into a d-dimensional vector, wj is a weight vector, and bj is a bias vector.
For the indicators in the j-th column, we apply min-max scaling to normalize them to [0, 1], and denote the scaled indicators as vj ∈ RN . The column encoder applies two multilayer perceptrons to encode vj as follows:
where MLP1(·) is a function that a two-layer fully-connected multi-layer perceptron (MLP) maps vj to a d-dimensional vector, and MLP2(·) is a function that the other two-layer fully-connected MLP transforms vj into a scalar value to control the scale of the vector output byMLP1(·).
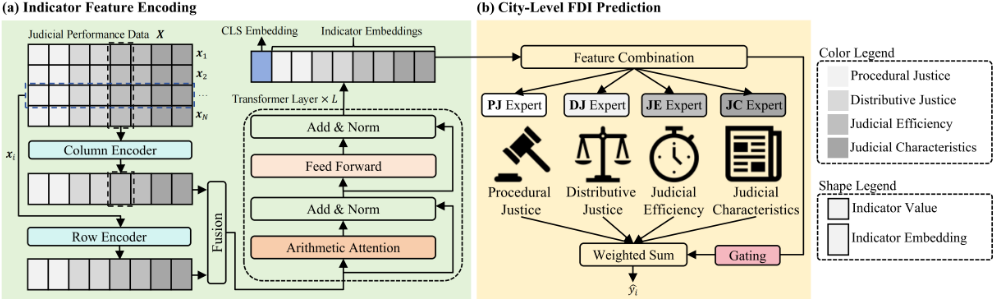
By fusing the output of the row encoder and column encoder, the vector representation of the j-th indicator of xi is computed as hi,j = ϕrj (xi,j) ⊙ ϕc (vj), where ⊙ denotes element-wise product. Then, a random initialized input CLS embedding hcls and all hi,j of xi are concatenated horizontally in a matrix as Hi = [hcls , hi,1, hi,2, . . . , hi,K]⊤where ⊤ denotes matrix transpose. Here, hcls is taken as trainable parameters and used for all samples. The setting of CLS embedding is to aggregate all indicator features of each sample.
With the output of the Fusion module Hi ∈ R(K+1)×d , we use transformer layers with arithmetic attention [Cheng et al., 2024] to aggregate contextual information for each indicator embedding. In each transformer layer, the arithmetic attention contains additive and multiplicative attention operators, which are implemented based on the standard multi-head self-attention [Vaswani et al., 2017] as follows:
where W O ∈ Rd×d is a weight parameter, M is the number of attention heads, headm ∈ Rd×d′ denotes the m-th attention head, d′ = dM , W Q m , W K m , W Vm ∈ Rd×d′ are trainable parameters for headm, and Softmax(·) is an activation function converting a vector into a probability distribution with the same dimension.
Based on this, the additive attention operator is defined as:
while the multiplicative attention operator is defined as:
where exp(·) is the exponential function, log(·) is the logarithmic function, Relu(·) = max(0, ·) is an activation function, and ϵ is an all-one vector making each element of the input for log(·) greater than zero. With both attention operators, the whole process of the arithmetic attention can be represented as:
where FC(·) is a function that a fully connected layer transforms the d × 2(K + 1) matrix into a d × (K + 1) matrix.
The transformer layer we used follows the structure in [Vaswani et al., 2017] with two sub-layers. The first one is the attention layer (we use the arithmetic attention in this paper) which outputs Att(Hi), and the second is a fullyconnected feed-forward network. We employ residual connection for both sub-layers, followed by layer normalization. In this way, we define the output of the first transformer layer as H(1) i , and the corresponding input isHi denoted asH(0) i , so the output H(l) i of the l-th transformer layer can be computed as follows:
where TransLayer(l) (·) is a function representing all operations of the l-th transformer layer. Suppose we have L transformer layers in total, the final encoded embeddings of xi are denoted as Ei = H(L) i composed of a CLS embedding and the embeddings of all indicators.
4.2 City-Level FDI Prediction
We apply an MoE model consisting of four expert models that focus on distinct aspects of judicial performance to predict city-level FDI. Given the output embeddings Ei of transformer layers, we first split them into four matrices, each of which is fed to the corresponding expert model to predict citylevel FDI. We then use a gating network to dynamically compute the weights of expert models. Finally, the weighted sum of the output of all expert models is taken as the final result of city-level FDI prediction.
As mentioned in section 3.1, all judicial performance indicators are classified into four types, and the type set is represent as T = {PJ, DJ, JE, JC}. In the module of Feature Combination, for a specific type t ∈ T , we concatenate all indicator embeddings of t and the CLS embedding from Ei to form a matrix Et i = [ecls i , eti,1 , eti,2 , · · · , eti,N t ]⊤, where N t denotes the indicator number of t, eti,j is the embedding of the j-th indicator of t, and ecls i is the CLS embedding ofEi. As a result, the obtained matrices of four types are served as the input of our MoE model.
In the MoE model, four expert models are used to predict FDI, respectively. Each expert model corresponds to a matrix of specific indicator type. Given the matrix Et i , the corresponding expert model applies a transformer layer following the same structure of the transformer layers used in Indicator Feature Encoding to aggregate contextual information for indicator embeddings and the CLS embedding within Et i . The output matrix is denoted as Et i ′ = [eclst i , et′ i,1 , et′ i,2 , · · · , et′ i,Nt ], where eclst i is the output CLS embedding, et′ i,j is the output embedding of the j-th indicator of t. eclst i not only remains the general information of the sample xi, but also emphasizes the specific judicial performance information corresponding to the type t, which helps the expert model be the "expert" with indicators of t. Each expert model computes the city-level FDI ˆ yt i as follows:
where Linear(·) = w(·) + b is a linear function, w is the weight vector, b is the bias vector, and LayerNorm(·) is a function [Lei Ba et al., 2016] to normalize the input vector into a Gaussian distribution.
In the Gating module, we propose a gating network to generate the weight of each expert model for the final city-level FDI prediction as follows:
where Gate(·) is the gating network function and it is a fully connected layer transforming the d-dimensional vector into a four-dimensional vector, which corresponds to the four types in T . Gate(·)t represents the unnormalized expert model weight of the type t, and ati is the normalized weight. The final city-level FDI prediction result of xi is computed as:
By dynamically adjusting the weights of expert models for different samples during prediction, the MoE model actually also adjust the weights of indicators which reveals their importance. Thus, we can utilize the weights of expert models for different cities to indicate the regional variations on how judicial performance influences city-level FDI.
4.3 Training
To minimize the errors between results of city-level FDI prediction and the ground truth, we use mean square error to compute the regression loss as follows:
| Year | 2016 | 2017 | 2018 | 2019 | ALL |
|---|---|---|---|---|---|
| # Document | 2.2M | 2.9M | 3.3M | 3.8M | 12.2M |
| # Samples | 265 | 265 | 267 | 263 | 1060 |
To encourage TLJD to model the judicial performance from different perspectives, we also use the expert responsibility loss [Wang et al., 2023] to optimize the prediction results of each expert model as follows:
We train TLJD by minimizing Lreg and Ler jointly by stochastic gradient descent (SGD). The joint loss is defined as:
where λ > 0 is a hyper-parameter to balance Lreg and Ler.
5 Experiment
5.1 Experiment Settings
Tasks and Datasets. City-level FDI prediction in real-world applications typically involves two application scenarios, i.e., cross-city prediction (CCP) and cross-time prediction (CTP), which are two evaluation tasks used in our experiments. CCP is to estimate missing historical FDIs for specific cities, and CTP is to predict future FDIs for the given cities.
Based on our built tabular dataset and collected FDI data, we constructed different datasets for CCP and CTP, respectively. For CCP, we built four single-year datasets which are composed of the data in each year respectively, and a mixedyear dataset which contains all data in four years. These five datasets were split into training, validation, and test sets (the division ration is 3 : 1 : 1), respectively. For CTP, we used all data to build a dataset where the data in the first three years are split into a training set and a validation set with a ratio of 3 : 1, while the data in the last year were used as the test set. Table 1 exhibits the numbers of collected adjudication documents and extracted samples for each year.
Baselines. We compared TLJD with the following advanced methods on tabular learning for city-level FDI prediction:
- Tree-based models: Random Forest [Breiman, 2001] is an ensemble model using multiple decision trees to reduce overfitting, which is widely used in FDI prediction. XGBoost [Chen and Guestrin, 2016] is a gradient boosting model which performs better than neural networks in many tabular learning tasks. LightGBM [Ke et al., 2017] is a gradient boosting model with great efficiency. CatBoost [Prokhorenkova et al., 2018] is an advanced gradient boosting model that uses oblivious decision trees and the ordered boosting algorithm.
- Classic neural network models: MLP is a traditional neural network model always used for capturing nonlinear
| CCP (2016) | CCP (2017) | CCP (2018) | CCP (2019) | |||||||||
|---|---|---|---|---|---|---|---|---|---|---|---|---|
| Model | R2 | RMSE | MAE | R2 | RMSE | MAE | R2 | RMSE | MAE | R2 | RMSE | MAE |
| XGBoost | 0.4615 | 1.8186 | 0.7932 | 0.5261 | 1.4908 | 0.7649 | 0.5305 | 1.4877 | 0.7637 | 0.5129 | 1.4630 | 0.7101 |
| LightGBM | 0.4037 | 1.8430 | 0.8515 | 0.4316 | 1.6858 | 0.8793 | 0.4152 | 1.6421 | 0.8756 | 0.5418 | 1.3946 | 0.7857 |
| CatBoost | 0.5359 | 1.7237 | 0.6942 | 0.5203 | 1.6067 | 0.6815 | 0.5508 | 1.4852 | 0.7952 | 0.5490 | 1.4613 | 0.6444 |
| RandomForest | 0.3811 | 1.8946 | 0.7652 | 0.5129 | 1.6023 | 0.6881 | 0.4943 | 1.5646 | 0.7393 | 0.5621 | 1.3608 | 0.7203 |
| MLP | 0.3821 | 1.8564 | 0.8733 | 0.3963 | 1.7446 | 0.8688 | 0.3775 | 1.7414 | 0.9397 | 0.4069 | 1.4151 | 0.9008 |
| ResNet | 0.3365 | 1.9379 | 0.8071 | 0.4322 | 1.6772 | 0.7404 | 0.4577 | 1.5858 | 0.8257 | 0.4754 | 1.5801 | 0.7744 |
| AutoInt | 0.4521 | 1.8364 | 0.7859 | 0.5136 | 1.5167 | 0.7908 | 0.4988 | 1.5582 | 0.8255 | 0.4413 | 1.5353 | 0.7349 |
| SAINT | 0.5432 | 1.6903 | 0.6834 | 0.4832 | 1.6592 | 0.7235 | 0.4944 | 1.5402 | 0.7678 | 0.6197 | 1.3143 | 0.6578 |
| FT-Transformer | 0.4981 | 1.7315 | 0.7098 | 0.5103 | 1.5580 | 0.7064 | 0.4885 | 1.5562 | 0.7124 | 0.5272 | 1.4318 | 0.6923 |
| AMFormer | 0.5354 | 1.6808 | 0.6864 | 0.4714 | 1.6233 | 0.7037 | 0.4755 | 1.5902 | 0.7257 | 0.6004 | 1.3153 | 0.5934 |
| TLJD (Ours) | 0.5471 | 1.6768 | 0.6681 | 0.5324 | 1.5077 | 0.6740 | 0.5565 | 1.4836 | 0.7083 | 0.6220 | 1.2868 | 0.6054 |
| CCP (mixed-year) | CTP | |||||
|---|---|---|---|---|---|---|
| Model | R2 | RMSE | MAE | R2 | RMSE | MAE |
| XGBoost | 0.6844 | 1.4551 | 0.6119 | 0.6259 | 1.3621 | 0.8291 |
| LightGBM | 0.7077 | 1.4003 | 0.6898 | 0.5431 | 1.5053 | 0.9163 |
| CatBoost | 0.7158 | 1.3810 | 0.5827 | 0.6466 | 1.3240 | 0.8406 |
| RandomForest | 0.6768 | 1.5304 | 0.6768 | 0.6235 | 1.3675 | 0.8906 |
| MLP | 0.6507 | 1.5309 | 0.6370 | 0.4666 | 1.6264 | 0.6307 |
| ResNet | 0.6664 | 1.4961 | 0.5634 | 0.4358 | 1.6273 | 0.5041 |
| AutoInt | 0.8655 | 0.9362 | 0.4453 | 0.9093 | 0.6704 | 0.3426 |
| SAINT | 0.7238 | 1.3612 | 0.5872 | 0.8667 | 0.8129 | 0.3346 |
| FT-Transformer | 0.8754 | 0.9011 | 0.4155 | 0.8855 | 0.7532 | 0.3574 |
| AMFormer | 0.8404 | 1.0201 | 0.4362 | 0.9177 | 0.6386 | 0.3603 |
| TLJD (Ours) | 0.9217 | 0.7872 | 0.4137 | 0.9242 | 0.5626 | 0.3032 |
relationships of features in FDI prediction. ResNet [He et al., 2016] enables training the deeper networks by skip connections, mitigating the vanishing gradient problem.
- Attention-based models: AutoInt [Song et al., 2019] is a representative attention-based model that encodes features into embeddings and utilizes the self-attention mechanism to learn high-order feature interactions. SAINT [Somepalli et al., 2021] applies a hybrid attention mechanisms to boost tabular learning performance. FT-Transformer [Gorishniy et al., 2021] is a typical transformer-based tabular learning model which incorporates feature embeddings with contextual information. AMFormer [Cheng et al., 2024] designs a modified transformer architecture for more accurate sample separation of tabular data.
Evaluation Metrics. We evaluated TLJD and baselines with the following metrics: 1) Coefficient of Determination (R2 ) is the proportion of the variation in the dependent variable that is predictable from the independent variables [Slinker and Glantz, 1990]. It measures how well prediction results approximate the ground truth FDIs, and an R2 closer to one indicates more accurate prediction results; 2) Root Mean Squared Error (RMSE) is the quadratic mean of the differences between the predicted values and the ground truth. 3) Mean Absolute Error (MAE) is the mean of absolute differences between the predicted values and the ground truth.
Implementation. We adopted Adam optimizer [Kingma and Ba, 2015] for SGD. We selected the optimal hyperparameters of TLJD on both tasks with different datasets via grid search on each validation set and chose the best TLJD based on MAE. For CCP on four single-year datasets, the optimal hyper-parameters of TLJD are as follows: the embedding size d = 96, the number of transformer layers L = 2, the loss weight λ = 0.4, the learning rate: 0.0001, the batch size: 32, the number of epochs: 100. For CCP on the mixed-year dataset and CTP, the optimal hyper-parameters of TLJD are the same as follows: the embedding size d = 96, the number of transformer layers L = 3, the loss weight λ = 0.6, the learning rate: 0.001, the batch size: 32, the number of epochs: 50. We implemented TLJD using PyTorch and all experiments were executed on an NVIDIA RTX 3090 GPU card (24 GB) of a 128 GB, 2.90 GHz Xeon server.
5.2 Result Analysis
Performance Comparison. We compared TLJD with ten baselines on all six datasets. Table 2 shows the results of CCP on four single-year datasets. TLJD outperforms baselines in most situations, because TLJD uses two encoders to embed both row features and column features, and integrate them to our proposed MoE model focusing on different perspectives of specifically designed judicial performance indicators. We can also find that tree-based models demonstrate strong competitiveness because they have effective regularization techniques to avoid overfitting. Classic neural network models perform poorly because their structures can not effectively capture feature interactions in tabular learning. In contrast, attention-based models show good performance, as they can handle complex relationships between features and aggregate contextual information in embedding learning.
Table 3 shows the comparison results of CCP on the mixedyear dataset and CTP. Compared with the ten baselines, TLJD
| CCP (mixed-year) | CTP | |||||
|---|---|---|---|---|---|---|
| Model R2 | RMSE | MAE | R2 | RMSE | MAE | |
| TLJD (Ours) w/o moe w/o ce | 0.9217 0.8590 0.8821 | 0.7872 0.9726 0.8892 | 0.4137 0.5148 | 0.9242 0.8251 | 0.5626 | 0.3032 0.4644 |
| 0.8319 | ||||||
| 0.4698 | 0.8464 | 0.8723 | 0.4367 | |||
provides the best results in all evaluation metrics on both tasks, further demonstrating the superiority of TLJD. The high accuracy achieved in CCP (0.9217 R2 ) on the mixedyear dataset and CTP (0.9242 R2 ) also highlights the effectiveness of judicial data for city-level FDI prediction. Meanwhile, attention-based models (including TLJD) significantly outperform other types of baselines, which reflects that leveraging attention mechanisms to aggregate contextual information for each indicator embedding when we have more training data is important to accurate city-level FDI prediction.
Ablation Study. To validate the contribution of key modules in TLJD, we constructed two variants of TLJD and conducted ablation experiments for CCP on the mixed year dataset and CTP, respectively. For the first variant, we replaced the MoE model with a single model utilizing a transformer layer for prediction and denoted it as w/o moe; for the other variant, we removed the column encoder and denoted this variant as w/o ce. Table 4 presents the ablation results. We found that our method outperforms both variants, which indicates that 1) the MoE model is important as it can dynamically adjust the weights of judicial performance indicators; 2) the column encoder is a key design in TLJD, as the global similarities between indicators can be captured in tabular learning.
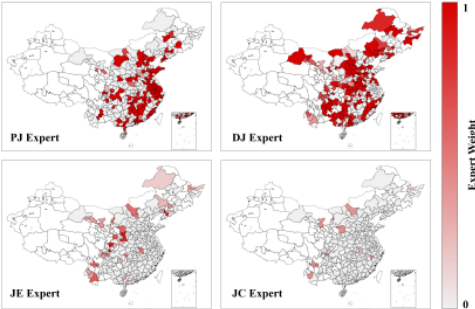
Expert Weight Analysis. To analyze the regional variations of expert (i.e., four expert models) weights and the association between the expert weights and city-level FDI, we conducted analysis on the test set (i.e., all data in 2019) of CTP. The results are shown in Figure 3 and Figure 4, where the cities represented in white indicates that their data are unavailable. Figure 3 visualizes the regional variations of expert weights, with the colors ranging from gray to red which indicate increasing expert weights. We can find that the PJ expert and DJ expert dominate the city-level FDI prediction in most cities, highlighting the significance of procedural justice indicators and distributive justice indicators which influence the decisions of foreign investors. In particular, the PJ expert exhibits larger weights in China's eastern coastal regions, whereas the DJ expert has a stronger influence in the central, western, and northeastern regions. This may be driven by differences in regional socio-economic conditions, such as disparities in economic development and local policy priorities.
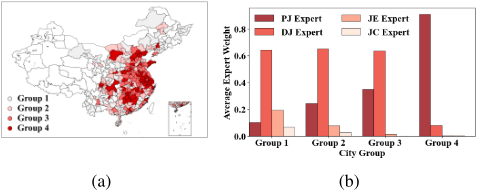
To further analyze the association between expert weights and city-level FDI, we divide all cities into four groups. We ranked all cities by FDI in descending order, then group 1 (the last 25% cities), group 2 (the top 50%∼75% cities), group 3 (the top 25%∼50% cities), and group 4 (the top 25% cities) were created. Figure 4(a) shows the distribution of cities within the four groups, and a darker color illustrates a larger FDI. The average expert weights for each group are visualized in Figure 4(b). We can see that the cities with lower FDIs (Group 1, 2, 3) have a larger average weights of the DJ expert, while the cities with higher FDIs (Group 4) have a much larger average weight of the PJ expert. These mean that in the regions with a well-established investment environment (i.e., the regions with high FDIs), procedural justice is more important and investors prioritize the fairness and transparency of judicial procedures. However, in the regions with a emerging or less-developed investment environment (i.e., the regions with low FDIs), distributive justice is more important and investors place greater emphasis on the practical outcomes of judicial decisions, which determines whether the judiciary can effectively solve the problems of investors.
6 Conclusion
In this paper, we propose to use judicial data to predict citylevel FDI with a new tabular learning method TLJD, which addresses the issue of relying on the economic data prone to manipulation, and can support economic decision making of local governments. Experimental results show the superiority of TLJD compared with different baselines, and the effectiveness of key modules in the ablation study. By providing a new technical path of city-level FDI prediction, our study has potential applications not only in China but also in other major global economies, which contributes to economic growth and the achievement of sustainable development goals.
Acknowledgements
This work is supported by the National Natural Science Foundation of China (Grant No. 62376058, 62302095), the National Social Science Fund of China (Grant No. 21CFX025), the Southeast University Interdisciplinary Research Program for Young Scholars, and the Big Data Computing Center of Southeast University.
Contribution Statement
This study was finished under the cross-disciplinary collaboration between the AI research team led by Prof. Tianxing Wu, and the law and economics research team led by Prof. Yuqing Feng. Both teams contributed equally.
@inproceedings{ijcai2025p1104,
  title     = {City-Level Foreign Direct Investment Prediction with Tabular Learning on Judicial Data},
  author    = {Wu, Tianxing and Cao, Lizhe and Wang, Shuang and Wang, Jiming and Zhu, Shutong and Wu, Yerong and Feng, Yuqing},
  booktitle = {Proceedings of the Thirty-Fourth International Joint Conference on
               Artificial Intelligence, {IJCAI-25}},
  publisher = {International Joint Conferences on Artificial Intelligence Organization},
  editor    = {James Kwok},
  pages     = {9936--9944},
  year      = {2025},
  month     = {8},
  note      = {AI and Social Good},
  doi       = {10.24963/ijcai.2025/1104},
  url       = {https://doi.org/10.24963/ijcai.2025/1104},
}
TY - CPAPER TI - City-Level Foreign Direct Investment Prediction with Tabular Learning on Judicial Data AU - Wu, Tianxing AU - Cao, Lizhe AU - Wang, Shuang AU - Wang, Jiming AU - Zhu, Shutong AU - Wu, Yerong AU - Feng, Yuqing T2 - Proceedings of the Thirty-Fourth International Joint Conference on Artificial Intelligence, IJCAI-25 PB - International Joint Conferences on Artificial Intelligence Organization PY - 2025 SP - 9936 EP - 9944 DO - 10.24963/ijcai.2025/1104 UR - https://doi.org/10.24963/ijcai.2025/1104 ER -Copied
Machine-readable versions of this paper, for tools and AI agents:





