
BGM: Demand Prediction for Expanding Bike-Sharing Systems with Dynamic Graph Modeling
Proceedings of the Thirty-Fourth International Joint Conference on Artificial Intelligence. AI and Social Good. Pages 10008-10016.
https://doi.org/10.24963/ijcai.2025/1112
Keywords
- Multidisciplinary Topics and Applications: General
- Machine Learning: General
- Data Mining: General
Abstract
Accurate demand prediction is crucial for the equitable and sustainable expansion of bike-sharing systems, which help reduce urban congestion, promote low-carbon mobility, and improve transportation access in underserved areas. However, expanding these systems presents societal challenges, particularly in ensuring fair resource distribution and operational efficiency. A major hurdle is the difficulty of demand prediction at new stations, which lack historical usage data and are heavily influenced by the existing network. Additionally, new stations dynamically reshape demand patterns across time and space, complicating efforts to balance supply and accessibility in evolving urban environments. Existing methods model relationships between new and existing stations but often assume static patterns, overlooking how new stations reshape demand dynamics over time and space. To tackle these challenges, we propose a novel demand prediction framework for expanding bike-sharing systems, namely BGM, which leverages dynamic graph modeling to capture the evolving inter-station correlations while accounting for spatial and temporal heterogeneity. Specifically, we develop a knowledge transfer approach that studies the embeddings transformation across existing and new stations through a learnable orthogonal mapping matrix. We further design a gated selecting vector-based feature fusion mechanism to integrate the transferred embeddings and the intrinsic features of stations for precise predictions. Experiments on real-world bike-sharing data demonstrate that BGM outperforms existing methods.
- [Chen et al., 2015] Longbiao Chen, Daqing Zhang, Gang Pan, Xiaojuan Ma, Dingqi Yang, Kostadin Kushlev, Wang- sheng Zhang, and Shijian Li. Bike sharing station place- ment leveraging heterogeneous urban open data. In Pro- ceedings of the 2015 ACM International Joint Conference on Pervasive and Ubiquitous Computing, pages 571-575, 2015.
- [Chen et al., 2016] Longbiao Chen, Daqing Zhang, Leye Wang, Dingqi Yang, Xiaojuan Ma, Shijian Li, Zhao- hui Wu, Gang Pan, Thi-Mai-Trang Nguyen, and Jérémie Jakubowicz. Dynamic cluster-based over-demand pre- diction in bike sharing systems. In Proceedings of the 2016 ACM International Joint Conference on Pervasive and Ubiquitous Computing, UbiComp '16, pages 841- 852, New York, NY, USA, 2016. Association for Com- puting Machinery.
- [Chen et al., 2020] Po-Chuan Chen, He-Yen Hsieh, Kuan- Wu Su, Xanno Kharis Sigalingging, Yan-Ru Chen, and Jenq-Shiou Leu. Predicting station level demand in a bike- sharing system using recurrent neural networks. IET Intel- ligent Transport Systems, 14(6):554-561, 2020.
- [Chen et al., 2021] Xu Chen, Junshan Wang, and Kunqing Xie. Trafficstream: A streaming traffic flow forecasting framework based on graph neural networks and continual learning. arXiv preprint arXiv:2106.06273, 2021. IJCAI
- [Citi-Bike, 2024] Citi-Bike. System data. https://citibikenyc. com/system-data, 2024. Accessed: 2024-12-31. Link
- [Demizu et al., 2023] Tsukasa Demizu, Yusuke Fukazawa, and Hiroshi Morita. Inventory management of new prod- ucts in retailers using model-based deep reinforcement learning. Expert Systems with Applications, 229:120256, 2023.
- [Faghih-Imani and Eluru, 2016] Ahmadreza Faghih-Imani and Naveen Eluru. Incorporating the impact of spatio- temporal interactions on bicycle sharing system demand: A case study of new york citibike system. Journal of transport geography, 54:218-227, 2016.
- [Ghosh et al., 2020] Pallabi Ghosh, Yi Yao, Larry Davis, and Ajay Divakaran. Stacked spatio-temporal graph convolu- tional networks for action segmentation. In Proceedings of the IEEE/CVF winter conference on applications of com- puter vision, pages 576-585, 2020.
- [Hamilton et al., 2017] Will Hamilton, Zhitao Ying, and Jure Leskovec. Inductive representation learning on large graphs. Advances in neural information processing sys- tems, 30, 2017.
- [Jin et al., 2023] Guangyin Jin, Yuxuan Liang, Yuchen Fang, Zezhi Shao, Jincai Huang, Junbo Zhang, and Yu Zheng. Spatio-temporal graph neural networks for predictive learning in urban computing: A survey. IEEE Transac- tions on Knowledge and Data Engineering, 2023.
- [Kapoor et al., 2020] Amol Kapoor, Xue Ben, Luyang Liu, Bryan Perozzi, Matt Barnes, Martin Blais, and Shawn O'Banion. Examining covid-19 forecasting us- ing spatio-temporal graph neural networks. arXiv preprint arXiv:2007.03113, 2020.
- [Kou and Cai, 2021] Zhaoyu Kou and Hua Cai. Incorporat- ing spatial network information to improve demand pre- diction for bike share system expansion. In Proceedings of the 10th International Workshop on Urban Computing. ACM, Beijing, 2021.
- [Lahoorpoor et al., 2019] Bahman Lahoorpoor, Hamed Faroqi, Abolghasem Sadeghi-Niaraki, and Soo-Mi Choi. Spatial cluster-based model for static rebalancing bike sharing problem. Sustainability, 11(11):3205, 2019.
- [Li and Zheng, 2020] Yexin Li and Yu Zheng. Citywide bike usage prediction in a bike-sharing system. IEEE Transac- tions on Knowledge and Data Engineering, 32(6):1079- 1091, 2020.
- [Li et al., 2019] Youru Li, Zhenfeng Zhu, Deqiang Kong, Meixiang Xu, and Yao Zhao. Learning heterogeneous spatial-temporal representation for bike-sharing demand prediction. In Proceedings of the Thirty-Third AAAI Con- ference on Artificial Intelligence and Thirty-First Innova- tive Applications of Artificial Intelligence Conference and Ninth AAAI Symposium on Educational Advances in Ar- tificial Intelligence, AAAI'19/IAAI'19/EAAI'19. AAAI Press, 2019.
- [Liang et al., 2023a] Yuebing Liang, Fangyi Ding, Guan Huang, and Zhan Zhao. Deep trip generation with graph neural networks for bike sharing system expansion. Transportation Research Part C: Emerging Technologies, 154:104241, 2023.
- [Liang et al., 2023b] Yuebing Liang, Guan Huang, and Zhan Zhao. Cross-mode knowledge adaptation for bike sharing demand prediction using domain-adversarial graph neural networks. IEEE Transactions on Intelligent Transporta- tion Systems, 2023.
- [Liang et al., 2024] Yuebing Liang, Zhan Zhao, Fangyi Ding, Yihong Tang, and Zhengbing He. Time-dependent trip generation for bike sharing planning: A multi-task memory-augmented graph neural network. Information Fusion, 106:102294, 2024.
- [Liu et al., 2015] Jingyuan Liu, Qiao Li, Meng Qu, Weiwei Chen, Jingyuan Yang, Hui Xiong, Hao Zhong, and Yan- jie Fu. Station site optimization in bike sharing systems. In 2015 IEEE International Conference on Data Mining, pages 883-888. IEEE, 2015.
- [Liu et al., 2017] Junming Liu, Leilei Sun, Qiao Li, Jingci Ming, Yanchi Liu, and Hui Xiong. Functional zone based hierarchical demand prediction for bike system expan- sion. In Proceedings of the 23rd ACM SIGKDD interna- tional conference on knowledge discovery and data min- ing, pages 957-966, 2017.
- [Ma et al., 2022] Xinwei Ma, Yurui Yin, Yuchuan Jin, Mingjia He, and Minqing Zhu. Short-term prediction of bike-sharing demand using multi-source data: a spatial- temporal graph attentional lstm approach. Applied Sci- ences, 12(3):1161, 2022.
- [Macioszek et al., 2020] Elżbieta Macioszek, Paulina Świerk, and Agata Kurek. The bike-sharing system as an element of enhancing sustainable mobility-a case study based on a city in poland. Sustainability, 12(8):3285, 2020.
- [Mahajan and Argota Sánchez-Vaquerizo, 2024] Sachit Ma- hajan and Javier Argota Sánchez-Vaquerizo. Global com- parison of urban bike-sharing accessibility across 40 cities. Scientific Reports, 14(1):20493, 2024.
- [Mohamed et al., 2020] Abduallah Mohamed, Kun Qian, Mohamed Elhoseiny, and Christian Claudel. Social- stgcnn: A social spatio-temporal graph convolutional neu- ral network for human trajectory prediction. In Proceed- ings of the IEEE/CVF conference on computer vision and pattern recognition, pages 14424-14432, 2020.
- [Roy et al., 2021] Amit Roy, Kashob Kumar Roy, Amin Ah- san Ali, M Ashraful Amin, and AKM Mahbubur Rah- man. Unified spatio-temporal modeling for traffic fore- casting using graph neural network. In 2021 International Joint Conference on Neural Networks (IJCNN), pages 1-8. IEEE, 2021.
- [Singhvi et al., 2015] Divya Singhvi, Somya Singhvi, Peter I Frazier, Shane G Henderson, Eoin O'Mahony, David B Shmoys, and Dawn B Woodard. Predicting bike usage for new york city's bike sharing system. In Workshops at the twenty-ninth AAAI conference on artificial intelli- gence, 2015.
- [Tang et al., 2021] Jinjun Tang, Jian Liang, Fang Liu, Jingjing Hao, and Yinhai Wang. Multi-community pas- senger demand prediction at region level based on spatio- temporal graph convolutional network. Transportation Re- search Part C: Emerging Technologies, 124:102951, 2021.
- [Wu et al., 2020] Yuankai Wu, Dingyi Zhuang, Aurélie Labbe, and Lijun Sun. Inductive graph neural networks for spatiotemporal kriging. CoRR, abs/2006.07527, 2020.
- [Xiao et al., 2021] Guangnian Xiao, Ruinan Wang, Chunqin Zhang, and Anning Ni. Demand prediction for a public bike sharing program based on spatio-temporal graph con- volutional networks. Multimedia Tools and Applications, 80:22907-22925, 2021.
- [Yu et al., 2017] Bing Yu, Haoteng Yin, and Zhanxing Zhu. Spatio-temporal graph convolutional networks: A deep learning framework for traffic forecasting. arXiv preprint arXiv:1709.04875, 2017. IJCAI
- [Yu et al., 2023] Liang Yu, Tao Feng, Tie Li, and Lei Cheng. Demand prediction and optimal allocation of shared bikes around urban rail transit stations. Urban Rail Transit, 9(1):57-71, 2023.
- [Zhang et al., 2022] Xingchen Zhang, Panagiotis An- geloudis, and Yiannis Demiris. St crossingpose: A spatial-temporal graph convolutional network for skeleton-based pedestrian crossing intention prediction. IEEE Transactions on Intelligent Transportation Systems, 23(11):20773-20782, 2022.
- [Zheng et al., 2023] Chuanpan Zheng, Xiaoliang Fan, Shirui Pan, Haibing Jin, Zhaopeng Peng, Zonghan Wu, Cheng Wang, and S Yu Philip. Spatio-temporal joint graph con- volutional networks for traffic forecasting. IEEE Trans- actions on Knowledge and Data Engineering, 36(1):372- 385, 2023.
References were extracted automatically from the PDF and may contain errors.
Full text extracted automatically from the PDF; figures, tables and equations may differ. The PDF is the version of record.
1 Introduction
Bike-sharing systems have gained popularity worldwide, offering short-term bike rentals through networks of stations distributed across urban areas. These systems provide an eco-
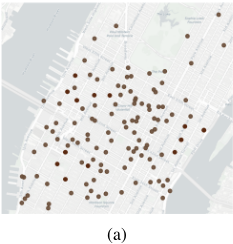
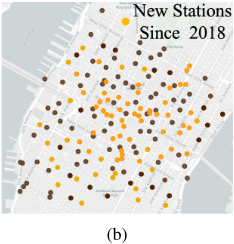
gestion, and promote sustainable urban mobility [Macioszek et al., 2020]. To amplify these benefits, providers have rapidly expanded their bike-sharing networks, as seen in Figure 1(a) and Figure 1(b), which illustrate the network expansion in New York City from January 2018 to January 2024 [Mahajan and Argota S´anchez-Vaquerizo, 2024]. While network expansion amplifies the environmental and societal benefits of bike-sharing systems, it also introduces critical societal challenges. One pressing issue is ensuring equitable access to mobility across socioeconomically diverse neighborhoods, as underserved areas often face limited access to transportation infrastructure. Another challenge lies in resource allocation-determining where and when to deploy bikes and docking stations to balance supply and demand effectively. Addressing these challenges requires accurate demand prediction, particularly for new stations, to optimize operations and support the sustainable and inclusive expansion of bikesharing systems, particularly in the absence of historical data for new stations. Moreover, new stations will also change usage patterns across the network, creating complex spatiotemporal dependencies. Therefore, it is crucial to model the dynamic relationships between new and existing stations to ensure equitable access and efficient resource allocation.
∗Corresponding author.
Various methods have been developed to address these challenges. Traditional regression-based models leverage historical data to identify demand patterns, providing a foundational understanding of user behavior [Chen et al., 2015; Liu et al., 2015]. Functional zone-based approaches improve this by incorporating diverse urban characteristics, such as population density and land use, allowing for localized and precise analyses of demand [Liu et al., 2017]. Machine learning models, such as random forests and support vector machines, further enhance prediction accuracy by integrating multiple external factors, including temporal features and points of interest [Kou and Cai, 2021]. Recently, advanced graph neural networks have been employed to capture complex spatial dependencies and mitigate data scarcity, enabling more robust and reliable predictions for new station deployment [Chen et al., 2020]. However, these methods assume the relationships between new and existing stations are static, failing to capture how demand shifts with expansion. This can lead to inefficient station deployment and inequitable service distribution, particularly in underserved areas. Addressing these challenges requires advanced models that adapt to evolving demand patterns, supporting more inclusive and data-driven urban mobility planning.
To tackle these challenges, we design a novel and unified Demand Prediction Framework in Bike-Sharing Systems Expansion with Dynamic Graph Modeling (BGM), which dynamically adapts to the evolving network structure and diverse contextual factors. Specifically, BGM leverages a dynamic graph architecture that continuously updates its structure and node attributes to reflect the evolving relationships between stations, such as spatial proximity, functional similarity, and temporal demand patterns. This dynamic modeling enables the framework to capture the shifting demand patterns. Building upon this, it incorporates two key modules: i) a knowledge transfer approach that studies the transformation of embeddings across existing and new stations through a learnable orthogonal mapping matrix, ensuring the adaptation and alignment of spatio-temporal patterns to dynamic conditions; and ii) a gated selecting vector-based feature fusion mechanism that selectively combines the transferred embeddings with the intrinsic features of stations, generating enriched and context-aware embeddings for precise predictions. The contributions of our work are summarized as follows:
- We present a unified dynamic graph framework that updates its structure and node attributes to capture the evolving spatial and temporal relationships in bikesharing networks.
- We propose a novel knowledge transfer approach that studies the embeddings transformation across existing and new stations by a learnable orthogonal mapping matrix to address data sparsity in newly added stations.
- We design a gated selecting vector-based feature fusion mechanism to seamlessly integrate transferred embeddings from existing stations with the intrinsic features of stations. This mechanism minimizes negative transfer while dynamically balancing contributions from both sources to ensure precise predictions.
- Extensive experiments demonstrate that our model outperforms other state-of-the-art methods on real-world public datasets (NYC's Citi-Bike), showcasing superior prediction accuracy and robustness for new station demand predictions.
2 Preliminaries
Expanding Bike-Sharing System. An Expanding bikesharing system consists of a set of stations V , including existing stations VA with historical data and new stations VB without historical data. A station v ∈ V is associated with a feature vector xv encoding its spatio-temporal and contextual attributes (location, Points of Interest, rental records) and external factors.
Bike Demand. Bike demand refers to the number of rentals at a station within a given time interval and is influenced by spatial and temporal factors. To model these variations, we represent bike-sharing systems as a dynamic graph, stations are represented as nodes vi ∈ V and time steps are t. The demand at station vi at time t is denoted as dti . The graph Gt = (Vt,Et,Wt) evolves, where edges (i, j) ∈ Et capture demand dependencies with weights wt ij reflecting spatial, proximity, and temporal correlations.
Problem Formulation. Given an expanding bike-sharing system with existing stations VA that have historical data and newly deployed stations VB, the problem of demand prediction is to accurately estimate the hourly demand for all stations in the bike-sharing network.
3 Methodology
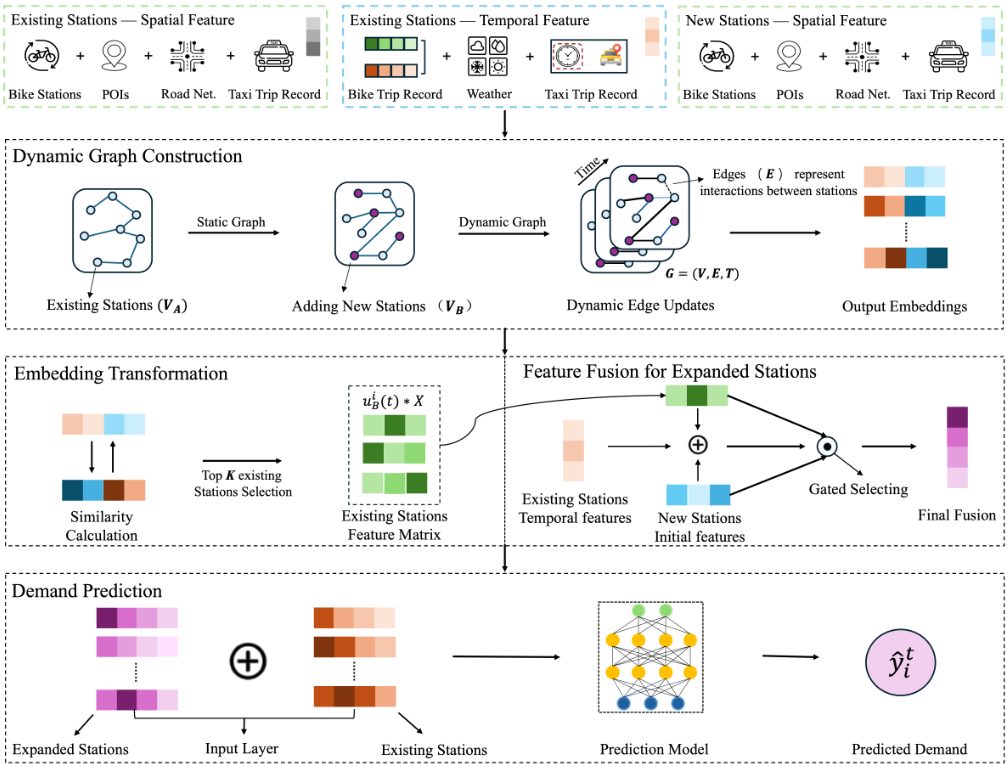
To predict the bike demand in expanding networks, we propose a framework that combines spatio-temporal feature encoding, dynamic graph construction, embedding transformation, and feature fusion. Illustrated in Figure 2. The following subsections provide detailed explanations of each component.
3.1 Spatio-Temporal Feature Encoding
To effectively represent the spatio-temporal characteristics of bike-sharing systems, we encode spatio-temporal features of stations as the inputs for the graph-based learning framework. Spatial features Xt,spatial i include Points of Interest (POI) distributions, distance metrics, and road network connectivity, as depicted in the spatial feature extraction module in Figure 2. Edges between nodes capture interdependent relationships such as spatial proximity or functional similarity and are represented by an adjacency matrix At , which varies temporally over time to reflect dynamic changes. POIs within a fixed radius (e.g., 500 meters) are categorized and normalized into a weighted vector representing the station's functional environment. Distance metrics, modeled using a Gaussian decay function, emphasize closer station interactions, while road network connectivity is captured as binary indicators for links to key infrastructure.
Temporal features Xt,temporal i include normalized historical demand, weather attributes, and periodic time encodings. Hourly demand data is normalized across stations to ensure consistency, while weather features, such as temperature and precipitation, are processed similarly. The final feature vector for each station at time t is defined as:
where Taxiti denotes external mobility data, such as taxi trip records, associated with the station at time t.
This encoding process represents each station as a node embedding that encapsulates its spatial context, temporal variations, and external mobility influences, providing a robust foundation for downstream graph-based learning tasks.
3.2 Dynamic Graph Construction
Dynamic graph modeling captures evolving relationships between bike-sharing stations by dynamically updating nodes and edges over time, as represented in the dynamic graph construction layer of Figure 2. Unlike static graphs, dynamic graphs adapt to real-time changes in demand patterns and external factors, ensuring relationships remain relevant. Nodes and edges, as introduced in Section 2, form the foundation of this model. Each node represents a station, with features hti derived from Xt i as defined in Equation (1). Each edge weight atij is computed as:
where Sij is the cosine similarity of POI vectors, Dij is spatial proximity based on a Gaussian decay function, and T t ij is temporal demand similarity. Parameters α, β, and γ balance these factors. Here, i and j denote the indices of stations, and atij captures the relationship between station i and j.
At each time step, At is updated to reflect changes in demand or external factors. For example, connections between residential and business district stations strengthen during peak hours due to increased commuter trips. External factors, such as weather, further influence edge weights, dynamically adjusting relationships in real time.
New stations are integrated into the graph by initializing spatial features based on POI distributions, as shown in Figure 2. Edges for new stations are created based on functional similarity and spatial proximity:
where atinew represents the connection strength between an existing station i and a new station. Node embeddings hti are updated using a graph convolutional network (GCN):
where N(i) is the set of neighbors (including i itself), atij is the edge weight, W is a learnable weight matrix, and σ is a non-linear activation function such as ReLU. This ensures that node embeddings dynamically evolve to reflect both static and dynamic relationships.
3.3 Embedding Transformation
As illustrated in Figure 2, the knowledge transfer process leverages a learnable orthogonal mapping matrix to transform embeddings from existing stations (VA) to new stations (VB), facilitating the transfer of spatial and temporal knowledge across the stations. The process begins with identifying similarities between new and existing stations. For each time step t, the similarity between a new station i ∈ VB and an existing station j ∈ VA is measured using cosine similarity:
where hspatial i and hspatial j are spatial embeddings derived from POI distributions, road network connectivity, and taxi trip data. Cosine similarity is employed to capture proportional relationships in embedding spaces and adapt to dynamic temporal changes effectively.
Based on St ij , the top 3 existing stations with the highest similarity are selected for each time step t. Their embeddings are aggregated as follows:
To transfer and align the aggregated embeddings to the new stations, a learnable orthogonal mapping matrix X is applied:
where X is optimized under the orthogonality constraint X⊤X = I. This ensures the transferred embeddings preserve structural integrity and contextual info from existing stations while adapting to the unique characteristics of new stations.
The knowledge transfer approach leverages transformed embedding to capture shared patterns of new stations in the context of the existing network. By dynamically identifying and aligning spatio-temporal demand similarities, this transformation mechanism effectively mitigates the challenges posed by data sparsity and evolving station relationships.
3.4 Feature Fusion for Expanded Stations
As illustrated in Figure 2, the feature fusion mechanism integrates transferred embeddings, existing features, and temporal dependencies to generate representations for new stations. This process dynamically balances contributions from different feature sources, ensuring the final representation adapts to both spatial and temporal heterogeneity.
The fused feature f t i dynamically balances transferred embeddings (uiB (t)) and original features (hiB ) through a gating mechanism. It is computed as:
where gt i ∈ Rd is the gating vector at time t, ⊙ denotes element-wise multiplication, and hiB includes spatial features such as POIs, road networks, and taxi trip records.
The gating vector gt i adjusts the balance between transferred embeddings and original features based on their joint features. It is computed as:
where [hiB ; uiB (t)] represents the concatenation of the two feature vectors, Wg is a learnable weight matrix, bg is a bias term, and σ is the sigmoid activation function.
A temporal attention mechanism dynamically assigns varying weights to features from different time steps to effectively capture temporal dependencies:
where qt and kt are the query and key vectors derived from temporal embeddings, and T denotes the set of time steps.
The final fused feature integrates spatial, temporal, and dynamic relationships, ensuring robustness in predicting demand at stations. The fused feature f t i serves as the input to the demand prediction module, combining transferred knowledge (uiB (t)) and station-specific features (hiB ). This representation effectively addresses data sparsity while preserving station-specific characteristics.
3.5 Loss Function
The total loss function consists of spatial alignment loss Ls, temporal alignment loss Lt, and prediction loss Lp.
The spatial alignment loss Ls aligns embeddings with similar demand patterns using a contrastive approach:
where zt i is the node embedding of station i, hk is a prototype vector, and τ is a temperature parameter.
The temporal alignment loss Lt ensures consistency across consecutive time steps:
where σ is the sigmoid function.
The prediction loss Lp minimizes the mean squared error (MSE) between predicted and actual demand:
where yt i is the actual demand and ˆ yt i is the predicted demand.
| POI type | Number | POI type | Number |
|---|---|---|---|
| Establishment | 75,258 | Car service | 1,164 |
| Education | 2,978 | Supermarket | 4,362 |
| Shopping mall | 220 | Entertainment | 1,065 |
| Store | 30,407 | Bus station | 2,120 |
| Lodging | 1,350 | Railway station | 1,222 |
| Home service | 1,247 | Finance | 8,670 |
| Convenience | 10,608 | Estate agency | 6,092 |
| Health center | 45,914 | Restaurant | 12,642 |
| Night life | 4,404 | Travel agency | 1,707 |
| Fitness | 1,452 | ... | ... |
4 Experiments
In this section, we present the implementation details and dataset descriptions, followed by the evaluation metrics and baseline methods used for comparison. We then conduct extensive experiments to assess the performance of BGM, including comparisons with baseline models, ablation studies, and robustness analysis under different expansion scenarios.
4.1 Implementation Details
Training. The training process involves three steps: (i) computing embeddings using the dynamic graph, (ii) refining embeddings with spatial and temporal alignment losses, and (iii) predicting demand using a multi-layer perceptron (MLP). The spatial alignment loss (Ls) encourages stations with similar demand to share representations, while the temporal alignment loss (Lt) ensures consistency across consecutive time steps. The refined embeddings are then fed into an MLP for demand prediction at t + 1, represented as ˆxt+1,n = MLP(hn), where hn is the station embedding. The overall training objective is given by Ljoint = Lp + Ls + Lt. The model is trained using the Adam optimizer, with a batch size of 64, the learning rate of 1 × 10⁻³ , and 200 epochs with early stopping, running on an NVIDIA RTX 4090 GPU. The model implementation is available at: https://github.com/ YixuanColt/BSS-BGM.git.
4.2 Data Description
To evaluate our model, we collected five datasets 1 , integrating bike-sharing operational data with meteorology, POI, road network, and NYC taxi trip records. While these sources collectively provide essential input features for model training, our performance evaluation primarily focuses on bikesharing operational data from NYC Citi-Bike and Chicago Divvy-Bike, as presented in Table 2.
Bike-Sharing Data. The dataset includes operational records from the NYC Citi-Bike sharing systems over one month (January 1 to 31, 2018). The NYC Citi-Bike data consists of two primary components: i) trip records for rentals and returns at each station, and ii) station-level details, e.g., spatial and temporal information.
Meteorology Data. The meteorological data was collected from the NYC Mesowest database, providing historical daily weather records. Each record describes the weather conditions, categorized into four main types: sunny, overcast, rainy/snowy, and extreme weather conditions.
1 https://opendata.cityofnewyork.us/
POI & Road Network Data. The POI data were collected from online mapping service providers in NYC (Google Place API). Table 1 shows the details. Besides, road network data was collected from NYC Open Data for further analysis.
NYC-Taxi. The dataset contains detailed trip records of yellow taxis in New York City. Each trip record includes the pick-up and drop-off times and the corresponding latitude and longitude of these locations.
4.3 EvaluationMetrics and ComparedMethods
Evaluation metrics. There are two performance metrics employed for evaluating our model, the Root Mean Square Error (RMSE) and Mean Absolute Error (MAE). These metrics collectively provide a robust framework to assess our model's capability to capture subtle variations in the data.
Compared methods. We select seven methods for comparison in this study. These methods are described as follows:
- Linear Regression (LR) [Singhvi et al., 2015]: Predicts bike demand using taxi, weather, and spatial features with neighborhood-level aggregation.
- Spatial Regression (SR) [Faghih-Imani and Eluru, 2016]: Models spatial lag and error structures to capture spatio-temporal dependencies in demand.
- Function Zone (FZ) [Liu et al., 2017]: Clusters stations into functional zones and predicts zone-level transitions using Random Forest and ridge regression.
- GraphSAGE (SAGE) [Hamilton et al., 2017]: Aggregates neighborhood features inductively, enabling generalization to unseen stations.
- IGNNK (N2K) [Wu et al., 2020]: Learns spatial message passing via subgraph reconstruction to interpolate unsampled nodes and generalize across dynamic graphs.
- TrafficStream (TS) [Chen et al., 2021]: Integrates continual learning with spatio-temporal graph networks for adaptive model updating over dynamic traffic data.
- Spatial-MGAT (MGAT) [Liang et al., 2023a]: Captures spatial dependencies through multi-graph attention on proximity and built environment similarity.
4.4 Comparison with Baselines
The comparative analysis of demand prediction models for bike-sharing system expansion, using data from NYC CitiBike and Chicago Divvy-Bike, highlights the superior performance of advanced spatio-temporal models over traditional baselines. As shown in Table 2, traditional models like linear regression and spatial regression exhibit higher RMSE and MAE values at both existing and new stations, indicating limitations in capturing complex and dynamic bike-sharing demand patterns. The Function Zone model performs better by clustering stations based on spatial features, reflecting the importance of functional heterogeneity in urban demand. GraphSAGE improves upon traditional methods by enabling inductive learning over unseen stations, but limited temporal modeling yields suboptimal results. IGNNK enhances prediction accuracy via subgraph reconstruction and spatial message passing, showing strong performance especially at new stations. TrafficStream integrates continual learning with spatio-temporal graph networks, offering robust results across dynamic settings but limited transferability to newly added stations. Spatial-MGAT further advances performance by capturing fine-grained spatial dependencies through multigraph attention, especially under sparse training data. Overall, while each method contributes uniquely, none achieves the consistent accuracy and adaptability demonstrated by BGM across all scenarios.
| NYC Citi-Bike | Chicago Divvy-Bike | |||||||
|---|---|---|---|---|---|---|---|---|
| Model | Existing stations | New stations | Existing stations | New stations | ||||
| RMSE (↓) | MAE (↓) | RMSE (↓) | MAE (↓) | RMSE (↓) | MAE (↓) | RMSE (↓) | MAE (↓) | |
| Linear Regression | 1.9327 | 1.1366 | 2.3631 | 1.9827 | 2.6391 | 2.1302 | 2.9233 | 2.3041 |
| Spatial Regression | 1.9331 | 1.1327 | 2.3419 | 1.9223 | 2.6201 | 2.1038 | 2.8904 | 2.2033 |
| GraphSAGE | 1.8973 | 1.1175 | 2.1708 | 1.6893 | 2.5477 | 2.1290 | 2.7532 | 2.1993 |
| IGNNK | 1.8821 | 1.1026 | 1.9427 | 1.1530 | 2.4803 | 2.0181 | 2.6273 | 2.1731 |
| Function Zone | 1.8733 | 0.9024 | 1.9135 | 1.3661 | 2.3776 | 1.9032 | 2.5375 | 2.1394 |
| TrafficStream | 1.7802 | 0.8521 | 1.8623 | 1.1783 | 2.2569 | 1.7758 | 2.4890 | 2.0842 |
| Spatial-MGAT | 1.7524 | 0.8279 | 1.8302 | 0.9902 | 2.2389 | 1.7523 | 2.4339 | 1.9832 |
| BGM (Ours) | 1.4847 | 0.7524 | 1.5138 | 0.8513 | 2.0311 | 1.6492 | 2.3106 | 1.7107 |
The proposed BGM framework demonstrates the best overall performance, achieving the lowest RMSE and MAE values across all NYC and Chicago datasets. Its ability to dynamically model evolving network structures, integrate spatio-temporal interactions, and facilitate knowledge transfer between existing and new stations makes it a robust solution for enhancing transportation accessibility, optimizing bike-sharing resource allocation, and supporting sustainable urban growth. As shown in Table 2, BGM highlights the importance of embedding transformation, feature fusion, and dynamic graph modeling in designing intelligent, fair, and scalable urban mobility systems. By improving demand prediction, BGM supports equitable infrastructure expansion and better decision making for urban planners, addressing the broader societal goal of inclusive, data-driven, and futureready transportation development.
4.5 Ablation Studies
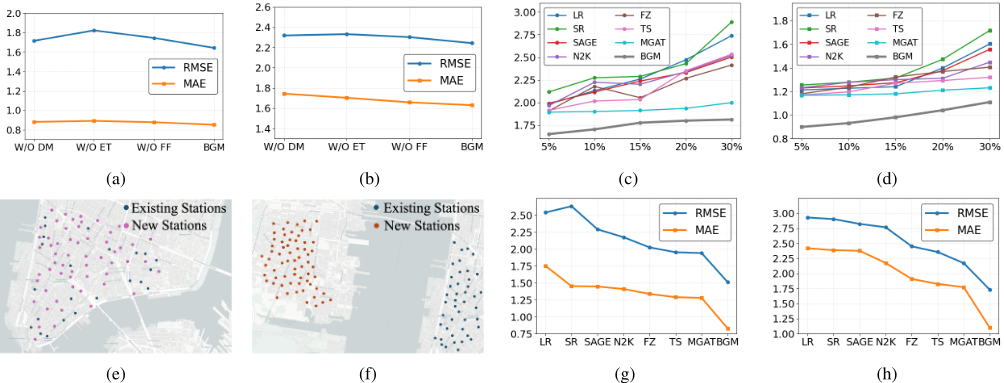
In this section, we conduct ablation studies to evaluate the contributions of key components in the BGMmodel by testing three variants: W/O DM (without dynamic graph modeling), W/O ET (without feature embedding transformation), and W/O FF (without feature fusion). By systematically removing each component, we analyze their impact on model performance. As shown in Figure 3(a) and Figure 3(b), BGM achieves the lowest RMSE and MAE values across all datasets, with a 13.8% improvement over W/O ET, confirming the critical role of embedding transformation in demand prediction. Among the variants, W/O ET exhibits the most significant performance drop, underscoring the crucial role of embedding transformation in refining feature representations and enhancing predictive accuracy. The W/O DM and W/O FF variants also show declines, highlighting the importance of dynamic graph modeling and feature fusion in capturing spatial-temporal dependencies and optimizing prediction performance. These results confirm that all three components are essential for maintaining robustness and precision.
4.6 Robustness Analysis
To evaluate the performance and robustness of the BGM model under different expansion scenarios, we designed two experiments focusing on growth rates and expansion patterns. This analysis not only evaluates how the model and baseline methods perform under different network growth speeds but also addresses a critical societal challenge: ensuring the scalability and sustainability of bike-sharing systems in the face of rapid urbanization. The first experiment investigates the impact of varying growth rates while maintaining a fixed expansion pattern. As shown in Figure 3(c) and Figure 3(d), BGM consistently outperforms all baselines across existing and new stations. For instance, BGM achieves an RMSE of 1.78 and an MAE of 0.90 at a 15% growth rate. Even at 30% growth, BGM maintains a low RMSE of 1.75 and 0.87, outperforming all baselines. These results confirm that BGM adapts effectively to varying expansion rates, ensuring stable demand predictions in dynamic urban environments.
The second experiment examines the impact of different expansion patterns, directly addressing a key societal challenge: ensuring equitable access to bike-sharing services across diverse urban areas. Two patterns are considered: localized expansion, as shown in Figure 3(e), where new stations are distributed near existing networks to enhance connectivity, and regional expansion, as shown in Figure 3(f), where new stations are introduced in disconnected areas to improve accessibility in underserved regions. Results in Figures 3(g) and 3(h) show that BGM achieves the lowest RMSE and MAE in both scenarios, demonstrating robustness. Specifically, for localized expansion, BGM records an RMSE of 1.51 and an MAE of 0.83, outperforming the second-best model. It still performs well under regional expansion, with RMSE 1.73 and MAE 1.10, where historical data is scarce. These findings highlight the model's ability to support equitable and efficient mobility resource distribution, advancing broader goals of urban sustainability and inclusion.
5 RelatedWork
Demand Prediction for Bike-Sharing Systems. In recent years, bike-sharing demand prediction has evolved significantly. Early studies using time-series models like ARIMA and SARIMA captured temporal patterns but neglected spatial dynamics [Li et al., 2019]. Cluster-based methods improved short-term forecasts by grouping stations with similar demands, incorporating geographic and historical features [Chen et al., 2016; Lahoorpoor et al., 2019]. Station-level models integrated external data such as weather and events but faced challenges at data-sparse locations [Yu et al., 2023]. Advanced approaches, including spatio-temporal graph convolutional networks (STGCNs), effectively modeled spatialtemporal dependencies [Xiao et al., 2021; Ma et al., 2022; Tang et al., 2021], while TrafficStream introduced streaming GNN frameworks with continual learning for large-scale forecasting [Chen et al., 2021]. Reinforcement learning optimized operations in real-time settings [Demizu et al., 2023]. Bike-Sharing Systems Expansion. There is a substantial body of research dedicated to modeling the expansion of bike-sharing systems, such as planning optimal locations for new stations [Li and Zheng, 2020; Liang et al., 2024] or enhancing the capacity of existing stations [Liang et al., 2023b; Liang et al., 2023a]. However, much of this existing work assumes that the demand patterns for new stations will closely resemble those of existing stations, which differs significantly from our proposed approach. For example, the method in [Liu et al., 2017] proposed a zone-based hierarchical demand model to estimate average demand at newly added stations during different stages of expansion.
Dynamic Graph Modeling. Spatio-temporal graph networks capture dynamic spatial and temporal station relationships. RNN-based methods [Yu et al., 2017; Kapoor et al., 2020; Roy et al., 2021; Ghosh et al., 2020] use recurrent and graph convolutions but suffer inefficiency and gradient issues. CNN-based approaches [Mohamed et al., 2020; Zhang et al., 2022] enhance efficiency via graph and 1D convolutions yet risk oversmoothing. Inductive GNNs like GraphSAGE [Hamilton et al., 2017] and IGNN [Wu et al., 2020] enable scalable learning on large or incomplete graphs. Adaptive graph learning [Zheng et al., 2023] and transformer architectures [Jin et al., 2023] further improve modeling of dynamic and long-range dependencies.
6 Conclusion
In this paper, we proposed a novel framework BGM, designed to address the challenges of demand prediction in expanding bike-sharing systems. Built on dynamic graph modeling, BGM captures evolving spatio-temporal dependencies and enhances knowledge transfer to new stations through embedding transformation. The gated feature fusion mechanism optimally integrates transferred and intrinsic features, reducing negative transfer and ensuring accurate predictions with minimal historical data. Beyond technical advancements, BGM directly addresses societal challenges such as optimizing resource allocation, promoting equitable access to mobility, and supporting the sustainable expansion of urban transportation networks. Experiments on real-world datasets demonstrate that BGM outperforms existing methods, providing actionable insights for urban mobility planning. Future work will explore extending BGM to other urban systems and incorporating multi-modal data, further enhancing its societal impact in dynamic and diverse urban contexts.
@inproceedings{ijcai2025p1112,
  title     = {BGM: Demand Prediction for Expanding Bike-Sharing Systems with Dynamic Graph Modeling},
  author    = {Zhao, Yixuan and Wen, Hongkai and Zhang, Xingchen and Luo, Man},
  booktitle = {Proceedings of the Thirty-Fourth International Joint Conference on
               Artificial Intelligence, {IJCAI-25}},
  publisher = {International Joint Conferences on Artificial Intelligence Organization},
  editor    = {James Kwok},
  pages     = {10008--10016},
  year      = {2025},
  month     = {8},
  note      = {AI and Social Good},
  doi       = {10.24963/ijcai.2025/1112},
  url       = {https://doi.org/10.24963/ijcai.2025/1112},
}
TY - CPAPER TI - BGM: Demand Prediction for Expanding Bike-Sharing Systems with Dynamic Graph Modeling AU - Zhao, Yixuan AU - Wen, Hongkai AU - Zhang, Xingchen AU - Luo, Man T2 - Proceedings of the Thirty-Fourth International Joint Conference on Artificial Intelligence, IJCAI-25 PB - International Joint Conferences on Artificial Intelligence Organization PY - 2025 SP - 10008 EP - 10016 DO - 10.24963/ijcai.2025/1112 UR - https://doi.org/10.24963/ijcai.2025/1112 ER -Copied
Machine-readable versions of this paper, for tools and AI agents:





