
HealthLens: A Natural Language Querying System for Interactive Visualization of Electronic Health Records
Proceedings of the Thirty-Fourth International Joint Conference on Artificial Intelligence. Demo Track. Pages 11123-11126.
https://doi.org/10.24963/ijcai.2025/1276
Keywords
- Humans and AI: HAI: Applications
Abstract
As an essential part of modern healthcare systems, extracting valuable insights from electronic medical records (EMRs) remains challenging due to the complexity of structured and unstructured data. Data visualization is essential for transforming complex data into comprehensible visuals that enable professionals to identify patterns and trends. This process involves selecting data attributes, transforming the data, choosing appropriate visual encoding methods, and rendering graphical representations using declarative visualization languages (DVLs). However, achieving proficiency in DVLs requires a deep understanding of domain-specific data and expertise in these languages, which poses a significant barrier for beginners and non-technical users. To address these challenges, we present HealthLens, the first user-friendly visualization tool in the EMR domain that eliminates the need for prior knowledge of DVLs. Built on the MedCodeT5 model developed by us and leveraging a large language model with a bilevel optimization approach, HealthLens enables the generation of EMR visualizations from natural language queries. This demonstrates the feasibility of creating sophisticated visualizations with minimal technical expertise, advancing accessibility in the EMR field.
- [Cai et al., 2023] Fengquan Cai, Dong Cao, and Hui Ye. Graph Representation of Chinese EMRs and its Short-text Classification Application. In 2023 IEEE International Conference on Bioinformatics and Biomedicine (BIBM), pages 4513-4519, Los Alamitos, CA, USA, December 2023. IEEE Computer Society.
- [Crisan et al., 2022] Anamaria Crisan, Shannah E. Fisher, Jennifer L. Gardy, and Tamara Munzner. Gevitrec: Data reconnaissance through recommendation using a domain- specific visualization prevalence design space. IEEE Transactions on Visualization and Computer Graphics, 28(12):4855-4872, December 2022.
- [Fleming et al., 2024] Scott L. Fleming, Alejandro Lozano, William J. Haberkorn, Jenelle A. Jindal, Eduardo Reis, Rahul Thapa, Louis Blankemeier, Julian Z. Genkins, Ethan Steinberg, and et al. Nayak. Medalign: A clinician- generated dataset for instruction following with electronic medical records. Proceedings of the AAAI Conference on Artificial Intelligence, 38(20):22021-22030, Mar. 2024.
- [Li et al., 2018] Deqing Li, Honghui Mei, Yi Shen, Shuang Su, Wenli Zhang, Junting Wang, Ming Zu, and Wei Chen. Echarts: A declarative framework for rapid construction of web-based visualization. Visual Informatics, 2(2):136- 146, 2018.
- [Li et al., 2025] Shuaimin Li, Xuanang Chen, Yuanfeng Song, Yunze Song, Chen Jason Zhang, Fei Hao, and Lei Chen. prompt4vis: prompting large language models with example mining for tabular data visualization. The VLDB Journal, 34(4):38, May 2025.
- [Luo et al., 2021] Yuyu Luo, Nan Tang, Guoliang Li, Chengliang Chai, Wenbo Li, and Xuedi Qin. Synthesiz- ing natural language to visualization (nl2vis) benchmarks from nl2sql benchmarks. In Proceedings of the 2021 Inter- national Conference on Management of Data, SIGMOD '21, page 1235-1247, New York, NY, USA, 2021. Associ- ation for Computing Machinery.
- [Luo et al., 2022] Yuyu Luo, Nan Tang, Guoliang Li, Ji- awei Tang, Chengliang Chai, and Xuedi Qin. Natural language to visualization by neural machine translation. IEEE Transactions on Visualization and Computer Graph- ics, 28(1):217-226, 2022.
- [OpenAI, 2024] OpenAI. Gpt-4o system card, 2024.
- [Pandey et al., 2023] Aditeya Pandey, Sehi L'Yi, Qian- wen Wang, Michelle A. Borkin, and Nils Gehlenborg. Genorec: A recommendation system for interactive ge- nomics data visualization. IEEE Transactions on Visual- ization and Computer Graphics, 29(1):570-580, 2023.
- [Satyanarayan et al., 2017] Arvind Satyanarayan, Dominik Moritz, Kanit Wongsuphasawat, and Jeffrey Heer. Vega- lite: A grammar of interactive graphics. IEEE Transac- tions on Visualization and Computer Graphics, 23(1):341- 350, 2017.
- [Song et al., 2022] Yuanfeng Song, Xuefang Zhao, Ray- mond Chi-Wing Wong, and Di Jiang. Rgvisnet: A hybrid retrieval-generation neural framework towards automatic data visualization generation. In Proceedings of the 28th ACM SIGKDD Conference on Knowledge Discovery and Data Mining, KDD '22, page 1646-1655, New York, NY, USA, 2022. Association for Computing Machinery.
- [Song et al., 2024a] Yuanfeng Song, Jinwei Lu, Xuefang Zhao, Raymond Chi-Wing Wong, and Haodi Zhang. Demonstration of FeVisQA: Free-Form Question Answer- ing over Data Visualization . In 2024 IEEE 40th Inter- national Conference on Data Engineering (ICDE), pages 5417-5420, Los Alamitos, CA, USA, May 2024. IEEE Computer Society.
- [Song et al., 2024b] Yuanfeng Song, Xuefang Zhao, and Raymond Chi-Wing Wong. Marrying dialogue systems with data visualization: Interactive data visualization gen- eration from natural language conversations. In Proceed- ings of the 30th ACM SIGKDD Conference on Knowledge Discovery and Data Mining, KDD '24, page 2733-2744, New York, NY, USA, 2024. Association for Computing Machinery.
- [Song et al., 2025] Yuanfeng Song, Jinwei Lu, Yuanwei Song, Caleb Chen Cao, Raymond Chi-Wing Wong, and Haodi Zhang. Fevisqa: Free-form question answering over data visualizations. In 2025 IEEE 41st International Con- ference on Data Engineering (ICDE), pages 2726-2739. IEEE Computer Society, 2025.
- [Wang et al., 2021] Yue Wang, Weishi Wang, Shafiq Joty, and Steven C.H. Hoi. CodeT5: Identifier-aware unified pre-trained encoder-decoder models for code understand- ing and generation. In Marie-Francine Moens, Xuanjing Huang, Lucia Specia, and Scott Wen-tau Yih, editors, Pro- ceedings of the 2021 Conference on Empirical Methods in Natural Language Processing, pages 8696-8708, Online and Punta Cana, Dominican Republic, November 2021. Association for Computational Linguistics.
- [Williams and Boren, 2008] Faustine Williams and Suzanne Austin Boren. The role of the electronic medical record (emr) in care delivery development in developing countries: a systematic review. Informatics in primary care, 16(2), 2008.
- [Zhang et al., 2024] Weixu Zhang, Yifei Wang, Yuanfeng Song, Victor Junqiu Wei, Yuxing Tian, Yiyan Qi, Jonathan H. Chan, Raymond Chi-Wing Wong, and Haiqin Yang. Natural language interfaces for tabular data query- ing and visualization: A survey. IEEE Trans. on Knowl. and Data Eng., 36(11):6699-6718, November 2024.
References were extracted automatically from the PDF and may contain errors.
Full text extracted automatically from the PDF; figures, tables and equations may differ. The PDF is the version of record.
1 Introduction
Electronic medical records (EMRs) are central to modern healthcare, integrating patient data such as diagnoses, treatments, lab results, and clinical notes [Williams and Boren, 2008; Fleming et al., 2024]. However, the coexistence of structured data (e.g., lab values) and unstructured narratives presents challenges in extracting actionable insights, tracking disease progression, and evaluating treatment outcomes.
al., 2017] or ECharts [Li et al., 2018]. This technical demand, coupled with the need for deep familiarity with medical data structures, limits the adoption of visualization tools in clinical settings. Existing solutions focus on niche applications like genomic data exploration [Pandey et al., 2023] or epidemic tracking [Crisan et al., 2022], while falling short in supporting multimodal EMR analysis. Recent work has aimed to bridge this gap, with methods such as weakly supervised pre-training for clinical text [Cai et al., 2023], but these solutions often require manual coding and are not optimized for interactive visualization. The advent of natural language processing technologies has reshaped the way users interact with data visualizations [Zhang et al., 2024]. For example, systems like FeVisQA [Song et al., 2024a] [Song et al., 2025] and approaches integrating dialogue systems with data visualization [Song et al., 2024b] show promise in enabling interactive, natural language-driven visualizations. Additionally, methods like Prompt4Vis [Li et al., 2025] highlight the importance of schema filtering and example mining, yet these strategies have not been fully adapted to the complexities of EMRs. To address these challenges, we introduce HealthLens, an intelligent visualization system tailored for EMR exploration. Our approach eliminates the need for expertise in declarative visualization languages through two key innovations: (1) MedCodeT5, a domain-specific language model fine-tuned on medical coding schemas, and (2) a bilevel optimization framework that integrates large language models (LLMs) with visualization grammars. By processing natural language queries like "Show how blood glucose levels relate to insulin doses over the past year," HealthLens identifies relevant patient cohorts, processes temporal data, and generates annotated line charts with statistical summaries-no manual coding required. This system significantly reduces the technical barrier to advanced EMR analysis, enabling healthcare professionals to focus on clinical reasoning rather than implementation.
Data visualization offers a promising solution by translating raw EMR data into interpretable charts and dashboards [Song et al., 2022]. However, this process remains complex, requiring professionals to extract relevant data, select appropriate visual encodings, and implement visualizations using declarative languages like Vega-Lite [Satyanarayan et Our contributions include: (1) the first system that leverages LLMs to convert natural language queries into EMR visualizations, (2) a method integrating MedCodeT5 with LLM-based visualization planning for enhanced accuracy, and (3) a user-friendly platform that requires no specialized technical knowledge, making it accessible to healthcare teams.
large-scale benchmark dataset tailored for medical text-tovisualization tasks developed by us, MedCodeT5 demonstrates exceptional performance in generating accurate and contextually appropriate visualizations from complex medical queries.
Capabilities and Strengths. MedCodeT5 has the following capabilities and strengths:
- High Accuracy in Text-to-Vis Tasks: The model achieves state-of-the-art performance in Text-to-Vis generation by using multi-task learning techniques. It surpasses existing baselines like Seq2Vis [Luo et al., 2021], ncNet [Luo et al., 2022], and CodeT5 [Wang et al., 2021] in terms of both visualization accuracy and overall robustness.
- Adaptation to Medical Contexts: MedCodeT5 is uniquely suited for handling the diverse and intricate data types found in medical records. This domainspecific training allows the model to account for medical terminologies, abbreviations, and context-sensitive data relationships, which are often critical in healthcare scenarios.
- Robust Performance Across Difficulty Levels: MedCodeT5 demonstrates superior performance across varying levels of query complexity, from straightforward requests to highly intricate queries involving multiple clauses, nested conditions, and advanced filtering.
2.3 Auto Refinement and Correction of DVL
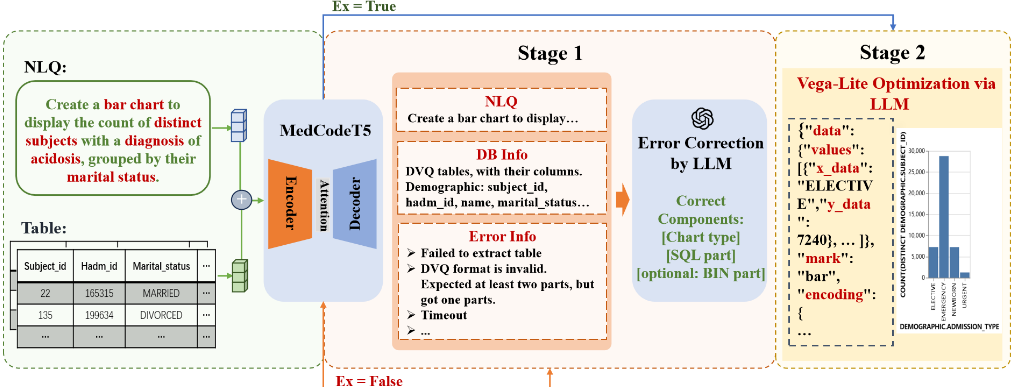
HealthLens features a robust error-handling mechanism powered by advanced large language models (e.g., GPT4), ensuring accurate visualizations even when user queries or generated specifications contain errors. When the MedCodeT5 model translates a query into DVL, it automatically detects errors during execution (such as invalid field references or unsupported chart types) and logs them. These error details are then sent to the LLM, which analyzes and refines
2 SystemDescription
To enable users to effortlessly create visualizations of EMR data using natural language instead of DVLs, HealthLens leverages MedCodeT5 as its foundational model. This model translates natural language inputs into corresponding DVL specifications, simplifying the visualization process for nontechnical users. Once the DVL specifications are generated, HealthLens executes them to produce the final visualization using the Vega-Lite framework, delivering high-quality and interactive graphical representations of the data. In cases where the execution fails, HealthLens captures the error information and utilizes a large language model, such as GPT4o [OpenAI, 2024], to analyze the error, correct the DVL based on the feedback, and refine the previous specifications. This iterative process ensures robust and accurate visualizations, even in the presence of initial errors. This process is shown in Figure 1.
2.1 MedicalVis Dataset
The MedicalVis dataset forms the backbone of MedCodeT5's capabilities. Comprising 35,374 instances and covering a diverse range of visualization types-including bar charts, pie charts, line charts, and scatter plots, MedicalVis provides a comprehensive benchmark for medical text-to-visualization tasks. The dataset was constructed using a novel pipeline that leverages large language models to generate high-quality DVLs from structured SQL queries. By training on this dataset, MedCodeT5 not only learns to generate accurate visualizations but also gains a deep understanding of medical data semantics, query structures, and visualization aesthetics.
2.2 Text-to-Vis UsingMedCodeT5
MedCodeT5 is specifically optimized for generating DVLs in the medical domain, enabling healthcare professionals and researchers to intuitively interact with EMRs using natural language queries. By leveraging the MedicalVis dataset, a the DVL. This process iteratively suggests corrections until a visually effective and accurate visualization is produced.
The mechanism is divided into two levels: the low-level and the high-level. At the low level, the LLM uses multiturn interactions to correct errors in the query, thus improving model accuracy. At the high level, the LLM is used for chart optimization, such as applying raster graphics, adding color, or inserting textual explanations. The first stage is currently implemented using GPT-4 and prompt engineering; when errors occur, GPT-4 is invoked after execution to correct them based on the error information. For chart optimization, GPT-4 generates corresponding chart descriptions based on the metrics and can enhance the chart's appearance, including adding colors or tooltips on the chart.
3 Demonstration HealthLens
To demonstrate the capabilities of HealthLens, we provide an example application scenario where a healthcare professional utilizes the tool to analyze patient data from EMRs. This scenario highlights the seamless interaction between the user and HealthLens, showcasing its ability to generate visualizations from natural language queries.
3.1 Application Scenario
A hospital administrator, Dr. Smith, wants to analyze the distribution of patient lengths of stay in the hospital to identify patterns and optimize resource allocation. Dr. Smith is not familiar with DVLs like Vega-Lite but is comfortable describing their needs in plain language.
Step 1: Input Natural Language Query
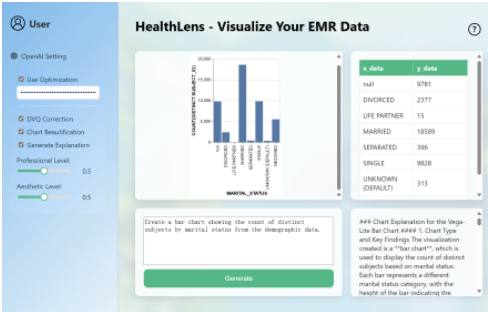
Dr. Smith opens HealthLens and sees a simple, user-friendly interface (shown in Figure 2) with a text input box. Dr. Smith types the following query:
"Create a bar chart visualizing the number of patients for each hospital stay duration."
Step 2: Query Processing
Upon submitting the query, HealthLens processes the input using the MedCodeT5 model, which translates the natural language query into a DVL specification. This specification is then executed using the Vega-Lite framework to generate the desired visualization.
Step 3: Visualization Output
Within seconds, a bar chart appears on the screen. The chart displays the distribution of hospital stay durations, with the x-axis representing the length of stay (in days) and the y-axis indicating the number of patients. The chart is interactive, allowing Dr. Smith to hover over each bar to see specific counts.
Step 4: Refinement and Customization
Dr. Smith wants to refine the chart further to focus on stays longer than 10 days. They type a follow-up query:
"Filter the chart to show hospital stays longer than 10 days."
If the chart is generated incorrectly, HealthLens will update the visualization with LLM to output the desired result and apply the specified optimization scheme to produce the beautified chart along with an explanation. Dr. Smith can now better analyze this subset of data to identify potential bottlenecks in the patient discharge process.
3.2 Key Features Highlighted in the Scenario
- Natural Language Querying: The ability to translate plain language into sophisticated visualizations eliminates the need for technical expertise.
- Interactivity: Users can interact with and refine visualizations dynamically, enhancing data exploration.
- ErrorHandling andCorrection: In case of insufficient or ambiguous input, HealthLens offers intelligent suggestions to guide the user.
- Accessibility: The tool's intuitive interface ensures that both technical and non-technical users can benefit from its advanced visualization capabilities.
This demonstration underscores the transformative potential of HealthLens in simplifying EMR data visualization. By lowering technical barriers and enabling intuitive interaction, the tool empowers healthcare professionals to extract meaningful insights from complex data, ultimately contributing to better decision-making and patient care.
4 Conclusion
In this paper, we introduced HealthLens, a novel and userfriendly visualization tool designed to simplify the process of exploring and analyzing electronic medical records. By leveraging the MedCodeT5 model and a bilevel optimization strategy, HealthLens translates natural language queries into accurate, visually compelling, and clinically relevant visualizations using DVLs. This eliminates the need for users to possess technical expertise, making advanced data visualization accessible to healthcare professionals and researchers alike. Through the demonstration scenario, we showcased how HealthLens empowers users to intuitively interact with medical data, refine visualizations dynamically, and extract actionable insights with minimal effort.
@inproceedings{ijcai2025p1276,
  title     = {HealthLens: A Natural Language Querying System for Interactive Visualization of Electronic Health Records},
  author    = {Zhang, Haodi and Ning, Siqi and Zheng, Qiyong and Song, Yuanfeng and Zhang, Liang-Jie},
  booktitle = {Proceedings of the Thirty-Fourth International Joint Conference on
               Artificial Intelligence, {IJCAI-25}},
  publisher = {International Joint Conferences on Artificial Intelligence Organization},
  editor    = {James Kwok},
  pages     = {11123--11126},
  year      = {2025},
  month     = {8},
  note      = {Demo Track},
  doi       = {10.24963/ijcai.2025/1276},
  url       = {https://doi.org/10.24963/ijcai.2025/1276},
}
TY - CPAPER TI - HealthLens: A Natural Language Querying System for Interactive Visualization of Electronic Health Records AU - Zhang, Haodi AU - Ning, Siqi AU - Zheng, Qiyong AU - Song, Yuanfeng AU - Zhang, Liang-Jie T2 - Proceedings of the Thirty-Fourth International Joint Conference on Artificial Intelligence, IJCAI-25 PB - International Joint Conferences on Artificial Intelligence Organization PY - 2025 SP - 11123 EP - 11126 DO - 10.24963/ijcai.2025/1276 UR - https://doi.org/10.24963/ijcai.2025/1276 ER -Copied
Machine-readable versions of this paper, for tools and AI agents:





