
Template3D-AD: Point Cloud Template Matching Method Based on Center Points for 3D Anomaly Detection
Proceedings of the Thirty-Fourth International Joint Conference on Artificial Intelligence. Main Track. Pages 1630-1638.
https://doi.org/10.24963/ijcai.2025/182
Keywords
- Computer Vision: CV: Transfer, low-shot, semi- and un- supervised learning
- Computer Vision: CV: 3D computer vision
- Computer Vision: CV: Recognition (object detection, categorization)
Abstract
Existing 3D anomaly detection methods mainly include reconstruction-based methods and memory-based methods. However, reconstruction-based methods rely on anomaly simulation strategies, while the memory bank of memory-based methods cannot cover the features of all points. Different from existing methods, this paper proposes Template3D-AD, a 3D anomaly detection method based on template matching. Template3D-AD matches the test sample with the template based on center points, and extracts the global features and local features of the center point respectively. Considering that the appearance of anomalies is related to the change of surface shape, this paper proposes a curvature-based local feature representation method, which increases the feature difference between abnormal surfaces and normal surfaces. Then, this paper designs a global-local detection strategy, which combines global feature differences and local feature differences for anomaly detection. Extensive experiments show that Template3D-AD outperforms the state-of-the-art methods, achieving 84.4% (1.5% ↑) I-AUROC on the Real3D-AD dataset and 86.5% (11.6% ↑) I-AUROC on the Anomaly-ShapeNet dataset. Code at https://github.com/CaedmonLY/Template3D-AD.
- [Bae et al., 2023] Jaehyeok Bae, Jae-Han Lee, and Seyun Kim. Pni: Industrial anomaly detection using position and neighborhood information. In Proceedings of the IEEE/CVF International Conference on Computer Vision, pages 6373-6383, 2023.
- [Bergmann et al., 2020] Paul Bergmann, Michael Fauser, David Sattlegger, and Carsten Steger. Uninformed stu- dents: Student-teacher anomaly detection with discrimina- tive latent embeddings. In Proceedings of the IEEE/CVF conference on computer vision and pattern recognition, pages 4183-4192, 2020.
- [Cao et al., 2024a] Yunkang Cao, Xiaohao Xu, and Weim- ing Shen. Complementary pseudo multimodal feature for point cloud anomaly detection. Pattern Recognition, 156:110761, 2024.
- [Cao et al., 2024b] Yunkang Cao, Xiaohao Xu, and Weim- ing Shen. Complementary pseudo multimodal feature for point cloud anomaly detection. Pattern Recognition, 156:110761, 2024.
- [Chang et al., 2015] Angel X Chang, Thomas Funkhouser, Leonidas Guibas, Pat Hanrahan, Qixing Huang, Zimo Li, Silvio Savarese, Manolis Savva, Shuran Song, Hao Su, et al. Shapenet: An information-rich 3d model repository. arXiv preprint arXiv:1512.03012, 2015.
- [Chen et al., 2024] Xiaolu Chen, Haote Xu, Chenghao Deng, Xiaotong Tu, Xinghao Ding, and Yue Huang. Im- plicit foreground-guided network for anomaly detection and localization. In ICASSP 2024-2024 IEEE Interna- tional Conference on Acoustics, Speech and Signal Pro- cessing (ICASSP), pages 2970-2974. IEEE, 2024.
- [Defard et al., 2021] Thomas Defard, Aleksandr Setkov, An- gelique Loesch, and Romaric Audigier. Padim: a patch distribution modeling framework for anomaly detection and localization. In International Conference on Pattern Recognition, pages 475-489. Springer, 2021.
- [Duan et al., 2023] Yuxuan Duan, Yan Hong, Li Niu, and Liqing Zhang. Few-shot defect image generation via defect-aware feature manipulation. In Proceedings of the AAAI Conference on Artificial Intelligence, volume 37, pages 571-578, 2023.
- [Horwitz and Hoshen, 2023] Eliahu Horwitz and Yedid Hoshen. Back to the feature: classical 3d features are (almost) all you need for 3d anomaly detection. In Proceedings of the IEEE/CVF Conference on Computer Vision and Pattern Recognition, pages 2968-2977, 2023.
- [Hou et al., 2021] Jinlei Hou, Yingying Zhang, Qiaoyong Zhong, Di Xie, Shiliang Pu, and Hong Zhou. Divide-and- assemble: Learning block-wise memory for unsupervised anomaly detection. In Proceedings of the IEEE/CVF In- ternational Conference on Computer Vision, pages 8791- 8800, 2021.
- [Hu et al., 2022] Qiming Hu, Kuangrong Hao, Bing Wei, and Haijian Li. An efficient solder joint defects method for 3d point clouds with double-flow region attention network. Advanced Engineering Informatics, 52:101608, 2022.
- [Hyun et al., 2024] Jeeho Hyun, Sangyun Kim, Giyoung Jeon, Seung Hwan Kim, Kyunghoon Bae, and Byung Jun Kang. Reconpatch: Contrastive patch representation learning for industrial anomaly detection. In Proceedings of the IEEE/CVF Winter Conference on Applications of Computer Vision, pages 2052-2061, 2024.
- [Koshil et al., 2024] Mykhailo Koshil, Tilman Wegener, Detlef Mentrup, Simone Frintrop, and Christian Wilms. Anomalouspatchcore: Exploring the use of anomalous samples in industrial anomaly detection. arXiv preprint arXiv:2408.15113, 2024.
- [Li et al., 2024] Wenqiao Li, Xiaohao Xu, Yao Gu, Bozhong Zheng, Shenghua Gao, and Yingna Wu. Towards scalable 3d anomaly detection and localization: A benchmark via 3d anomaly synthesis and a self-supervised learning net- work. In Proceedings of the IEEE/CVF Conference on Computer Vision and Pattern Recognition, pages 22207- 22216, 2024.
- [Liu et al., 2024] Jiaqi Liu, Guoyang Xie, Ruitao Chen, Xin- peng Li, Jinbao Wang, Yong Liu, Chengjie Wang, and Feng Zheng. Real3d-ad: A dataset of point cloud anomaly detection. Advances in Neural Information Processing Systems, 36, 2024.
- [Pang et al., 2022] Yatian Pang, Wenxiao Wang, Francis EH Tay, Wei Liu, Yonghong Tian, and Li Yuan. Masked au- toencoders for point cloud self-supervised learning. In European conference on computer vision, pages 604-621. Springer, 2022.
- [Qi et al., 2017] Charles Ruizhongtai Qi, Li Yi, Hao Su, and Leonidas J Guibas. Pointnet++: Deep hierarchical feature learning on point sets in a metric space. Advances in neu- ral information processing systems, 30, 2017.
- [Ristea et al., 2022] Nicolae-Cȃtȃlin Ristea, Neelu Madan, Radu Tudor Ionescu, Kamal Nasrollahi, Fahad Shahbaz Khan, Thomas B Moeslund, and Mubarak Shah. Self- supervised predictive convolutional attentive block for anomaly detection. In Proceedings of the IEEE/CVF con- ference on computer vision and pattern recognition, pages 13576-13586, 2022.
- [Roth et al., 2022] Karsten Roth, Latha Pemula, Joaquin Zepeda, Bernhard Schölkopf, Thomas Brox, and Peter Gehler. Towards total recall in industrial anomaly detec- tion. In Proceedings of the IEEE/CVF conference on com- puter vision and pattern recognition, pages 14318-14328, 2022.
- [Rudolph et al., 2023] Marco Rudolph, Tom Wehrbein, Bodo Rosenhahn, and Bastian Wandt. Asymmetric student-teacher networks for industrial anomaly detection. In Proceedings of the IEEE/CVF winter conference on ap- plications of computer vision, pages 2592-2602, 2023.
- [Rusinkiewicz and Levoy, 2001] Szymon Rusinkiewicz and Marc Levoy. Efficient variants of the icp algorithm. In Proceedings third international conference on 3-D digital imaging and modeling, pages 145-152. IEEE, 2001.
- [Rusu et al., 2009] Radu Bogdan Rusu, Nico Blodow, and Michael Beetz. Fast point feature histograms (fpfh) for 3d registration. In 2009 IEEE international conference on robotics and automation, pages 3212-3217. IEEE, 2009.
- [Tien et al., 2023] Tran Dinh Tien, Anh Tuan Nguyen, Nguyen Hoang Tran, Ta Duc Huy, Soan Duong, Chanh D Tr Nguyen, and Steven QH Truong. Revisiting re- verse distillation for anomaly detection. In Proceedings of the IEEE/CVF conference on computer vision and pattern recognition, pages 24511-24520, 2023.
- [Wang et al., 2023] Yue Wang, Jinlong Peng, Jiangning Zhang, Ran Yi, Yabiao Wang, and Chengjie Wang. Mul- timodal industrial anomaly detection via hybrid fusion. In Proceedings of the IEEE/CVF Conference on Computer Vision and Pattern Recognition, pages 8032-8041, 2023.
- [Wu et al., 2024] Qiangwei Wu, Hui Li, Chenyu Tian, Long Wen, and Xinyu Li. Aekd: Unsupervised auto-encoder knowledge distillation for industrial anomaly detection. Journal of Manufacturing Systems, 73:159-169, 2024.
- [Yan et al., 2021] Xudong Yan, Huaidong Zhang, Xuemiao Xu, Xiaowei Hu, and Pheng-Ann Heng. Learning seman- tic context from normal samples for unsupervised anomaly detection. In Proceedings of the AAAI conference on arti- ficial intelligence, volume 35, pages 3110-3118, 2021.
- [Zavrtanik et al., 2021a] Vitjan Zavrtanik, Matej Kristan, and Danijel Skočaj. Draem-a discriminatively trained re- construction embedding for surface anomaly detection. In Proceedings of the IEEE/CVF international conference on computer vision, pages 8330-8339, 2021.
- [Zavrtanik et al., 2021b] Vitjan Zavrtanik, Matej Kristan, and Danijel Skočaj. Reconstruction by inpainting for vi- sual anomaly detection. Pattern Recognition, 112:107706, 2021.
- [Zavrtanik et al., 2022] Vitjan Zavrtanik, Matej Kristan, and Danijel Skočaj. Dsr-a dual subspace re-projection network for surface anomaly detection. In European conference on computer vision, pages 539-554. Springer, 2022.
- [Zhang et al., 2024a] Jie Zhang, Masanori Suganuma, and Takayuki Okatani. Contextual affinity distillation for im- age anomaly detection. In Proceedings of the IEEE/CVF Winter Conference on Applications of Computer Vision, pages 149-158, 2024.
- [Zhang et al., 2024b] Ruifan Zhang, Hao Wang, Mingyao Feng, Yikun Liu, and Gongping Yang. Dual-constraint autoencoder and adaptive weighted similarity spatial at- tention for unsupervised anomaly detection. IEEE Trans- actions on Industrial Informatics, 2024.
- [Zhao et al., 2024] Baozhu Zhao, Qiwei Xiong, Xiaohan Zhang, Jingfeng Guo, Qi Liu, Xiaofen Xing, and Xi- angmin Xu. Pointcore: Efficient unsupervised point cloud anomaly detector using local-global features. arXiv preprint arXiv:2403.01804, 2024.
- [Zhou et al., 2024] Zheyuan Zhou, Le Wang, Naiyu Fang, Zili Wang, Lemiao Qiu, and Shuyou Zhang. R3d-ad: Re- construction via diffusion for 3d anomaly detection. In European Conference on Computer Vision (ECCV), 2024.
References were extracted automatically from the PDF and may contain errors.
Full text extracted automatically from the PDF; figures, tables and equations may differ. The PDF is the version of record.
1 Introduction
Industrial anomaly detection aims to detect whether there are anomalies in industrial products. Due to the lack of abnormal samples, current anomaly detection methods generally adopt an unsupervised framework. Most of the current anomaly detection methods [Zavrtanik et al., 2021a; Zavrtanik et al., 2021b; Zhang et al., 2024a; Defard et al., 2021] are based on 2D images. However, in industrial scenarios, image acquisition requires strict lighting conditions, and the quality of images affects the performance of deep learning methods [Hu et al., 2022].
Recently, with the release of 3D point cloud datasets such as Real3D-AD [Liu et al., 2024] and Anomaly-ShapeNet [Li et al., 2024], researchers have focused on the 3D anomaly detection task. Current research on 3D anomaly detection mainly includes reconstruction-based methods and memorybased methods. Since point cloud training samples are limited, reconstruction-based methods [Li et al., 2024; Zhou et al., 2024] use anomaly simulation strategies to generate abnormal regions and construct a large number of abnormal samples. These abnormal samples are used to train the reconstruction model, which reconstructs abnormal samples into normal samples. In testing, the difference between the input sample and the reconstructed sample is used for anomaly detection. Memory-based methods [Liu et al., 2024; Horwitz and Hoshen, 2023; Wang et al., 2023; Zhao et al., 2024] uses a pre-trained point cloud model to extract training sample features, and some core features are selected from all training sample features to construct a memory bank. In testing, the nearest Euclidean distance between the test sample features and the memory features is used as the anomaly score.
∗Corresponding author
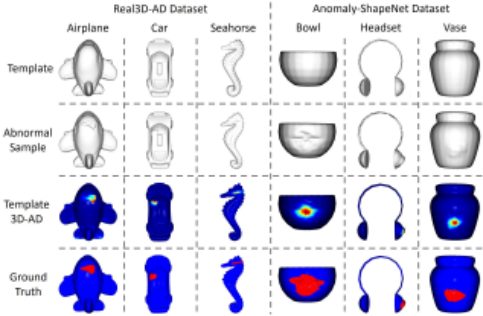
Reconstruction-based and memory-based methods have certain limitations. For reconstruction-based methods, the anomaly simulation strategy affects the performance of the reconstructed model. Generated anomalies need to be similar to the real anomalies, and different anomaly simulation strategies need to be designed for different industrial products. In addition, in industrial scenarios, the occurrence of anomalies is uncertain, that is, all possible types of anomalies are unknown in advance. In industrial applications, it is impossible to simulate all types of anomalies, and newly emerging anomalies cannot be effectively detected. For memory-based methods, the memory bank size is generally set to 10,000 [Liu et al., 2024], while the number of points per sample in the Real3D-AD dataset ranges from hundreds of thousands to millions. The features in the memory bank cannot cover the features of all points, and the test features and memory bank features with the closest distance may be features of different regions.
Different from existing methods, this paper proposes a template matching-based method for 3D anomaly detection, namely Template3D-AD. Figure 1 visualizes the anomaly detection results of Template3D-AD on the Real3D-AD and Anomaly-ShapeNet datasets. Template3D-AD defines the point cloud template matching as the matching of center points, and extracts global features and local features of the center points for 3D anomaly detection. Since anomalies are generally caused by shape changes of local surfaces, introducing local shape information is beneficial for anomaly detection. This paper uses curvature to represent surface shape information, and proposes Curvature Aggregation, which aggregates the features of each point in the local surface based on the curvature. By introducing local shape information, Curvature Aggregation further increases the feature difference between abnormal and normal surfaces. Then, this paper designs a global-local detection strategy, where global detection and local detection complement each other to achieve more effective detection.
The main contributions are summarized as follows:
- This paper proposes Template3D-AD, the first template matching method for the 3D anomaly detection task.
- This paper proposes Curvature Aggregation, introducing shape information into local feature representation, which is beneficial for 3D anomaly detection.
- This paper designs a global-local detection strategy, which combines global feature differences and local feature differences for 3D anomaly detection.
- Template3D-AD only requires one normal sample, and achieves state-of-the-art performance on the Real3DAD and Anomaly-ShapeNet datasets.
2 RelatedWork
2D Anomaly Detection. Most of existing anomaly detection methods are based on 2D images, mainly including reconstruction-based methods [Zavrtanik et al., 2021a; Zavrtanik et al., 2021b; Hou et al., 2021], knowledge distillationbased methods [Zhang et al., 2024a; Tien et al., 2023; Bergmann et al., 2020; Rudolph et al., 2023], and memorybased methods [Defard et al., 2021; Koshil et al., 2024; Hyun et al., 2024]. Reconstruction-based methods generally use autoencoders [Ristea et al., 2022; Zhang et al., 2024b; Zavrtanik et al., 2022] or generative adversarial networks [Yan et al., 2021; Duan et al., 2023] to reconstruct abnormal samples into normal samples for anomaly detection. IFgNet [Chen et al., 2024] divides the reconstruction task into foreground detection and foreground reconstruction tasks, and uses the foreground reconstruction results for anomaly detection. Knowledge distillation-based methods use different feature representations of abnormal regions by the teacher and the student for anomaly detection. AEKD [Wu et al., 2024] designed different data flows for the teacher model and the student model, which enhances the representation differences of abnormal features. Memory-based methods store the features of normal samples and compare the features of test samples with the stored features for anomaly detection. PatchCore [Roth et al., 2022] is the first memory-based method, and PNI [Bae et al., 2023] adds position and neighborhood information to the features in the memory bank.
3D Anomaly Detection. Compared with 2D anomaly detection, research on 3D anomaly detection is still limited. Current 3D detection methods are mainly based on pretrained PointMAE [Liu et al., 2024; Li et al., 2024; Wang et al., 2023; Zhao et al., 2024; Pang et al., 2022] or Fast Point Feature Histogram (FPFH) [Horwitz and Hoshen, 2023; Rusu et al., 2009; Cao et al., 2024a], where FPFH is a statistics-based 3D local surface descriptor. For memorybased methods, BTF [Horwitz and Hoshen, 2023] uses FPFH features to construct the memory bank, while M3DM [Wang et al., 2023] uses the features extracted by pretrained PointMAE. Reg3D-AD [Liu et al., 2024] constructs the coordinate memory bank and PointMAE feature memory bank respectively for joint anomaly detection. For reconstruction-based methods, IMRNet [Li et al., 2024] masks local points and uses pretrained PointMAE for self-supervised reconstruction. R3D-AD [Zhou et al., 2024] implements the application of diffusion model for 3D anomaly detection, and proposes a 3D anomaly simulation strategy. Different from existing methods, this paper proposes a template matching based method, which only requires one normal sample. In addition, this paper proposes a local feature representation method based on curvature, which introduces shape information into local feature representation.
3 Methodology
The framework of the proposed Template3D-AD is shown in Figure 2. Template3D-AD takes both the test sample point cloud and the template point cloud as input. In center point matching, Template3D-AD matches the test sample with the template by matching center points and center point neighborhoods (point groups). Then, for the matched point groups, global features and local features are extracted respectively. In global feature extraction, Curvature Aggregation is proposed, which aggregates the features of all points in each point group into a local feature representation based on curvature. Finally, global-local detection combines global and local feature differences for 3D anomaly detection.
3.1 Center Point Matching
A point cloud is a set of a large number of unordered points, and it is impossible to match all points of the test sample with the template. This paper defines template matching as center point matching, that is, matching the center points of the test sample and the template at the same position, where center points are a small number of points that preserve the shape of the object as much as possible.
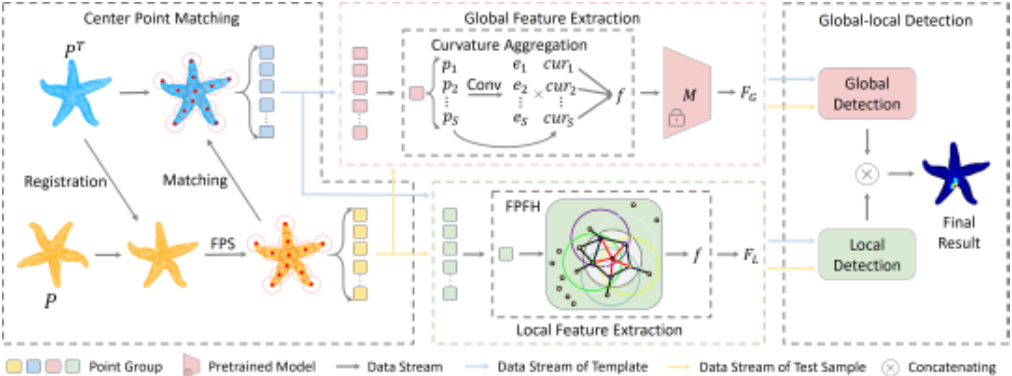
This paper downsamples the test sample P and the template P T based on voxel grid, and then uses RANdom Sample Consensus (RANSAC) [Cao et al., 2024b] and Iterative Closest Point (ICP) [Rusinkiewicz and Levoy, 2001] to calculate the transformation matrix. This transformation matrix is used for test sample registration. For the registered P, Farthest Point Sampling (FPS) [Qi et al., 2017] is used to sample N center points ci(i = 1, . . . ,N). For P T , the center point cTi is defined as:
For each center point, the nearest S points are used as a local point group. After the center points are matched, the point groups of P and P T are also matched. The matched point groups are used to extract global features and local features.
3.2 Global Feature Extraction
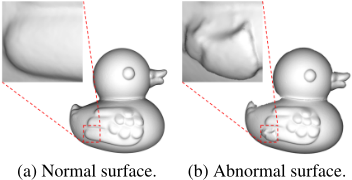
Before global feature extraction, each point group needs to be represented as a local feature. For each point group, convolutional neural networks are used to preliminarily extract the features of each point. In the 3D anomaly detection, anomalies are often related to surface shape changes. As shown in Figure 3, there are obvious shape differences between the normal local surface and the abnormal local surface. Therefore, introducing shape information into the local feature representation is beneficial for the 3D anomaly detection task.
This paper uses curvature to represent the local shape information of 3D objects, and curvature measures the distribution of local points. A large curvature indicates that the position coordinates between local points are quite different, i.e., there are obvious shape changes. In each point group, the curvature of each point pi = (xi, yi, zi)(i = 1, . . .S) is obtained from the distribution of neighboring points. For kcur neighboring points pi1, . . . , pik of pi, the covariance matrix can be expressed as:
where xi = 1 kcur ∑kcur j=1 xij and yi = 1 kcur ∑kcur j=1 yij. Since the covariance matrix is symmetric and semi-positive definite, CMi can be further eigenvalue decomposition:
where Λi is the diagonal matrix containing eigenvalues (λi3 > λi2 > λi1 ≥ 0), and Vi is the corresponding eigenvector matrix.
The eigenvalues of CMi provide the distribution information of local points in different directions, where the largest eigenvalue λi3 measures the distribution on the tangent, and the smallest eigenvalue λi1 measures the distribution on the normal. This paper uses the distribution of kcur neighboring points on the normal to approximate the curvature of pi. The curvature of pi can be expressed as:
where λi1 + λi2 + λi3 represents the overall distribution.
To introduce shape information into local features, this paper proposes Curvature Aggregation, a curvature-based local feature representation method. In each point group, the curvature of each point is used as the aggregation weight. The process of Curvature Aggregation can be expressed as:
where f is the local feature representation of the point group, and conv(·) is the convolution operation. Then, the curvature-based local feature representation is used for global feature extraction.
Existing 3D anomaly detection methods [Liu et al., 2024; Li et al., 2024; Wang et al., 2023; Zhao et al., 2024] directly use max pooling to aggregate the features of each point group. Compared with max pooling, Curvature Aggregation introduces curvature information in local feature representation. Based on Curvature Aggregation, there is a greater feature difference between normal regions and abnormal regions, which is beneficial for 3D anomaly detection. In this paper, Curvature Aggregation is used to replace the max pooling of the pretrained model.
3.3 Local Feature Extraction
In this paper, global features and local features are jointly used for anomaly detection. This paper use Fast Point Feature Histogram (FPFH) [Rusu et al., 2009] to extract local features. FPFH is a local descriptor of point cloud based on point coordinates and normal vectors. For points p1 and p2 and their normal vectors n1 and n2, the local coordinate system is redefined as:
where u, v, and w are unit vectors. Then, FPFH defines the angular variations between n1 and n2 as:
For the center point of each point group, this paper calculates the triplet (α, φ, θ) between c and the nearest kFPFH points, and statistically obtains a Simplified Point Feature Histogram (SPFH). In addition, to increase the receptive field, FPFH also takes each neighboring point as the center point and calculates SPFH. FPFH features of the center point c can be expressed as:
where ωi is the distance between c and the neighboring point pi. FPFH features of center points are used as the local features for local anomaly detection.
3.4 Global-local Detection
After global feature extraction and local feature extraction, the global feature F TG and local feature F T L of the template, and FG and FL of the test sample are obtained. Then, global detection and local detection are performed on the test sample respectively. For global detection, the Euclidean distance is used to quantify the feature difference between F TG and FG. For the abnormal surface, local shape changes may cause changes in the center point position. In global detection, the center point coordinate differences between the template and the test sample are also considered. The global anomaly score of the center point ci is defined as:
where f T i is the global feature of cTi , and fi is the global feature of ci. The global detection score of the test sample is the maximum value of all center points.
In local detection, the local feature of each point group is represented as FPFH, which indicates the statistical information of the position and normal vector in the local surface. This paper uses the maximum statistical difference as the local anomaly score, and the local anomaly score of ci is defined as:
The local detection score of the test sample is the maximum value of all center points.
In this paper, the final anomaly score of each center point is determined by both global detection and local detection:
For the non-center point, the anomaly score is defined as the mean of the nearest kScore center points.
4 Experiments
4.1 Dataset
The proposed Template3D-AD is experimented on the Real3D-AD [Liu et al., 2024] and Anomaly-ShapeNet [Li et al., 2024] datasets. Real3D-AD is a high-resolution point cloud dataset based on real industrial products, with the number of points in each sample ranging from hundreds of thousands to millions. Real3D-AD contains 12 categories and a total of 1254 samples. The training set of each category contains only 4 normal samples. Anomaly-ShapeNet is a synthesized point cloud dataset based on the ShapeNet dataset
| Method | Airplane | Car | Candy | Chicken | Diamond | Duck | Fish | Gemstone | Seahorse | Shell | Starfish | Toffees | Mean |
|---|---|---|---|---|---|---|---|---|---|---|---|---|---|
| BTF (Raw) [Horwitz and Hoshen, 2023] | 0.730 | 0.647 | 0.539 | 0.789 | 0.707 | 0.691 | 0.602 | 0.686 | 0.596 | 0.396 | 0.530 | 0.703 | 0.635 |
| BTF (FPFH) [Horwitz and Hoshen, 2023] | 0.520 | 0.560 | 0.630 | 0.432 | 0.545 | 0.784 | 0.549 | 0.648 | 0.779 | 0.754 | 0.575 | 0.462 | 0.603 |
| M3DM [Wang et al., 2023] | 0.434 | 0.541 | 0.552 | 0.683 | 0.602 | 0.433 | 0.540 | 0.644 | 0.495 | 0.694 | 0.551 | 0.450 | 0.552 |
| PatchCore (FPFH) [Roth et al., 2022] | 0.882 | 0.590 | 0.541 | 0.837 | 0.574 | 0.546 | 0.675 | 0.370 | 0.505 | 0.589 | 0.441 | 0.565 | 0.593 |
| PatchCore (FPFH+Raw) [Roth et al., 2022] | 0.848 | 0.777 | 0.570 | 0.853 | 0.784 | 0.628 | 0.837 | 0.359 | 0.767 | 0.663 | 0.471 | 0.626 | 0.682 |
| PatchCore (PointMAE) [Roth et al., 2022] | 0.726 | 0.498 | 0.663 | 0.827 | 0.783 | 0.489 | 0.630 | 0.374 | 0.539 | 0.501 | 0.519 | 0.585 | 0.594 |
| CPMF [Cao et al., 2024a] | 0.701 | 0.551 | 0.552 | 0.504 | 0.523 | 0.582 | 0.558 | 0.589 | 0.729 | 0.653 | 0.700 | 0.390 | 0.586 |
| Reg3D-AD [Liu et al., 2024] | 0.716 | 0.697 | 0.685 | 0.852 | 0.900 | 0.584 | 0.915 | 0.417 | 0.762 | 0.583 | 0.506 | 0.827 | 0.704 |
| IMRNet [Li et al., 2024] | 0.762 | 0.711 | 0.755 | 0.780 | 0.905 | 0.517 | 0.880 | 0.674 | 0.604 | 0.665 | 0.674 | 0.774 | 0.725 |
| R3D-AD [Zhou et al., 2024] | 0.772 | 0.696 | 0.713 | 0.714 | 0.685 | 0.909 | 0.692 | 0.665 | 0.720 | 0.840 | 0.701 | 0.703 | 0.734 |
| PointCore [Zhao et al., 2024] | 0.660 | 0.866 | 0.976 | 0.841 | 0.963 | 0.684 | 0.993 | 0.535 | 0.973 | 0.882 | 0.652 | 0.929 | 0.829 |
| Template3D-AD | 0.718 | 0.880 | 0.875 | 0.786 | 0.992 | 0.709 | 0.980 | 0.629 | 0.885 | 0.921 | 0.829 | 0.924 | 0.844 |
| Method | ashtray0 | bag0 | bottle0 | bottle1 | bottle3 | bowl0 | bowl1 | bowl2 | bowl3 | bowl4 | bowl5 | bucket0 | bucket1 | cap0 | |
|---|---|---|---|---|---|---|---|---|---|---|---|---|---|---|---|
| BTF (Raw) [Horwitz and Hoshen, 2023] | 0.578 | 0.410 | 0.597 | 0.510 | 0.568 | 0.564 | 0.264 | 0.525 | 0.385 | 0.664 | 0.417 | 0.617 | 0.321 | 0.668 | |
| BTF (FPFH) [Horwitz and Hoshen, 2023] | 0.420 | 0.546 | 0.344 | 0.546 | 0.322 | 0.509 | 0.668 | 0.510 | 0.490 | 0.609 | 0.699 | 0.401 | 0.633 | 0.618 | |
| M3DM [Wang et al., 2023] | 0.577 | 0.537 | 0.574 | 0.637 | 0.541 | 0.634 | 0.663 | 0.684 | 0.617 | 0.464 | 0.409 | 0.309 | 0.501 | 0.557 | |
| PatchCore (FPFH) [Roth et al., 2022] | 0.587 | 0.571 | 0.604 | 0.667 | 0.572 | 0.504 | 0.639 | 0.615 | 0.537 | 0.494 | 0.558 | 0.469 | 0.551 | 0.580 | |
| PatchCore (PointMAE) [Roth et al., 2022] | 0.591 | 0.601 | 0.513 | 0.601 | 0.650 | 0.523 | 0.629 | 0.458 | 0.579 | 0.501 | 0.593 | 0.593 | 0.561 | 0.589 | |
| CPMF [Cao et al., 2024a] | 0.353 | 0.643 | 0.520 | 0.482 | 0.405 | 0.783 | 0.639 | 0.625 | 0.658 | 0.683 | 0.685 | 0.482 | 0.601 | 0.601 | |
| Reg3D-AD [Liu et al., 2024] | 0.597 | 0.706 | 0.486 | 0.695 | 0.525 | 0.671 | 0.525 | 0.490 | 0.348 | 0.663 | 0.593 | 0.610 | 0.752 | 0.693 | |
| IMRNet [Li et al., 2024] | 0.671 | 0.660 | 0.552 | 0.700 | 0.640 | 0.681 | 0.702 | 0.685 | 0.599 | 0.676 | 0.710 | 0.580 | 0.771 | 0.737 | |
| R3D-AD [Zhou et al., 2024] | 0.833 | 0.720 | 0.733 | 0.737 | 0.781 | 0.819 | 0.778 | 0.741 | 0.767 | 0.744 | 0.656 | 0.683 | 0.756 | 0.822 | |
| Template3D-AD | 1.000 | 0.776 | 1.000 | 1.000 | 0.911 | 1.000 | 0.870 | 0.907 | 0.807 | 0.930 | 0.975 | 0.997 | 0.902 | 0.700 | |
| Method | cap3 | cap4 | cap5 | cup0 | cup1 | eraser0 | headset0 | headset1 | helmet0 | helmet1 | helmet2 | helmet3 | jar0 | ||
| BTF(Raw) [Horwitz and Hoshen, 2023] | 0.527 | 0.468 | 0.373 | 0.403 | 0.521 | 0.525 | 0.378 | 0.515 | 0.553 | 0.349 | 0.602 | 0.526 | 0.420 | ||
| BTF(FPFH) [Horwitz and Hoshen, 2023] | 0.522 | 0.520 | 0.586 | 0.586 | 0.610 | 0.719 | 0.520 | 0.490 | 0.571 | 0.719 | 0.542 | 0.444 | 0.424 | ||
| M3DM [Wang et al., 2023] | 0.423 | 0.777 | 0.639 | 0.539 | 0.556 | 0.627 | 0.577 | 0.617 | 0.526 | 0.427 | 0.623 | 0.374 | 0.441 | ||
| PatchCore(FPFH) [Roth et al., 2022] | 0.453 | 0.757 | 0.790 | 0.600 | 0.586 | 0.657 | 0.583 | 0.637 | 0.546 | 0.484 | 0.425 | 0.404 | 0.472 | ||
| PatchCore(PointMAE) [Roth et al., 2022] | 0.476 | 0.727 | 0.538 | 0.610 | 0.556 | 0.677 | 0.591 | 0.627 | 0.556 | 0.552 | 0.447 | 0.424 | 0.483 | ||
| CPMF [Cao et al., 2024a] | 0.551 | 0.553 | 0.697 | 0.497 | 0.499 | 0.689 | 0.643 | 0.458 | 0.555 | 0.589 | 0.462 | 0.520 | 0.610 | ||
| Reg3D-AD [Liu et al., 2024] | 0.725 | 0.643 | 0.467 | 0.510 | 0.538 | 0.343 | 0.537 | 0.610 | 0.600 | 0.381 | 0.614 | 0.367 | 0.592 | ||
| IMRNet [Li et al., 2024] | 0.775 | 0.652 | 0.652 | 0.643 | 0.757 | 0.548 | 0.720 | 0.676 | 0.597 | 0.600 | 0.641 | 0.573 | 0.780 | ||
| R3D-AD [Zhou et al., 2024] | 0.730 | 0.681 | 0.670 | 0.776 | 0.757 | 0.890 | 0.738 | 0.795 | 0.757 | 0.720 | 0.633 | 0.707 | 0.838 | ||
| Template3D-AD | 0.779 | 0.828 | 0.643 | 0.710 | 0.781 | 0.936 | 0.557 | 0.786 | 0.886 | 0.857 | 0.858 | 1.000 | |||
| Method | microphone0 | 0.658 | shelf0 | tap0 | tap1 | vase0 | vase1 | vase2 | vase3 | vase4 | vase5 | vase7 | vase8 | vase9 | Mean |
| BTF(Raw) [Horwitz | 0.573 | 0.531 | 0.410 | 0.717 | 0.585 | 0.424 | 0.564 | 0.493 | |||||||
| and Hoshen, 2023] 2023] | 0.563 | 0.164 | 0.525 | 0.546 | 0.342 | 0.549 0.219 | 0.546 | 0.699 | 0.425 | 0.409 | 0.448 0.668 | 0.268 | 0.528 | ||
| BTF(FPFH) [Horwitz and Hoshen, M3DM [Wang et al., 2023] | 0.671 0.357 | 0.609 0.564 | 0.560 0.754 | 0.739 | 0.423 | 0.427 | 0.737 | 0.439 | 0.510 0.476 | 0.317 | 0.518 0.657 | 0.663 | 0.663 | 0.552 | |
| PatchCore(FPFH) [Roth et al., 2022] | 0.388 | 0.494 | 0.753 | 0.766 | 0.455 | 0.423 | 0.721 | 0.449 | 0.506 | 0.417 | 0.693 | 0.662 | 0.660 | 0.568 | |
| PatchCore(PointMAE) [Roth et al., 2022] | 0.488 | 0.523 | 0.458 | 0.538 | 0.447 | 0.552 | 0.741 | 0.460 | 0.516 | 0.579 | 0.650 | 0.663 | 0.629 | 0.562 | |
| CPMF [Cao et al., 2024a] | 0.509 | 0.685 | 0.359 | 0.697 | 0.451 | 0.345 | 0.582 | 0.582 | 0.514 | 0.618 | 0.397 | 0.529 | 0.609 | 0.559 | |
| Reg3D-AD [Liu et al., 2024] | 0.414 | 0.688 | 0.676 | 0.641 | 0.533 | 0.702 | 0.605 | 0.650 | 0.500 | 0.520 | 0.462 | 0.620 | 0.594 | 0.572 | |
| IMRNet [Li et al., 2024] | 0.755 | 0.603 | 0.676 | 0.696 | 0.533 | 0.757 | 0.614 | 0.700 | 0.524 | 0.676 | 0.635 | 0.630 | 0.594 | 0.661 | |
| R3D-AD [Zhou et al., 2024] | 0.762 | 0.696 | 0.736 | 0.900 | 0.788 | 0.729 | 0.752 | 0.742 | 0.630 | 0.757 | 0.771 | 0.721 | 0.718 | 0.749 | |
| Template3D-AD | 1.000 | 0.736 | 0.708 | 0.844 | 0.940 | 0.829 | 1.000 | 0.856 | 0.817 | 1.000 | 1.000 | 0.961 | 0.864 | 0.865 | |
[Chang et al., 2015]. The number of points in each sample ranges from 8,000 to 30,000. Anomaly-ShapeNet contains 1,600 samples of 40 categories, and the training set of each category also contains 4 normal samples.
4.2 EvaluationMetrics
Area Under the Receiver Operator Curve (AUROC) is used to evaluate the anomaly detection performance of Template3DAD. Image-level AUROC (I-AUROC) is used to evaluate anomaly detection performance at the image level, while Point-level AUROC (P-AUROC) is at the point level. The value of AUROC ranges from 0 to 1.0, and the higher AUROC means better detection performance.
4.3 Implementation Details
In center point matching, the template point cloud and the test sample point cloud are downsampled based on the voxel grid, where the voxel unit size of the Real3D-AD dataset is set to 0.25 and that of the Anomaly-ShapeNet dataset is set to 0.05. Based on PFS, N = 4096 center points are sampled for each sample, and S = 128 nearest points are used as a local point group. In global feature extraction, pretrained PointMAE [Pang et al., 2022] is used as the feature extractor, which is pretrained on the ShapeNet dataset [Chang et al., 2015], and the output of the {3, 7, 11} layers are used as the global feature. In Curvature Aggregation, the curvature of each point is calculated based on kcur = 30 neighboring points. In local feature extraction, the FPFH feature of each center point is the statistics of kFPFH = 100 neighboring points. In global-local detection, the anomaly score of the non-center point is the mean of the kScore = 5 nearest center points. For each category, the first sample of the training set is used as the template.
4.4 Experiment Results
Anomaly Detection on Real3D-AD. In Table 1, the anomaly detection performance of the proposed Template3DAD is compared with the current state-of-the-art 3D anomaly detection methods on the Real3D-AD dataset. Template3DAD achieves the highest I-AUROC on 4 out of 12 categories, as well as the highest mean I-AUROC. Template3DAD uses both PointMAE features and FPFH features, which are often used in 3D anomaly detection, including M3DM, Reg3D-AD, IMRNet, PointCore, etc. Compared to the stateof-the-art PointMAE or FPFH based method (PointCore), Template3D-AD improves the mean I-AUROC by 1.5%. Template3D-AD further improves the performance of PointMAE and FPFH in the 3D anomaly detection task. Compared with other methods (diffusion-based R3D-AD), Template3DAD improves the mean I-AUROC by 11.0%. The comparison results show that Template3D-AD achieves the best performance on the Real3D-AD dataset.
Anomaly Detection on Anomaly-ShapeNet. Template3D-AD is further compared with the state-of-the-art 3D anomaly detection methods on the Anomaly-ShapeNet dataset, as shown in Table 2. Compared with the Real3D-AD dataset, the Anomaly-ShapeNet dataset contains more categories of 3D objects and defect types. Template3D-AD achieves the highest I-AUROC on 32 out of 40 categories, as well as the highest mean I-AUROC. In addition, Template3D-AD achieves 100% I-AUROC on multiple categories, including Ashtray0, Bottle0, Bowl0, V ase2, etc. Compared with the Real3D-AD dataset, Template3DAD has a greater improvement on the Anomaly-ShapeNet dataset. Compared to the state-of-the-art PointMAE or FPFH based method (IMRNet), Template3D-AD improves the mean I-AUROC by 19.5%. Compared with other methods (R3D-AD), Template3D-AD improves the mean I-AUROC by 11.6%. Template3D-AD achieves state-of-the-art performance on the Anomaly-ShapeNet dataset, further illustrating the effectiveness of Template3D-AD in the 3D anomaly detection task.
4.5 Ablation Study
This paper conducts ablation studies on the Real3D-AD dataset, which has more test samples in each category. This paper analyzes the impact of the number of center points, Curvature Aggregation, and global-local detection on the performance of Template3D-AD.
| Number of | Global | Local | Global-local | |||
|---|---|---|---|---|---|---|
| Center Points | I-AU | P-AU | I-AU | P-AU | I-AU | P-AU |
| 512 | 0.803 | 0.896 | 0.695 | 0.871 | 0.816 | 0.935 |
| 1024 | 0.808 | 0.893 | 0.731 | 0.889 | 0.833 | 0.938 |
| 2048 | 0.814 | 0.880 | 0.772 | 0.890 | 0.840 | 0.933 |
| 4096 | 0.818 | 0.866 | 0.785 | 0.879 | 0.844 | 0.925 |
Number of Center Points. Table 3 shows the global detection, local detection, and global-local detection performance of Template3D-AD based on different numbers of cen-
(a) Global I-AUROC (%).
(b) Global-local I-AUROC (%).
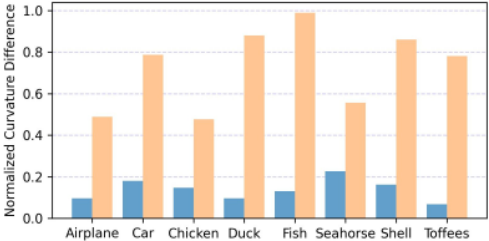
Figure 5: Curvature difference statistics between test sample center points and template center points on Real3D-AD dataset. The blue is the curvature difference between normal center points of test samples and the template, while the yellow is the curvature difference between abnormal center points of test samples and the template.
ter points. Using only 512 center points, Template3D-AD can still achieve 81.6% I-AUROC and 93.5% P-AUROC. As the number of center points increases, the I-AUROC of global detection, local detection, and global-local detection are all improved. Increasing the number of center points can sample more abnormal center points, which is beneficial for anomaly detection. Compared with global detection and local detection, global-local detection achieves higher I-AUROC and PAUROC, which illustrates the effectiveness of global-local detection. Specifically, global detection achieves the highest P-AUROC at 512 points, while local detection achieves the highest P-AUROC at 2048 points. On the Real3DAD dataset, the training samples contain the complete point cloud, while the testing samples only contain one side point cloud. As the number of center points increases, more edge points of test samples are sampled, which slightly affects the P-AUROC.
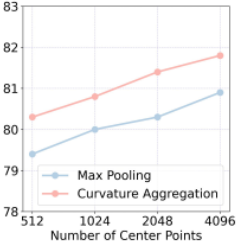
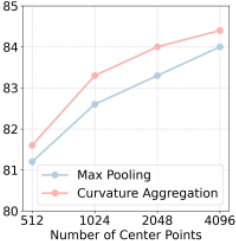
Curvature Aggregation. Figure 4 shows the global detection and global-local detection performance of Template3DAD based on max pooling or Curvature Aggregation. For different numbers of center points, Curvature Aggregation achieves higher I-AUROC in both global detection and global-local detection, and has a more obvious improvement in global detection. Curvature Aggregation based on 512 center points achieves the same global I-AUROC as max pooling based on 2048 center points. To further illustrate the necessity of introducing curvature in local feature representation, Figure 5 shows the curvature difference between the test sample center points and the template center points. For each category, there is a significant curvature difference between abnormal center points of the test sample and corresponding template center points, which shows that introducing curvature in the local feature representation is beneficial for anomaly detection. There is still a small curvature difference between the normal center point of the test sample and the template, which is caused by the fact that the test sample and the template are not perfectly matched.
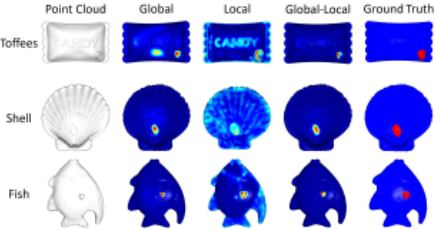
Global-local Detection. To further show the effectiveness of global-local detection, Figure 6 visualizes the global, local, and global-local detection results, where red represents high anomaly scores and blue represents low anomaly scores. Compared with global detection, local detection pays more attention to local shape details. For the Toffees sample, global detection has over-detection, while local detection can supplement global detection, which makes global-local detection have no over-detection. For the Shell sample, global detection detects anomalies while local detection does not, and global-local detection can still detect anomalies. Visualization results show that global-local detection can simultaneously utilize the advantages of global detection and local detection to achieve more effective detection.
4.6 Comparison of P-AUROC
| Method | I-AUROC | P-AUROC |
|---|---|---|
| BTF(Raw) [Horwitz and Hoshen, 2023] | 0.635 | 0.722 |
| BTF(FPFH) [Horwitz and Hoshen, 2023] | 0.603 | 0.566 |
| M3DM [Wang et al., 2023] | 0.552 | 0.637 |
| PatchCore(FPFH) [Roth et al., 2022] | 0.593 | 0.592 |
| PatchCore(FPFH+Raw) [Roth et al., 2022] | 0.682 | 0.692 |
| PatchCore(PointMAE) [Roth et al., 2022] | 0.594 | 0.634 |
| Reg3D-AD [Liu et al., 2024] | 0.704 | 0.700 |
| R3D-AD [Zhou et al., 2024] | 0.734 | 0.592 |
| PointCore [Zhao et al., 2024] | 0.829 | 0.731 |
| Template3D-AD | 0.844 | 0.925 |
For P-AUROC, this paper compares Template3D-AD with the state-of-the-art methods on the Real3D-AD dataset, as shown in Table 4. Compared with I-AUROC, Template3DAD has greater advantages in P-AUROC. Template3D-AD is the only method that achieves more than 90% P-AUROC, and is 19.4% higher than the second highest. The comparison results in Table 4 show that Template3D-AD can not only effectively detect anomalies, but also achieve effective segmentation of anomalous regions.
4.7 Inference Speed
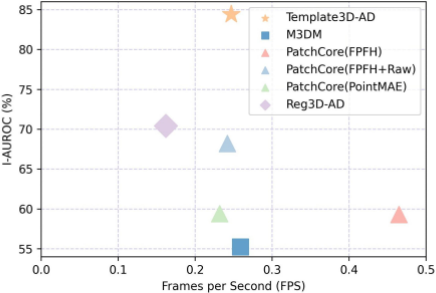
As shown in Figure 7, the inference speed of Template3DAD is compared with existing methods. Although PatchCore (FPFH) achieves the highest inference speed, I-AUROC is less than 60.0%, which makes it difficult to be applied in industry. The high speed of PatchCore (FPFH) is due to the fact that only FPFH features are used to construct the memory bank. Compared with PatchCore (FPFH+Raw), Template3DAD has a clear advantage in I-AUROC at similar inference speed, while compared with Reg3D-AD, Template3D-AD has advantages in both inference speed and I-AUROC. The comparison results show that Template3D-AD can achieve effective anomaly detection while ensuring the inference speed.
5 Conclusion
This paper proposes Template3D-AD, a 3D anomaly detection method based on template matching. Template3D-AD is the first template matching method for the 3D anomaly detection task, and only requires one normal sample to achieve effective anomaly detection. In this paper, point cloud template matching is defined as the matching of center points, and the global features and local features of the center points are used for global-local detection. Furthermore, considering the shape difference between normal and abnormal surfaces, Curvature Aggregation is proposed. Introducing curvature information into local feature representation improves the abnormal feature extraction ability of the pretrained model. Template3D-AD outperforms the state-of-the-art methods on the Real3D-AD and Anomaly-ShapeNet datasets, and provides a new solution for the 3D anomaly detection task.
Acknowledgments
This work was supported by the Fundamental Research Funds for the Central Universities (N25BSS022) and Ningxia Natural Science Foundation (2024AAC03349).
@inproceedings{ijcai2025p182,
  title     = {Template3D-AD: Point Cloud Template Matching Method Based on Center Points for 3D Anomaly Detection},
  author    = {Liu, Yi and Zhang, Changsheng and Yang, Yufei},
  booktitle = {Proceedings of the Thirty-Fourth International Joint Conference on
               Artificial Intelligence, {IJCAI-25}},
  publisher = {International Joint Conferences on Artificial Intelligence Organization},
  editor    = {James Kwok},
  pages     = {1630--1638},
  year      = {2025},
  month     = {8},
  note      = {Main Track},
  doi       = {10.24963/ijcai.2025/182},
  url       = {https://doi.org/10.24963/ijcai.2025/182},
}
TY - CPAPER TI - Template3D-AD: Point Cloud Template Matching Method Based on Center Points for 3D Anomaly Detection AU - Liu, Yi AU - Zhang, Changsheng AU - Yang, Yufei T2 - Proceedings of the Thirty-Fourth International Joint Conference on Artificial Intelligence, IJCAI-25 PB - International Joint Conferences on Artificial Intelligence Organization PY - 2025 SP - 1630 EP - 1638 DO - 10.24963/ijcai.2025/182 UR - https://doi.org/10.24963/ijcai.2025/182 ER -Copied
Machine-readable versions of this paper, for tools and AI agents:





