
OT-DETECTOR: Delving into Optimal Transport for Zero-shot Out-of-Distribution Detection
Proceedings of the Thirty-Fourth International Joint Conference on Artificial Intelligence. Main Track. Pages 1648-1656.
https://doi.org/10.24963/ijcai.2025/184
Keywords
- Computer Vision: CV: Recognition (object detection, categorization)
- Computer Vision: CV: Multimodal learning
- Computer Vision: CV: Vision, language and reasoning
- Machine Learning: ML: Trustworthy machine learning
Abstract
Out-of-distribution (OOD) detection is crucial for ensuring the reliability and safety of machine learning models in real-world applications. While zero-shot OOD detection, which requires no training on in-distribution (ID) data, has become feasible with the emergence of vision-language models like CLIP, existing methods primarily focus on semantic matching and fail to fully capture distributional discrepancies. To address these limitations, we propose OT-DETECTOR, a novel framework that employs Optimal Transport (OT) to quantify both semantic and distributional discrepancies between test samples and ID labels. Specifically, we introduce cross-modal transport mass and transport cost as semantic-wise and distribution-wise OOD scores, respectively, enabling more robust detection of OOD samples. Additionally, we present a semantic-aware content refinement (SaCR) module, which utilizes semantic cues from ID labels to amplify the distributional discrepancy between ID and hard OOD samples. Extensive experiments on several benchmarks demonstrate that OT-DETECTOR achieves state-of-the-art performance across various OOD detection tasks, particularly in challenging hard-OOD scenarios.
- [Arjovsky et al., 2017] Martín Arjovsky, Soumith Chintala, and Léon Bottou. Wasserstein generative adversarial net- works. In ICML, volume 70, pages 214-223, 2017.
- [Cao et al., 2024] Chentao Cao, Zhun Zhong, Zhanke Zhou, Yang Liu, Tongliang Liu, and Bo Han. Envisioning outlier exposure by large language models for out-of-distribution detection. In ICML, 2024.
- [Cimpoi et al., 2014] Mircea Cimpoi, Subhransu Maji, Ia- sonas Kokkinos, Sammy Mohamed, and Andrea Vedaldi. Describing textures in the wild. In CVPR, pages 3606- 3613, 2014.
- [Courty et al., 2017] Nicolas Courty, Rémi Flamary, Devis Tuia, and Alain Rakotomamonjy. Optimal transport for domain adaptation. IEEE Trans. Pattern Anal. Mach. In- tell., 39(9):1853-1865, 2017.
- [Cuturi, 2013] Marco Cuturi. Sinkhorn distances: Light- speed computation of optimal transport. In NIPS, pages 2292-2300, 2013.
- [Esmaeilpour et al., 2022] Sepideh Esmaeilpour, Bing Liu, Eric Robertson, and Lei Shu. Zero-shot out-of-distribution detection based on the pre-trained model CLIP. In AAAI, pages 6568-6576, 2022.
- [Fort et al., 2021] Stanislav Fort, Jie Ren, and Balaji Laksh- minarayanan. Exploring the limits of out-of-distribution detection. In NeurIPS, pages 7068-7081, 2021.
- [Fu et al., 2024] Yuqian Fu, Yu Wang, Yixuan Pan, Lian Huai, Xingyu Qiu, Zeyu Shangguan, Tong Liu, Yanwei Fu, Luc Van Gool, and Xingqun Jiang. Cross-domain few- shot object detection via enhanced open-set object detec- tor. In ECCV, pages 247-264, 2024.
- [Ge et al., 2021] Zheng Ge, Songtao Liu, Zeming Li, Osamu Yoshie, and Jian Sun. OTA: optimal transport assignment for object detection. In CVPR, pages 303-312, 2021.
- [Hendrycks and Gimpel, 2017] Dan Hendrycks and Kevin Gimpel. A baseline for detecting misclassified and out-of- distribution examples in neural networks. In ICLR, 2017.
- [Horn et al., 2018] Grant Van Horn, Oisin Mac Aodha, Yang Song, Yin Cui, Chen Sun, Alexander Shepard, Hartwig Adam, Pietro Perona, and Serge J. Belongie. The inatural- ist species classification and detection dataset. In CVPR, pages 8769-8778, 2018.
- [Huang et al., 2021] Rui Huang, Andrew Geng, and Yixuan Li. On the importance of gradients for detecting distribu- tional shifts in the wild. In NeurIPS, pages 677-689, 2021.
- [Jiang et al., 2024a] Xin Jiang, Hao Tang, Junyao Gao, Xi- aoyu Du, Shengfeng He, and Zechao Li. Delving into mul- timodal prompting for fine-grained visual classification. In AAAI, pages 2570-2578, 2024.
- [Jiang et al., 2024b] Xin Jiang, Hao Tang, and Zechao Li. Global meets local: Dual activation hashing network for large-scale fine-grained image retrieval. IEEE Transac- tions on Knowledge and Data Engineering, 2024.
- [Jiang et al., 2024c] Xin Jiang, Hao Tang, Rui Yan, Jinhui Tang, and Zechao Li. Dvf: Advancing robust and accurate fine-grained image retrieval with retrieval guidelines. In Proceedings of the 32nd ACM International Conference on Multimedia, pages 2379-2388, 2024.
- [Jiang et al., 2024d] Xue Jiang, Feng Liu, Zhen Fang, Hong Chen, Tongliang Liu, Feng Zheng, and Bo Han. Nega- tive label guided OOD detection with pretrained vision- language models. In ICLR, 2024.
- [Liu et al., 2020] Weitang Liu, Xiaoyun Wang, John D. Owens, and Yixuan Li. Energy-based out-of-distribution detection. In NeurIPS, 2020.
- [Lu et al., 2023] Fan Lu, Kai Zhu, Wei Zhai, Kecheng Zheng, and Yang Cao. Uncertainty-aware optimal trans- port for semantically coherent out-of-distribution detec- tion. In CVPR, pages 3282-3291, 2023.
- [Ming et al., 2022] Yifei Ming, Ziyang Cai, Jiuxiang Gu, Yiyou Sun, Wei Li, and Yixuan Li. Delving into out- of-distribution detection with vision-language representa- tions. In NeurIPS, 2022.
- [Miyai et al., 2023] Atsuyuki Miyai, Qing Yu, Go Irie, and Kiyoharu Aizawa. Zero-shot in-distribution detection in multi-object settings using vision-language foundation models, 2023.
- [Radford et al., 2021] Alec Radford, Jong Wook Kim, Chris Hallacy, Aditya Ramesh, Gabriel Goh, Sandhini Agar- wal, Girish Sastry, Amanda Askell, Pamela Mishkin, Jack Clark, Gretchen Krueger, and Ilya Sutskever. Learning transferable visual models from natural language supervi- sion. In ICML, volume 139, pages 8748-8763, 2021.
- [Ren et al., 2019] Jie Ren, Peter J. Liu, Emily Fertig, Jasper Snoek, Ryan Poplin, Mark A. DePristo, Joshua V. Dillon, and Balaji Lakshminarayanan. Likelihood ratios for out- of-distribution detection. In NeurIPS, pages 14680-14691, 2019.
- [Ren et al., 2024] Yilong Ren, Chuanwen Feng, Xike Xie, and S. Kevin Zhou. Partial optimal transport based out-of- distribution detection for open-set semi-supervised learn- ing. In IJCAI, pages 4851-4859, 2024.
- [Tack et al., 2020] Jihoon Tack, Sangwoo Mo, Jongheon Jeong, and Jinwoo Shin. CSI: novelty detection via con- trastive learning on distributionally shifted instances. In NeurIPS, 2020.
- [Tang et al., 2022] Hao Tang, Chengcheng Yuan, Zechao Li, and Jinhui Tang. Learning attention-guided pyramidal fea- tures for few-shot fine-grained recognition. Pattern Recog- nit., 130:108792, 2022.
- [Tang et al., 2023] Hao Tang, Jun Liu, Shuanglin Yan, Rui Yan, Zechao Li, and Jinhui Tang. M3net: Multi-view en- coding, matching, and fusion for few-shot fine-grained ac- tion recognition. In ACM Multimedia, pages 1719-1728, 2023.
- [Tang et al., 2025] Hao Tang, Zechao Li, Dong Zhang, Shengfeng He, and Jinhui Tang. Divide-and-conquer: Confluent triple-flow network for RGB-T salient object detection. IEEE Trans. Pattern Anal. Mach. Intell., 47(3):1958-1974, 2025.
- [Wang et al., 2023] Hualiang Wang, Yi Li, Huifeng Yao, and Xiaomeng Li. CLIPN for zero-shot OOD detection: Teaching CLIP to say no. In ICCV, pages 1802-1812, 2023.
- [Xiao et al., 2010] Jianxiong Xiao, James Hays, Krista A. Ehinger, Aude Oliva, and Antonio Torralba. SUN database: Large-scale scene recognition from abbey to zoo. In CVPR, pages 3485-3492, 2010.
- [Xiao et al., 2020] Zhisheng Xiao, Qing Yan, and Yali Amit. Likelihood regret: An out-of-distribution detection score for variational auto-encoder. In NeurIPS, 2020.
- [Yang et al., 2024] Jingkang Yang, Kaiyang Zhou, Yixuan Li, and Ziwei Liu. Generalized out-of-distribution detec- tion: A survey. Int. J. Comput. Vis., 132(12):5635-5662, 2024.
- [Zhou et al., 2018] Bolei Zhou, Àgata Lapedriza, Aditya Khosla, Aude Oliva, and Antonio Torralba. Places: A 10 million image database for scene recognition. IEEE Trans. Pattern Anal. Mach. Intell., 40(6):1452-1464, 2018.
References were extracted automatically from the PDF and may contain errors.
Full text extracted automatically from the PDF; figures, tables and equations may differ. The PDF is the version of record.
1 Introduction
Machine learning models are typically trained and evaluated under a closed-set setting, where they are expected to classify data from a predefined set of known classes [Tang et al., 2023; Tang et al., 2025]. However, in real-world scenarios, models are often faced with data from unknown classes [Fu et al., 2024], referred to as out-of-distribution (OOD) data. This situation is especially critical in high-stakes applications such as autonomous driving and medical diagnostics, where the failure to detect OOD data may lead to catastrophic outcomes. Therefore, accurately detecting OOD samples is essential for the safe and reliable deployment of machine learning models in practical settings [Ren et al., 2019; Tack et al., 2020; Xiao et al., 2020; Yang et al., 2024; Jiang et al., 2024a; Jiang et al., 2024b].
Recently, the emergence of Contrastive Language-Image Pre-training (CLIP) has introduced powerful recognition and generalization capabilities [Radford et al., 2021], thereby enabling various open-world recognition tasks. Building upon CLIP, several zero-shot OOD detection methods have been proposed. For example, ZOC [Esmaeilpour et al., 2022] combines visual and textual embeddings to identify OOD samples, and MCM [Ming et al., 2022] employs a scaled softmax function to match test images against in-distribution (ID) labels. Beyond these approaches, some methods incorporate external knowledge. CLIPN [Wang et al., 2023] pretrains an additional text encoder with a "no" logit to sharpen CLIP's OOD sensitivity, while NegLabel [Jiang et al., 2024d] leverages WordNet to mine negative labels that are semantically dissimilar to ID data. However, these negative labels may not effectively capture OOD samples sharing semantic overlap with ID classes. EOE [Cao et al., 2024] leverages large language models (LLMs) to generate potential OOD labels, but depending on LLMs can introduce privacy and computational concerns. Despite these advances, existing methods predominantly focus on semantic matching between test images and ID labels, inherently overlooking distributional discrepancies between ID and OOD samples. Moreover, the challenge of distinguishing hard OOD samples that are semantically similar to ID data remains largely unresolved. These gaps raise an important question: Can we simultaneously capture both semantic and distributional cues in an unified framework, without resorting to external knowledge?
To address this issue, we first draw upon the theory of Optimal Transport (OT), a mathematical framework commonly used to quantify discrepancies between probability distributions [Courty et al., 2017; Arjovsky et al., 2017]. OT has shown promise in settings where known and unlabeled samples coexist [Ren et al., 2024; Lu et al., 2023; Courty et al., 2017; Arjovsky et al., 2017; Ge et al., 2021; Ren et al., 2024; Lu et al., 2023; Jiang et al., 2024c], yet its application to zero-shot OOD detection is non-trivial, particularly due to the lack of ID image samples at inference. Fortunately, CLIP's vision-text alignment can mitigate this limitation: CLIP embeds relevant text-image pairs closely together in feature space. Motivated by this property, we propose using ID text labels as proxies for ID images. By measuring cosine distances between test images and textual ID labels, OT can naturally identify the closest label for each image. Concretely, we introduce the transport mass in OT to represent a semantic-wise score, and a distribution-wise score to measure the transport cost bridging the modality gap. By strategically combining these two components, we obtain an OT-based OOD score function that captures both semanticand distribution-level discrepancies.
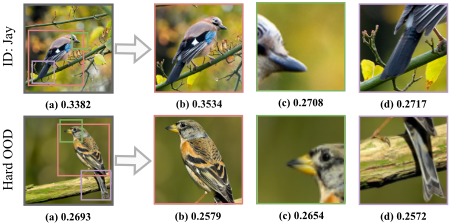
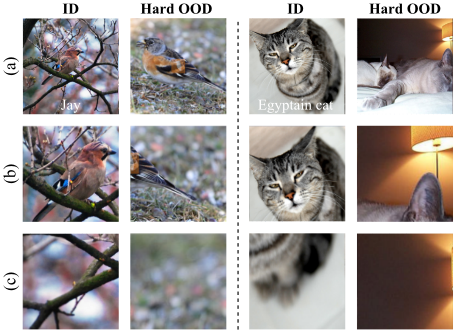
However, hard OOD samples that are semantically close to ID classes can still fool CLIP by sharing common backgrounds or object attributes [Jiang et al., 2024a]. As shown in Figure 1(b), removing ambiguous regions and emphasizing discriminative parts [Tang et al., 2022] can improve the separability between ID and such OOD samples. Conversely, shared regions (e.g., beaks, tails) lead to low similarity scores unless more fine-grained features are highlighted. To this end, we propose a parameter-free Semantic-aware Content Refinement (SaCR) module. For ID images, SaCR refines the visual content by retaining discriminative regions and better aligning features with their corresponding textual labels. For OOD samples, since OOD labels are unavailable, we use ID labels as a guide to select common regions. Consequently, shared regions remain less informative, inducing a feature shift that magnifies the distributional discrepancy between ID and hard OOD in the refined feature space.
By integrating SaCR with the proposed OT-based OOD score function, we develop a new zero-shot OOD detection framework named OT-DETECTOR. Experimental results on multiple benchmarks demonstrate that OT-DETECTOR achieves robust and reliable performance. In particular, on the ImageNet-1K OOD detection benchmark [Huang et al., 2021], OT-DETECTOR attains a FPR95 of 23.65% and AUROC of 94.49%, surpassing existing methods that rely on external knowledge. Notably, OT-DETECTOR excels in hard OOD scenarios, setting new state-of-the-art results. Our main contributions are summarized as follows:
- We introduce OT-DETECTOR, a novel zero-shot OOD detection framework that exploits implicit distributional discrepancies via Optimal Transport. To the best of our knowledge, this is the first work applying OT in the zeroshot OOD detection setting.
- We propose an OT-based OOD score function that captures both semantic-level and distribution-level discrepancies, as well as a parameter-free Semantic-aware Content Refinement module to further separate ID from hard OOD samples.
- Comprehensive experiments on large-scale and hard OOD benchmarks demonstrate the effectiveness of our approach, establishing new state-of-the-art performance in zero-shot OOD detection.
2 Preliminaries
2.1 Contrastive Language-Image Pre-training
CLIP [Radford et al., 2021] is a multimodal model that leverages a contrastive loss to align textual and visual representations, demonstrating exceptional generalization capabilities. The model consists of a text encoder T : u ↦→ Rd and an image encoder I : x ↦→ Rd , where u is a text sequence and x is an image. In zero-shot classification tasks, given an input image x and a set of class labels Y = {yi}Ki=1 , each label is first embedded into a prompt template (e.g., "a photo of a [CLASS]"), producing a textual input for the text encoder. Formally:
where prompt(·) is an operation that inserts the class label into a predefined textual template. Finally, the predicted label ˆ y for the image is determined by selecting the class label whose corresponding text feature has the highest cosine similarity with the image feature:
This zero-shot inference mechanism allows CLIP to generalize to novel classes not seen during training, relying solely on natural language descriptions.
2.2 Zero-shot OODDetection with CLIP
Zero-shot OOD detection aims to distinguish out-ofdistribution (OOD) samples from in-distribution (ID) samples without requiring access to labeled ID training data, leveraging the powerful generalization capabilities of CLIP. The objective is to construct a binary classifier:
where x is an input image sampled from the input space X = Xid ∪ Xood, with Xid and Xood denoting sets of ID and OOD samples, respectively. The set Yid denotes the ID class labels, and λ is a threshold that determines whether a sample is classified as ID or OOD. The OOD score function S, as proposed in existing works [Ming et al., 2022; Wang et al., 2023], is computed based on the cosine similarity between visual and textual features derived from Eq. (1).
2.3 Optimal Transport
Optimal Transport (OT) focuses on finding the minimum transportation distance required to transfer one distribution to another, such as the Wasserstein distance. This makes it a powerful tool for solving distribution matching problems across various tasks. Here, we introduce OT for discrete empirical distributions.
Consider two sets, X with supply samples {xi}ni=1 and Y with demand samples {yj}mj=1 , represented by the empirical distributions:
where δxi is the Dirac delta measure centered at xi. The terms pi and qj represent the probability masses associated with the samples, satisfying ∑ni=1 pi = 1 and ∑mj=1 qj = 1. The minimum transport distance can be determined as follows:
where
denotes the transportation polytope of µ and ν. Here, 1n and 1m are all-one vectors of appropriate dimensions. The cost matrix C ∈ Rn×m defines the transport cost between supply and demand samples, where each entry corresponds to a chosen metric such as Euclidean or Mahalanobis distance.
To enhance numerical stability and optimization convergence, Cuturi [Cuturi, 2013] introduced an entropic regularization termH(P), reformulating the objective as:
where ϵ > 0 is the regularization hyperparameter, and
The resulting assignment matrix can be expressed as:
where a and b are non-negative vectors defined up to a multiplicative factor and can be efficiently computed using Sinkhorn's algorithm [Cuturi, 2013]. The OT methodology used in our work is based on the above approach and will be further detailed in the following section.
3 Method
In this paper, we introduce Optimal Transport (OT) to improve the performance of zero-shot OOD detection. However, two key challenges need to be addressed:
- Identifying hard OOD samples that exhibit high semantic and distributional similarity to ID samples, making them particularly difficult to detect;
- Quantify distributional discrepancies between ID and OOD samples and transform them into effective OOD detection scores.
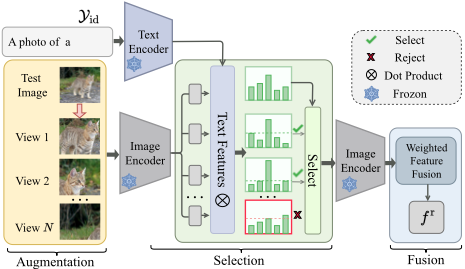
To tackle the first challenge, we propose a Semantic-aware Content Refinement (SaCR) module, which consists of three steps to adaptively refine both hard OOD and ID samples, as illustrated in Figure 2. By enhancing the distinguishability of refined features, SaCR aims to amplify the distributional discrepancies between ID and OOD samples.
Algorithm 1: Semantic-aware Content Refinement
Input : Input image x, ID labels Yid, Image encoder I, Text encoder T , Confidence function M, Top-k selection parameter k, Number of views N Output: Refined feature f r 1 Xv ← RandomCrop(x, N) // Generate N views 2 for yi ∈ Yid do 3 f text i ← T (prompt(yi)) // Encode label yi 4 ˆ y ← arg max yi∈Yid cos (I(x), f text i ) // Predict label ˆ y 5 Xf ← ∅, M f ← ∅ 6 for xvi ∈ Xv do 7 f img i ← I(xvi ) // Encode view xvi 8 ˆ yv i ← argmax yj ∈Yid cos (f img i , f text j ) // Assign label to view xvi 9 if ˆ yv i = ˆ y then 10 Xf ← Xf ∪ {xvi } 11 M f ←M f ∪ {M(xvi )} 12 inds ←Top-K(M f , k) // Select top-k views
13 f r ← ∑i∈inds M(xvi ) · I(xvi )
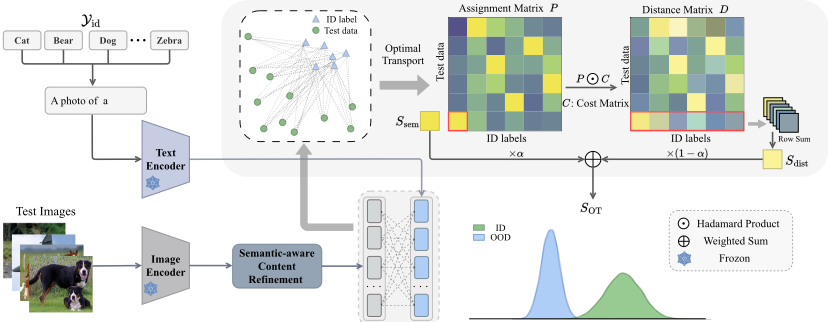
For the second challenge, we leverage OT to convert the semantic and distributional relationships between test samples and ID label space into an OOD detection score. Specifically, we incorporate two complementary components: a Semanticwise OOD Score and a Distribution-wise OOD Score. As shown in Figure 3, we combine these two scores to develop a novel OOD detection framework, termed OT-DETECTOR, enabling reliable zero-shot OOD detection without requiring additional ID data or outlier class labels.
3.1 Semantic-aware Content Refinement
Motivation. Hard OOD samples typically exhibit similar background or object attributes to their corresponding ID samples, which confuse CLIP and result in high OOD scores for these hard OOD samples. To mitigate this, we propose a Semantic-aware Content Refinement (SaCR) module, which adaptively refines the visual content of both ID and hard OOD
samples guided by the ID label semantics, producing more discriminative visual features. By amplifying the distributional discrepancy between ID and hard OOD samples, SaCR makes it easier for the subsequent OT-based score functions to identify hard OOD samples.
View Augmentation. We start by generating multiple views of an input image to capture diverse visual information. Specifically, given a test image x and the ID label space Yid, we apply random cropping at various scales to yield a set of candidate views, Xv = {xvi }Ni=1 . This multi-view strategy aims to explore different local regions of x and provide a broader range of features.
View Selection. Not all views are equally relevant, some may primarily contain background or only partial object regions. We therefore discard views with predictions inconsistent with that of the original image x. Since ground-truth labels are unavailable under the zero-shot setting, we use the semantic concept of x as weak supervision. Let ˆ y be the predicted label for x, and ˆ Y v = {yv i }Ni=1 be the predicted labels for Xv . Both ˆ y and ˆ Y v are obtained via Eqs. (1) and (2) with Yid. We retain only the views whose predicted labels match ˆ y, forming a refined set:
Next, to further select the most confident views, we define a margin function M(·) based on the cosine similarity logits from CLIP. For an image x, let logits(x) be the sorted similarity scores (logits) over the ID labels. Then the margin M(x) is the difference between the largest and the second-largest logit, i.e., M(x) = max logits(x) - 2ndmax logits(x). We compute M(xfi ) for each view xfi ∈ Xf , rank them in descending order, and choose the top-k:
Here, Top-k(·) returns the indices of the k highest margin values, and N ′ ≤ N is the number of remaining views after the label-consistency filter.
ViewFusion. Finally, we fuse the selected views into a single, refined feature. Each view is first encoded by the CLIP image encoder I(·), then weighted by its margin score and summed:
where norm(·) denotes L2 normalization along the feature dimension. A step-by-step summary of this procedure is outlined in Algorithm 1.
3.2 ANewOODDetection Score
Motivation. Empirically, OOD and ID data often occupy distinct regions in the embedding space. This observation motivates us to leverage Optimal Transport (OT) to quantify this distributional discrepancy and design an effective OOD score. Since direct interaction between ID and OOD samples is not feasible, we employ ID label features as a bridge and use OT to measure the distributional difference between test samples and these label features. Specifically, we propose two complementary OT-based scores in our OT-DETECTOR, which consider both sample-level and distribution-level discrepancies:
- Semantic-wise OOD Score: OT assigns larger transport mass to supply samples that are closer to demand samples. Hence, the mass transported from a test sample to an ID label can reflect their semantic similarity. For OOD samples that tend to be far from all ID labels, this transported mass will be relatively small.
- Distribution-wiseOODScore: Considering themodality gap between textual and visual features, we further identify OOD samples by assessing the cost required for a test sample to "bridge" this gap to the ID label feature space. This cost, derived from the OT distance, indicates the distributional discrepancy.
OT Formulation. Let the test set be X = {xi}|X| i=1 and the refined visual features (from the Semantic-aware Content Refinement module in Section 3.1) be F r = {f r i }|X | i=1 ∈ R|X|×d , where |X| denotes the number of test samples, and d is the feature dimension. Meanwhile, we denote the CLIP textual features for all ID labels by F text = {f text j }Kj=1 ∈ RK×d , where K is the number of ID class labels. We assume unknown priors and define the discrete measures:
| Method | iNaturalist | SUN | OOD Dataset Places | Texture | Average | |||||
|---|---|---|---|---|---|---|---|---|---|---|
| FPR95↓ | AUROC↑ | FPR95↓ | AUROC↑ | FPR95↓ | AUROC↑ | FPR95↓ | AUROC↑ | FPR95↓ | AUROC↑ | |
| MSP [Hendrycks and Gimpel, 2017] | 40.89 | 88.63 | 65.81 | 81.24 | 67.90 | 80.14 | 64.96 | 78.16 | 59.89 | 82.04 |
| Energy [Liu et al., 2020] | 21.59 | 95.99 | 34.28 | 93.15 | 36.64 | 91.82 | 51.18 | 88.09 | 35.92 | 92.26 |
| Fort et al. [Fort et al., 2021] | 15.07 | 96.64 | 54.12 | 86.37 | 57.99 | 85.24 | 53.32 | 84.77 | 45.12 | 88.25 |
| CLIPN [Wang et al., 2023] | 19.13 | 96.20 | 25.69 | 94.18 | 32.14 | 92.26 | 44.60 | 88.93 | 30.39 | 92.89 |
| MCM [Ming et al., 2022] | 30.91 | 94.61 | 37.59 | 92.57 | 44.69 | 89.77 | 57.77 | 86.11 | 42.74 | 90.77 |
| GL-MCM [Miyai et al., 2023] | 15.18 | 96.71 | 30.42 | 93.09 | 38.85 | 89.90 | 57.93 | 83.63 | 35.47 | 90.83 |
| EOE [Cao et al., 2024] | 12.29 | 97.52 | 20.40 | 95.73 | 30.16 | 92.95 | 57.53 | 85.64 | 30.09 | 92.96 |
| NegLabel [Jiang et al., 2024d] | 1.91 | 99.49 | 20.53 | 95.49 | 35.59 | 91.64 | 43.56 | 90.22 | 25.40 | 94.21 |
| OT-DETECTOR (Ours) | 7.91 | 98.16 | 16.18 | 96.15 | 27.43 | 93.30 | 43.07 | 90.34 | 23.65 | 94.49 |
with pi = 1 |X| and qj = 1K . To construct the cost matrix C ∈ R|X|×K , we adopt the cosine distance since CLIP is pretrained with a contrastive objective that aligns visual and textual representations, i.e., C = 1 - F r (F text )⊤. We then solve the following entropic regularized OT problem:
where H(P) is the entropic regularization term, ϵ > 0 is the regularization parameter, and P ∗ ∈ R|X|×K denotes the optimal transport plan.
Semantic-wise OOD Score. The assignment matrix P ∗ maps |X| test samples to K ID labels, capturing the transport mass from each test sample xi to every ID label. We quantify the semantic alignment by focusing on the largest transport mass for each sample. Formally, the semantic-wise score is
Intuitively, higher mass indicates stronger alignment with at least one ID label.
Distribution-wise OOD Score. The Wasserstein distance, ∑i,j p∗ij cij , reflects the overall distributional discrepancy between test samples and ID labels. We decompose it to isolate the portion that corresponds to each test sample xi, defining the distribution-wise score as
Here, cij is the entry of the cost matrix C, and for OOD samples, bridging the gap to the ID label space typically incurs a larger cost, leading to a lower Sdist.
Final OT-based OOD Score Function. We combine these two score functions in our OT-DETECTOR to effectively capture both semantic alignment and distributional discrepancy:
where α ∈ [0, 1] balances the contributions of Ssem and Sdist.
4 Experiments
4.1 Experiments Setup
Datasets. Following the previous work [Ming et al., 2022], we evaluate our method on the ImageNet-1K OOD benchmark to ensure comparability with other methods. The ImageNet-1K OOD benchmark uses ImageNet-1K as the ID data and considers Texture [Cimpoi et al., 2014], iNaturalist [Horn et al., 2018], SUN [Xiao et al., 2010], and Places365 [Zhou et al., 2018] as OOD data. Additionally, we perform hard OOD analysis using semantically similar subsets of ImageNet constructed byMCM, i.e., ImageNet-10, ImageNet-20, and ImageNet-100, which show high semantic similarity.
Evaluation Metrics. We evaluate our method using two standard metrics:(1) FPR95: the false positive rate of OOD samples when the true positive rate of ID samples is at 95%; (2) AUROC: the area under the receiver operating characteristic curve.
ImplementationDetails. We utilize CLIP as the pretrained model, widely adopted in previous works. Specifically, we employ CLIP-B/16, comprising a ViT-B/16 image encoder and a masked self-attention Transformer text encoder, with weights from OpenAI's open-source models. For view augmentation, N = 256 randomly cropped images are generated, and the Top-k = 20 crop features are selected for fusion. In the OT component, we fix ϵ = 90 for entropic regularization and dynamically determine the optimal α for each OOD dataset. Since this work does not focus on textual modality, we use a standard prompt, "a photo of a [CLASS]," for all experiments.
Compared Methods. We compare our method with stateof-the-art OOD detection methods, including zero-shot methods and those requiring fine-tuning or auxiliary OOD labels. For a fair comparison, all methods are implemented using CLIP-B/16 as their backbone, consistent with our OTDETECTOR. For methods requiring pre-training or finetuning, we condider MSP [Hendrycks and Gimpel, 2017], Energy [Liu et al., 2020], CLIPN [Wang et al., 2023], and the method proposed in [Fort et al., 2021]. Among zeroshot methods, we compare against MCM [Ming et al., 2022] and GL-MCM [Miyai et al., 2023]. Additionally, we evaluate our OT-DETECTOR against recently proposed representative methods, including EOE [Cao et al., 2024] and NegLabel [Jiang et al., 2024d]. Notably, CLIPN relies on a large-scale auxiliary dataset, NegLabel leverages a large corpus database, and EOE depends on large language models. In contrast, our OT-DETECTOR operates without requiring any auxiliary datasets or candidate OOD labels.
| Method | ID OOD | ImageNet-10 ImageNet-20 | ImageNet-20 ImageNet-10 | ImageNet-10 ImageNet-100 | ImageNet-100 ImageNet-10 | Average | |||||
|---|---|---|---|---|---|---|---|---|---|---|---|
| FPR95↓ | AUROC↑ | FPR95↓ | AUROC↑ | FPR95↓ | AUROC↑ | FPR95↓ | AUROC↑ | FPR95↓ | AUROC↑ | ||
| Energy [Liu et al., 2020] | 10.20 | 97.94 | 18.88 | 97.15 | 5.65 | 98.90 63.51 | 87.66 | 24.56 | 95.41 | ||
| MCM [Ming et al., 2022] | 5.00 | 98.71 | 16.99 | 97.69 | 2.29 | 99.31 | 66.37 | 86.45 | 22.66 | 95.54 | |
| EOE [Cao et al., 2024] | 4.20 | 99.09 | 15.85 | 97.74 | 5.13 | 98.85 | 68.71 | 85.62 | 23.47 | 95.33 | |
| NegLabel [Jiang et al., 2024d] | 5.10 | 98.86 | 4.60 | 98.81 | 1.68 | 99.51 | 40.20 | 90.19 | 12.90 | 96.84 | |
| OT-DETECTOR (Ours) | 2.50 | 99.17 | 3.78 | 99.14 | 3.06 | 99.17 | 22.60 | 96.15 | 7.98 | 98.41 | |
| SaCR | Score Ssem | Functions Sdist | FPR95↓ | AUROC↑ |
|---|---|---|---|---|
| ✗ | ✗ | ✗ | 42.74 | 90.77 |
| ✗ | ✓ | ✗ | 31.30 | 92.07 |
| ✗ | ✗ | ✓ | 43.76 | 90.94 |
| ✗ | ✓ | ✓ | 29.54 | 92.92 |
| ✓ | ✗ | ✗ | 38.67 | 91.31 |
| ✓ | ✓ | ✗ | 27.88 | 93.28 |
| ✓ | ✗ | ✓ | 29.25 | 93.74 |
| ✓ | ✓ | ✓ | 23.65 | 94.49 |
4.2 Main Results
Evaluation on ImageNet-1K Benchmark. Table 1 shows the performance of our method on the large-scale ImageNet1K dataset as ID data, evaluated against four OOD datasets: iNaturalist, SUN, Places, and Texture. Our method achieves state-of-the-art (SOTA) performance, with an average FPR95 of 23.65% and AUROC of 94.49%. Notably, it significantly outperforms recently proposed EOE and NegLabel.
Evaluation on Hard OOD Detection Tasks. Table 2 presents the experimental result of our method on hard OOD detection tasks. OT-DETECTOR consistently demonstrates superior results across all four tasks. Specifically, when ImageNet-100 is used as ID data and ImageNet-10 as OOD data, our method achieves 43.78% improvement in FPR95 and 6.61% improvement in AUROC compared to NegLabel, without requiring access to potential outlier OOD labels. Finally, our method achieves an average FPR95 of 7.98% and AUROC of 98.41% on hard OOD tasks. These results highlight the outstanding effectiveness of OT-DETECTOR in tackling challenging OOD detection scenarios.
4.3 Ablation Study
Table 3 analyzes the key components of OT-DETECTOR. Initially, MCM [Ming et al., 2022] serves as our baseline when no additional modules are applied.
OT-based Score Functions. Comparing the first and second rows of Table 3, we observe that using only the semanticwise score Ssem notably outperforms the baseline, indicating that the transport mass from the assignment matrix effectively captures semantic discrepancy crucial for identifying OOD samples. In contrast, comparing the first and third rows shows that the distribution-wise score Sdist alone achieves an FPR95
of 43.76%, performing on par with the baseline. This suggests that Sdist primarily captures global distributional discrepancy. However, combining Sdist with Ssem fully leverages their complementary strengths, resulting in a 30.88% improvement in FPR95 and a 2.37% increase in AUROC over the baseline.
Semantic-aware Content Refinement. Comparing the first and fifth rows, as well as the second and fifth rows, shows that SaCR provides moderate improvements when using semantic-based scores. More notably, comparing the third and seventh rows highlights a substantial enhancement in Sdist with SaCR, yielding a 33.16% reduction in FPR95 and a 2.99% increase in AUROC. This finding indicates that SaCR introduces distributional shifts that make ID and OOD samples more distinguishable, thereby enabling our OOD score to more effectively capture these differences and enhancing the discriminative power of Sdist. Finally, comparing the fourth and last rows shows that applying SaCR to the OT-based OOD score yields a further 19.94% reduction in FPR95 and a 1.66% increase in AUROC. These results confirm the effectiveness of SaCR in our OT-DETECTOR, significantly boosting OOD detection performance.
4.4 Sensitivity Analysis
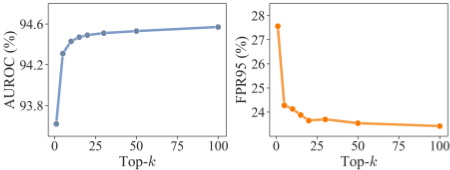
Top-k in Eq. 10. Figure 4 shows the effect of varying Topk (i.e., k ∈ {1, 5, 10, 15, 20, 30, 50, 100}) on the performance of our SaCR module. After filtering views for semantic consistency, SaCR selects the top-k views based on their confidence scores for fusion. Since higher-confidence views typically contain more informative content, they are prioritized for feature refinement. As presented in Figure 4, the largest performance gain occurs at k = 100. But increasing k introduces additional views of lower confidence, resulting in only marginal changes to the fused features. To balance between capturing sufficiently informative views and avoiding redundancy, we set k = 20 by default.
| α | iNaturalist | SUN | Places | Texture | ||||
|---|---|---|---|---|---|---|---|---|
| FPR95↓ | AUROC↑ | FPR95↓ | AUROC↑ | FPR95↓ | AUROC↑ | FPR95↓ | AUROC↑ | |
| 0 | 10.45 | 97.68 | 18.45 | 95.94 | 27.43 | 93.30 | 60.67 | 88.06 |
| 0.1 | 8.65 | 97.95 | 16.65 | 96.11 | 27.37 | 93.21 | 54.40 | 89.12 |
| 0.2 | 8.10 | 98.09 | 16.18 | 96.15 | 27.44 | 92.98 | 49.27 | 89.75 |
| 0.3 | 7.91 | 98.16 | 16.47 | 96.11 | 28.28 | 92.68 | 46.81 | 90.09 |
| 0.4 | 8.05 | 98.18 | 17.00 | 96.01 | 29.22 | 92.35 | 44.73 | 90.27 |
| 0.5 | 8.22 | 98.17 | 17.83 | 95.89 | 30.31 | 92.00 | 43.95 | 90.34 |
| 0.6 | 8.53 | 98.13 | 18.63 | 95.74 | 31.28 | 91.65 | 43.07 | 90.34 |
| 0.7 | 8.84 | 98.08 | 19.35 | 95.57 | 32.60 | 91.31 | 42.85 | 90.30 |
| 0.8 | 9.25 | 98.01 | 20.23 | 95.38 | 33.75 | 90.97 | 42.77 | 90.23 |
| 0.9 | 9.79 | 97.92 | 21.20 | 95.19 | 34.74 | 90.63 | 43.05 | 90.14 |
| 1 | 10.44 | 97.82 | 22.07 | 94.98 | 35.83 | 90.30 | 43.19 | 90.03 |
Hyper-parameter α in Eq. 17. Table 4 provides a detailed analysis of α values ranging from 0 to 1 in increments of 0.1. We can see that incorporating both scores with a proper balance consistently yields better performance, as dataset statistics can vary substantially and thus favor different scoring components. For the SUN and Places datasets, the distribution-wise score (α = 0) surpasses the semanticwise score (α = 1). In contrast, on the Texture dataset, using only the distribution-wise score performs poorly. Introducing the semantic-wise component (α > 0) notably improves FPR95 by 29.01%, suggesting that the large semantic gap between texture images and ImageNet-1K classes benefits significantly from semantic alignment. These observations demonstrate that our score function can adapt effectively to various dataset characteristics by appropriately tuning α.
4.5 Visualization
Case Visualization. Figure 5 illustrates two pairs of ID and hard OOD samples, with ImageNet-100 as the ID dataset and ImageNet-10 as the OOD dataset. Specifically, Figure 5(a) presents the original test images, Figure 5(b) shows the views with the highest confidence selected by SaCR, and Figure 5(c) highlights views with low margins due to insufficient semantic information. For the ID image, SaCR effectively selects views that emphasize the object while eliminating irrelevant background details. In contrast, the hard OOD image in the second column of Figure 5(a) is initially misclassified by CLIP as the "jay" class, and then SaCR selects views focusing on the object parts most resembling the "jay" concept, specifically the bird's tail, as depicted in the second image of Figure 5(b). As a result, the fused features of the ID and hard OOD samples become significantly more distinct, enhancing their distributional discrepancy. Through this refinement, SaCR automatically identifies relevant parts of the hard OOD samples, thereby amplifying the gap between ID and hard OOD samples. This enhanced separation is then captured by the OT-based OOD score function, which leads to improved detection of hard OOD samples.
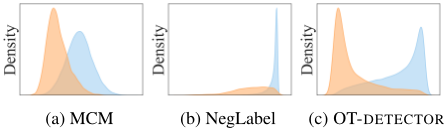
Score Distribution. Figure 6 presents the density plots of ID and OOD scores for MCM [Ming et al., 2022], NegLabel [Jiang et al., 2024d], and OT-DETECTOR, using the ImageNet-1K dataset as ID data and the Places dataset as OOD data. In Figure 6(a), MCM exhibits a bimodal distribution for both ID and OOD scores. However, a significant overlap exists between the two distributions, making it difficult to determine a suitable threshold for effectively distinguishing OOD data from ID data. Figure 6(b) shows the score distribution for NegLabel. The introduction of numerous negative labels causes ID scores to cluster at higher values due to the negative mining process, which relies on words that are semantically dissimilar to ID labels. However, when OOD images share certain semantic similarity with ID data, the mined negative labels fail to match well, resulting in high confidence scores for many OOD samples. In contrast, Figure 6(c) illustrates the density plot for OT-DETECTOR, revealing a clear bimodal distribution with substantially reduced overlap between ID and OOD scores relative to MCM. This distinct separation of distributions enables more effective threshold selection, thereby leading to superior OOD detection performance by OT-DETECTOR.
5 Conclusion
In this paper, we presented a novel and effective framework for zero-shot OOD detection, termed OT-DETECTOR, by incorporating Optimal Transport to quantify semantic and distributional discrepancies. Building upon this foundation, we devised an OT-based OOD score function that integrates both semantic and distributional scores. Furthermore, to tackle the challenge of hard OOD detection without relying on external knowledge, we introduced a semantic-aware content refinement module, which adaptively amplifies the distinction between ID and hard OOD samples. Extensive experiments demonstrate that OT-DETECTOR achieves state-of-the-art results across various zero-shot detection benchmarks and excels in detecting hard OOD samples.
Acknowledgments
This work was supported by National Natural Science Foundation of China (Grant No. 62425603), Basic Research Program of Jiangsu Province (Grant No. BK20243018), and a grant of Innovation and Technology Fund under Innovation and Technology Commission (project no. ITS/202/23). Zechao Li is the corresponding author.
@inproceedings{ijcai2025p184,
  title     = {OT-DETECTOR: Delving into Optimal Transport for Zero-shot Out-of-Distribution Detection},
  author    = {Liu, Yu and Tang, Hao and Zhang, Haiqi and Qin, Jing and Li, Zechao},
  booktitle = {Proceedings of the Thirty-Fourth International Joint Conference on
               Artificial Intelligence, {IJCAI-25}},
  publisher = {International Joint Conferences on Artificial Intelligence Organization},
  editor    = {James Kwok},
  pages     = {1648--1656},
  year      = {2025},
  month     = {8},
  note      = {Main Track},
  doi       = {10.24963/ijcai.2025/184},
  url       = {https://doi.org/10.24963/ijcai.2025/184},
}
TY - CPAPER TI - OT-DETECTOR: Delving into Optimal Transport for Zero-shot Out-of-Distribution Detection AU - Liu, Yu AU - Tang, Hao AU - Zhang, Haiqi AU - Qin, Jing AU - Li, Zechao T2 - Proceedings of the Thirty-Fourth International Joint Conference on Artificial Intelligence, IJCAI-25 PB - International Joint Conferences on Artificial Intelligence Organization PY - 2025 SP - 1648 EP - 1656 DO - 10.24963/ijcai.2025/184 UR - https://doi.org/10.24963/ijcai.2025/184 ER -Copied
Machine-readable versions of this paper, for tools and AI agents:





