
Multimodal Cancer Survival Analysis via Hypergraph Learning with Cross-Modality Rebalance
Proceedings of the Thirty-Fourth International Joint Conference on Artificial Intelligence. Main Track. Pages 1802-1810.
https://doi.org/10.24963/ijcai.2025/201
Keywords
- Computer Vision: CV: Multimodal learning
- Computer Vision: CV: Biomedical image analysis
Abstract
Multimodal pathology-genomic analysis has become increasingly prominent in cancer survival prediction. However, existing studies mainly utilize multi-instance learning to aggregate patch-level features, neglecting the information loss of contextual and hierarchical details within pathology images. Furthermore, the disparity in data granularity and dimensionality between pathology and genomics leads to a significant modality imbalance. The high spatial resolution inherent in pathology data renders it a dominant role while overshadowing genomics in multimodal integration. In this paper, we propose a multimodal survival prediction framework that incorporates hypergraph learning to effectively capture both contextual and hierarchical details from pathology images. Moreover, it employs a modality rebalance mechanism and an interactive alignment fusion strategy to dynamically reweight the contributions of the two modalities, thereby mitigating the pathology-genomics imbalance. Quantitative and qualitative experiments are conducted on five TCGA datasets, demonstrating that our model outperforms advanced methods by over 3.4% in C-Index performance. Code: https://github.com/MCPathology/MRePath.
- [Adnan et al., 2020] Mohammed Adnan, Shivam Kalra, and Hamid R Tizhoosh. Representation learning of histopathology images using graph neural networks. In CVPR Workshops, pages 988-989, 2020.
- [Andre et al., 2022] Fabrice Andre, Thomas Filleron, Maud Kamal, et al. Genomics to select treatment for patients with metastatic breast cancer. Nature, 610(7931):343-348, 2022.
- [Campanella et al., 2019] Gabriele Campanella, Matthew G Hanna, Luke Geneslaw, et al. Clinical-grade computa- tional pathology using weakly supervised deep learning on whole slide images. Nature medicine, 25(8):1301-1309, 2019.
- [Cao et al., 2024] Bing Cao, Yinan Xia, Yi Ding, Changqing Zhang, and Qinghua Hu. Predictive dynamic fusion. In ICML, 2024.
- [Chan et al., 2023] Tsai Hor Chan, Fernando Julio Cendra, Lan Ma, Guosheng Yin, and Lequan Yu. Histopathology whole slide image analysis with heterogeneous graph rep- resentation learning. In CVPR, pages 15661-15670, 2023.
- [Cheerla and Gevaert, 2019] Anika Cheerla and Olivier Gevaert. Deep learning with multimodal representation for pancancer prognosis prediction. Bioinformatics, 35(14):i446-i454, 2019.
- [Chen et al., 2020] Richard J Chen, Ming Y Lu, Jingwen Wang, et al. Pathomic fusion: an integrated framework for fusing histopathology and genomic features for cancer diagnosis and prognosis. IEEE Transactions on Medical Imaging, 41(4):757-770, 2020.
- [Chen et al., 2021a] Richard J Chen, Ming Y Lu, Muham- mad Shaban, et al. Whole slide images are 2d point clouds: Context-aware survival prediction using patch- based graph convolutional networks. In MICCAI, pages 339-349. Springer, 2021.
- [Chen et al., 2021b] Richard J. Chen, Ming Y. Lu, Wei-Hung Weng, et al. Multimodal co-attention transformer for sur- vival prediction in gigapixel whole slide images. In ICCV, pages 3995-4005, 2021.
- [Chen et al., 2022] Richard J Chen, Ming Y Lu, Drew FK Williamson, et al. Pan-cancer integrative histology- genomic analysis via multimodal deep learning. Cancer Cell, 40(8):865-878, 2022.
- [Chen et al., 2024] Richard J Chen, Tong Ding, Ming Y Lu, Drew FK Williamson, et al. Towards a general-purpose foundation model for computational pathology. Nature Medicine, 30(3):850-862, 2024.
- [Corbière et al., 2019] Charles Corbière, Nicolas Thome, Avner Bar-Hen, Matthieu Cord, and Patrick Pérez. Ad- dressing failure prediction by learning model confidence. NeurIPS, 32, 2019.
- [Di et al., 2022a] Donglin Di, Jun Zhang, Fuqiang Lei, Qi Tian, and Yue Gao. Big-hypergraph factorization neu- ral network for survival prediction from whole slide image. IEEE Transactions on Image Processing, 31:1149-1160, 2022.
- [Di et al., 2022b] Donglin Di, Changqing Zou, Yifan Feng, Haiyan Zhou, Rongrong Ji, Qionghai Dai, and Yue Gao. Generating hypergraph-based high-order representations of whole-slide histopathological images for survival pre- diction. IEEE Transactions on Pattern Analysis and Ma- chine Intelligence, 45(5):5800-5815, 2022.
- [Dietterich et al., 1997] Thomas G Dietterich, Richard H Lathrop, and Tomás Lozano-Pérez. Solving the multiple instance problem with axis-parallel rectangles. Artificial intelligence, 89(1-2):31-71, 1997.
- [Duta et al., 2024] Iulia Duta, Giulia Cassarà, Fabrizio Sil- vestri, and Pietro Liò. Sheaf hypergraph networks. NeurIPS, 36, 2024.
- [Fan et al., 2021] Lei Fan, Arcot Sowmya, Erik Meijering, and Yang Song. Learning visual features by colorization for slide-consistent survival prediction from whole slide images. In MICCAI, pages 592-601. Springer, 2021.
- [Fan et al., 2022a] Lei Fan, Arcot Sowmya, Erik Meijer- ing, and Yang Song. Cancer survival prediction from whole slide images with self-supervised learning and slide consistency. IEEE Transactions on Medical Imaging, 42(5):1401-1412, 2022.
- [Fan et al., 2022b] Lei Fan, Arcot Sowmya, Erik Meijering, and Yang Song. Fast ff-to-ffpe whole slide image trans- lation via laplacian pyramid and contrastive learning. In MICCAI, pages 409-419. Springer, 2022.
- [Feng et al., 2019] Yifan Feng, Haoxuan You, Zizhao Zhang, Rongrong Ji, and Yue Gao. Hypergraph neural net- works. In AAAI, volume 33, pages 3558-3565, 2019.
- [Filiot et al., 2023] Alexandre Filiot, Ridouane Ghermi, An- toine Olivier, Paul Jacob, et al. Scaling self-supervised learning for histopathology with masked image modeling. medRxiv, 2023.
- [Guan et al., 2022] Yonghang Guan, Jun Zhang, Kuan Tian, et al. Node-aligned graph convolutional network for whole-slide image representation and classification. In CVPR, pages 18813-18823, 2022.
- [Haykin, 1998] Simon Haykin. Neural networks: a compre- hensive foundation. Prentice Hall PTR, 1998.
- [He et al., 2016] Kaiming He, Xiangyu Zhang, Shaoqing Ren, and Jian Sun. Deep residual learning for image recog- nition. In CVPR, pages 770-778, 2016.
- [Hou et al., 2016] Le Hou, Dimitris Samaras, Tahsin M Kurc, Yi Gao, James E Davis, and Joel H Saltz. Patch- based convolutional neural network for whole slide tissue image classification. In CVPR, pages 2424-2433, 2016.
- [Hou et al., 2022] Wentai Hou, Lequan Yu, Chengxuan Lin, et al. Hˆ2-mil: exploring hierarchical representation with heterogeneous multiple instance learning for whole slide image analysis. In AAAI, volume 36, pages 933-941, 2022.
- [Ilse et al., 2018] Maximilian Ilse, Jakub Tomczak, and Max Welling. Attention-based deep multiple instance learning. In ICML, pages 2127-2136. PMLR, 2018.
- [Jaume et al., 2024] Guillaume Jaume, Anurag Vaidya, Richard J Chen, et al. Modeling dense multimodal in- teractions between biological pathways and histology for survival prediction. In CVPR, pages 11579-11590, 2024.
- [Jin et al., 2024] Cheng Jin, Luyang Luo, Huangjing Lin, et al. Hmil: Hierarchical multi-instance learning for fine- grained whole slide image classification. IEEE Transac- tions on Medical Imaging, 2024.
- [Jing et al., 2025] Weipeng Jing, Junze Wang, Donglin Di, Dandan Li, Yang Song, and Lei Fan. Multi-modal hy- pergraph contrastive learning for medical image segmen- tation. Pattern Recognition, 165:111544, 2025.
- [Kapse et al., 2024] Saarthak Kapse, Pushpak Pati, Srijan Das, et al. Si-mil: Taming deep mil for self-interpretability in gigapixel histopathology. In CVPR, pages 11226- 11237, 2024.
- [Klambauer et al., 2017] Günter Klambauer, Thomas Un- terthiner, Andreas Mayr, and Sepp Hochreiter. Self- normalizing neural networks. NeurIPS, 30, 2017.
- [Li et al., 2021] Bin Li, Yin Li, and Kevin W Eliceiri. Dual- stream multiple instance learning network for whole slide image classification with self-supervised contrastive learn- ing. In CVPR, pages 14318-14328, 2021.
- [Li et al., 2023] Shengrui Li, Yining Zhao, Jun Zhang, Ting Yu, Ji Zhang, and Yue Gao. High-order correlation-guided slide-level histology retrieval with self-supervised hash- ing. IEEE Transactions on Pattern Analysis and Machine Intelligence, 45(9):11008-11023, 2023.
- [Lipkova et al., 2022] Jana Lipkova, Richard J Chen, Bowen Chen, et al. Artificial intelligence for multimodal data integration in oncology. Cancer cell, 40(10):1095-1110, 2022.
- [Lu et al., 2021] Ming Y Lu, Drew FK Williamson, Tiffany Y Chen, et al. Data-efficient and weakly super- vised computational pathology on whole-slide images. Nature biomedical engineering, 5(6):555-570, 2021.
- [Lu et al., 2024] Ming Y Lu, Bowen Chen, Drew FK Williamson, et al. A visual-language foundation model for computational pathology. Nature Medicine, 30(3):863- 874, 2024.
- [Mobadersany et al., 2018] Pooya Mobadersany, Safoora Yousefi, Mohamed Amgad, et al. Predicting cancer out- comes from histology and genomics using convolutional networks. Proceedings of the National Academy of Sci- ences, 115(13):E2970-E2979, 2018.
- [Nakhli et al., 2023] Ramin Nakhli, Puria Azadi Moghadam, Haoyang Mi, et al. Sparse multi-modal graph transformer with shared-context processing for representation learning of giga-pixel images. In CVPR, pages 11547-11557, 2023.
- [Nunes et al., 2024] Luís Nunes, Fuqiang Li, Meizhen Wu, et al. Prognostic genome and transcriptome signatures in colorectal cancers. Nature, 633(8028):137-146, 2024.
- [Qu et al., 2024] Mingcheng Qu, Yuncong Wu, Donglin Di, Anyang Su, Tonghua Su, Yang Song, and Lei Fan. Boundary-guided learning for gene expression prediction in spatial transcriptomics. In 2024 IEEE International Conference on Bioinformatics and Biomedicine (BIBM), pages 445-450. IEEE, 2024.
- [Raser and O'shea, 2005] Jonathan M Raser and Erin K O'shea. Noise in gene expression: origins, consequences, and control. Science, 309(5743):2010-2013, 2005.
- [Shao et al., 2021] Zhuchen Shao, Hao Bian, Yang Chen, et al. Transmil: Transformer based correlated multi- ple instance learning for whole slide image classification. NeurIPS, 34:2136-2147, 2021.
- [Shao et al., 2024] Wei Shao, YangYang Shi, Daoqiang Zhang, JunJie Zhou, and Peng Wan. Tumor micro- environment interactions guided graph learning for sur- vival analysis of human cancers from whole-slide patho- logical images. In CVPR, pages 11694-11703, 2024.
- [Tang et al., 2025] Qingchen Tang, Lei Fan, Maurice Pag- nucco, and Yang Song. Prototype-based image prompting for weakly supervised histopathological image segmenta- tion. arXiv preprint arXiv:2503.12068, 2025.
- [Wang et al., 2022] Xiyue Wang, Sen Yang, Jun Zhang, Minghui Wang, Jing Zhang, Wei Yang, Junzhou Huang, and Xiao Han. Transformer-based unsupervised con- trastive learning for histopathological image classification. Medical image analysis, 81:102559, 2022.
- [Xu and Chen, 2023] Yingxue Xu and Hao Chen. Multi- modal optimal transport-based co-attention transformer with global structure consistency for survival prediction. In ICCV, pages 21241-21251, 2023.
- [Yao et al., 2020] Jiawen Yao, Xinliang Zhu, Jitendra Jonna- gaddala, Nicholas Hawkins, and Junzhou Huang. Whole slide images based cancer survival prediction using at- tention guided deep multiple instance learning networks. Medical Image Analysis, 65:101789, 2020.
- [Yao et al., 2021] Jiawen Yao, Yu Shi, Kai Cao, et al. Deep- prognosis: Preoperative prediction of pancreatic cancer survival and surgical margin via comprehensive under- standing of dynamic contrast-enhanced ct imaging and tumor-vascular contact parsing. Medical image analysis, 73:102150, 2021.
- [Zhang et al., 2024] Yilan Zhang, Yingxue Xu, Jianqi Chen, Fengying Xie, and Hao Chen. Prototypical information bottlenecking and disentangling for multimodal cancer survival prediction. In ICLR, 2024.
- [Zheng et al., 2018] Yushan Zheng, Zhiguo Jiang, Haopeng Zhang, et al. Histopathological whole slide image analysis using context-based cbir. IEEE transactions on medical imaging, 37(7):1641-1652, 2018.
- [Zhou and Chen, 2023] Fengtao Zhou and Hao Chen. Cross- modal translation and alignment for survival analysis. In ICCV, pages 21485-21494, 2023.
References were extracted automatically from the PDF and may contain errors.
Full text extracted automatically from the PDF; figures, tables and equations may differ. The PDF is the version of record.
Multimodal Cancer Survival Analysis via Hypergraph Learning with Cross-Modality Rebalance
Mingcheng Qu1 , Guang Yang1 , Donglin Di2 , Tonghua Su1 , Yue Gao2 , Yang Song3 and Lei Fan3∗
1Faculty of Computing, Harbin Institute of Technology
2School of Software, Tsinghua University
3School of Computer Science and Engineering, UNSW Sydney
lei.fan1@unsw.edu.au
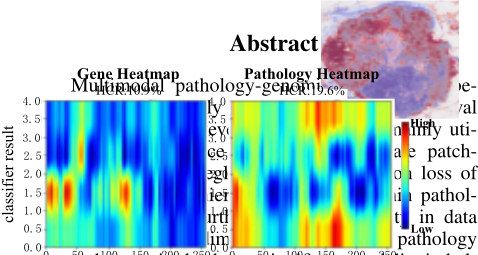
and genomics leads to a significant modality imbalance. The high spatial resolution inherent in pathology data renders it a dominant role while overshadowing genomics in multimodal integration. In this paper, we propose a multimodal survival prediction framework that incorporates hypergraph learning to effectively capture both contextual and hierarchical 0.0 0 50 100 150 200 250 0 50 100 150 200 feature dim feature dim 250 0.0 Feature Heatmap
details from pathology images. Moreover, it employs a modality rebalance mechanism and an interactive alignment fusion strategy to dynamically reweight the contributions of the two modalities, thereby mitigating the pathology-genomics imbalance. Quantitative and qualitative experiments are conducted on five TCGA datasets, demonstrating 4.0 3.0 2.0 1.0 classifier result 4.0 3.0 2.0 1.0 0.0
that our model outperforms advanced methods by over 3.4% in C-Index performance. Code: https: //github.com/MCPathology/MRePath. 0.0 0 50 100 150 200 feature dim
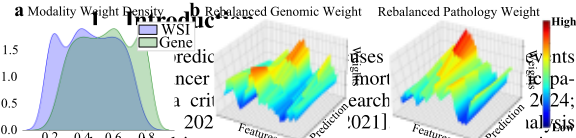
has gained increasing prominence, exemplified by the integration of whole slide images (WSIs) and genomic profiles in clinical oncology [Chen et al., 2021b; Xu and Chen, 2023]. The rationale behind this approach lies in the complementary strengths of each data modality: WSIs, regarded as the gold standard for cancer prognosis, provide cellular-level morphology and histopathological biomarkers [Fan et al., 2022b; Tang et al., 2025], while genomic data yield essential molec0.2 0.4 0.6 0.8
∗Corresponding author: Lei Fan
High ular signatures and mutation profiles for accurate diagnosis [Andre et al., 2022; Qu et al., 2024].
Low
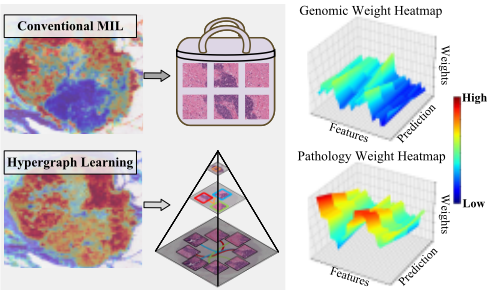
Weights Weights Original Pathology Weight High Low Genomic Weight Heatmap Original Genomic Weight Rebalanced Genomic Weight Weights Rebalanced Pathology Weight Weights In multimodal survival analysis, WSIs with giga-level resolution are typically segmented into multiple smaller patches to facilitate computationally efficient analysis [Ilse et al., 2018]. Then, the multi-instance learning (MIL) technique [Dietterich et al., 1997] is widely employed to aggregate patch-level features, operating under the assumption that a bag is labeled positive if it contains at least one positive instance; otherwise, it is considered negative. Although MILbased methods [Hou et al., 2016; Campanella et al., 2019] excel in WSI classification tasks by effectively distinguishing tumor from non-tumor regions, they remain suboptimal for survival analysis. In many cases, they fail to capture the crucial contextual and hierarchical information required for precise prognostic assessment, leading to the inherent limitation of information loss in survival prediction. Specifically, contextual information [Kapse et al., 2024] includes spatial relationships and the micro-environment surrounding tumor cells, while hierarchical information [Hou et al., 2022] involves structural organization across various scales, e.g., cellular, tissue, and organ levels. Both types of information are essential for accurate prognostic evaluations [Zheng et al., 2018; Jin et al., 2024].
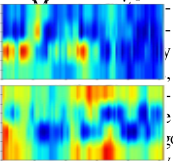
On the other hand, integrating information from different modalities is a key research direction [Lipkova et al., 2022]. Existing methods often employ late fusion by simply combining two modalities [Mobadersany et al., 2018; Cheerla and Gevaert, 2019; Chen et al., 2020], but they overlook the interconnections between genetic and pathologic data. Recent studies [Jaume et al., 2024; Zhang et al., 2024] explored early or mid fusion strategies, such as leveraging cross-attention mechanisms to better capture interactions across the modalities. However, these strategies still struggle to address issues related to modality imbalance. Specifically, a WSI can be represented through numerous patches, whereas only a few hundred genes have been identified for common cancers due to a higher signal-to-noise ratio and lower information density [Raser and O'shea, 2005]. Consequently, this discrepancy can cause pathological data to dominate the fusion process and overshadow genomic data, especially when cross-attention mechanisms are utilized [Chen et al., 2021b; Jaume et al., 2024]. As illustrated in Figure 1, we conduct heuristic survival prediction experiments, where pathology modalities dominate the prediction task, highlighting the pathology-genomics imbalance.
In this paper, to address the information loss challenge, we aim to leverage graph learning as an alternative to MIL for aggregating patch-level features. Unlike existing graph-based approaches [Shao et al., 2024; Chan et al., 2023] that reduce complex relationships to binary connections with limited expressiveness, we utilize hypergraphs [Feng et al., 2019] to model higher-order interactions among pathological features through hyperedges. This approach enables a more sophisticated representation of hierarchical and contextual details, enhancing the model's capability to capture intricate relationships. To tackle the challenge of pathology-genomics modality imbalance, we propose a dynamic weighting mechanism that adjusts the contribution of each modality based on its inherent reliability and synergy. By evaluating and aligning their interconnections, this approach ensures that each modality contributes optimally to the fusion process, effectively leveraging the strengths of both pathology and genomic data for more accurate survival predictions.
We propose a multimodal learning framework, MRePath (Multi-Modal Rebalance for Pathology-Genomic Survival Prediction), that leverages hypergraph learning and modality rebalance for survival analysis in WSIs. Specifically, in contrast to previous hypergraph studies [Di et al., 2022a; Li et al., 2023; Jing et al., 2025] that focus only on spatial relationships, we designate patches as nodes and construct hyperedges in both topological and feature spaces to capture spatial interactions and model structural hierarchies. We further introduce sheaf hypergraphs to promote information exchange between nodes and hyperedges, effectively preserving contextual details within individual patches and hierarchical relationships across the entire WSI. For rebalancing pathologygenomics modalities, we employ a dynamic weighting mechanism that first assesses the mono-confidence of each modality's reliability and then calculates holo-confidence by evaluating their interactions. These assessments are integrated to determine the final weight, which rebalances the contribution of each modality. Subsequently, an interactive alignment fusion is introduced, leveraging cross-attention to enable mutual guidance between modalities to produce the final hazard prediction. The contributions can be summarized as below:
- A multimodal framework, MRePath, is proposed to address both the MIL-based information loss and the pathology-genomics modality imbalance challenges in survival analysis for WSIs.
- A hypergraph learning framework incorporating sheaf hypergraphs is constructed over both topological and feature spaces to capture contextual and hierarchical details, while enhancing the model's ability to differentiate between various types of information.
- A modality rebalance method, consisting of a dynamic weighting mechanism and an interactive alignment fusion, is introduced to adjust the contributions of the two modalities for the final hazard prediction.
- Qualitative and quantitative experiments on five public datasets demonstrate the superiority of our model, achieving a 3.4% improvement over advanced methods.
2 RelatedWork
Survival analysis on WSIs. Early studies typically rely on MIL [Ilse et al., 2018] to aggregate patch-level features for representing WSIs [Hou et al., 2016; Campanella et al., 2019]. Various methods have been used to extract global features, such as embeddings [Yao et al., 2021], attention weights [Li et al., 2021], and graph-based modeling [Guan et al., 2022; Di et al., 2022a; Di et al., 2022b]. Recently, multimodal approaches integrating WSIs with genomic data for survival analysis have gained popularity [Lipkova et al., 2022]. Most research has focused on late fusion, such as vector concatenation [Mobadersany et al., 2018], modality-level alignment [Cheerla and Gevaert, 2019], and bilinear pooling [Chen et al., 2020]. Additionally, some studies have explored early or middle fusion approaches, leveraging crossattention mechanisms for cross-modal interactions [Chen et al., 2021b; Zhou and Chen, 2023; Jaume et al., 2024].
Despite their promising performance, these approaches often overlook the modality imbalance. We propose a plugand-play adjustment to evaluate each modality's reliability and connections, dynamically optimizing their contributions. This enhances multimodal fusion and improves performance.
Graph-based pathology analysis. Graph learning methods are widely adopted to capture intricate relationships in pathology-related tasks [Guan et al., 2022]. Early studies represented patches as graph nodes, constructing either adjacency-based [Chen et al., 2021a] or fully-connected graphs [Adnan et al., 2020]. Recent studies have employed cellular graphs to reveal spatial relationships among specific biomarkers (e.g., Ki67) [Nakhli et al., 2023] or cell types (e.g., tumor and stromal cells) [Shao et al., 2024] within WSI. Additionally, some studies [Di et al., 2022a; Di et al., 2022b] have utilized hypergraphs in WSIs for survival analysis, leveraging their representational power to capture complex interactions.
In our work, to tackle MIL-based information loss, we construct a hypergraph from both topological and feature spaces to capture contextual and hierarchical details. Additionally, we incorporate a sheaf hypergraph to adeptly differentiate and manage information from various types of hyperedges.
3 Method
3.1 Overview
Preliminary. Given X = {X1, . . . ,Xn} is the cohort of n subjects, each subject Xi can be represented as a tuple Xi = {Hi, yi}. Here, Hi = {Pi,Gi} denotes a pair of pathology-genomics features, where Pi represents the WSI, and Gi represents the genomic profiles. Meanwhile, yi = {ci, ti} represents the label of the i-th subject, comprising an event status ci ∈ {0, 1} (ci = 0 indicates that the event has occurred) and the subject's overall survival time ti. The goal of survival prediction is to estimate the hazard function ϕh(t), which predicts the instantaneous incidence rate of the interest event at a specific time point t. Instead of estimating a patient's survival time, we aim to train a model F to predict the probability that a patient's survival exceeds t using the survival function ϕs(t). This process is supervised by the negative log-likelihood (NLL) [Yao et al., 2020], defined as:
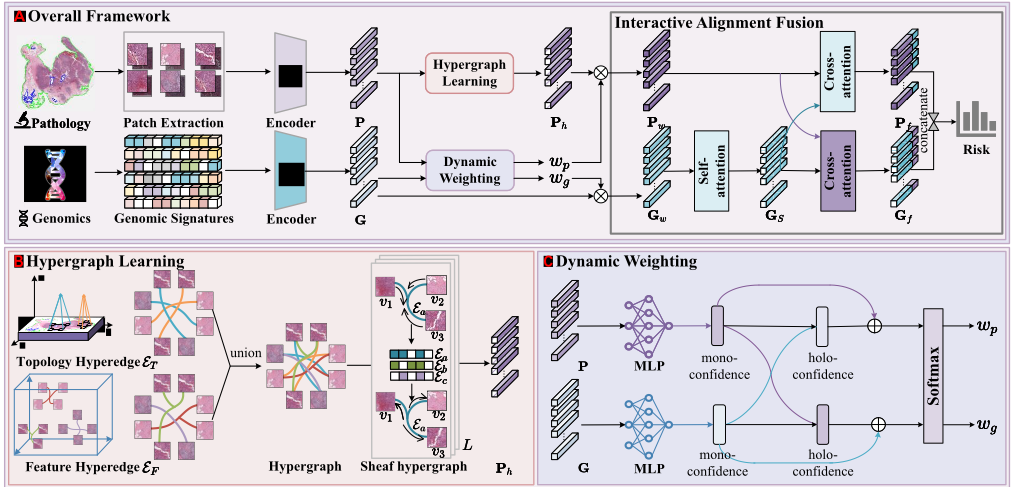
MRePath. It comprises three stages: feature extraction, hypergraph learning, and modality rebalance, as illustrated in Figure 2. Initially, features P and G are extracted from paired pathology and genomics data using different encoders. Hypergraph learning refines P to produce Ph with more contextual and hierarchical details. Modality rebalance includes a dynamic weighting module to obtain balanced features Pw and Gw, and an interactive alignment fusion to produce integrated features Pf and Gf using cross-attention operations, predicting the final risk outcomes.
Pathology feature extraction. Following previous studies [Chen et al., 2021b; Xu and Chen, 2023], we partition each WSI into multiple 256×256 pixel patches at 20× magnification. A pretrained encoder model (e.g., ResNet50) is used to extract d-dimensional features from these patches. Each WSI is then represented as P ∈ RN×d = {p1, p2, . . . , pN}, where N is the number of patches, and the coordinates of the i-th patch pi are c(i) p = (x(i) , y(i) ).
Genomic feature extraction. To process genomic data, including RNA-seq, Copy Number Variation (CNV), and mutation status, which typically exhibit a high signal-to-noise ratio, a selection process is applied to enhance data quality [Chen et al., 2021b]. The selected genes are categorized into six functional groups: Tumor Suppression, Oncogenesis, Protein Kinases, Cellular Differentiation, Transcription, and Cytokines and Growth. These data are then embedded using a multilayer perceptron (MLP) to generate G ∈ RM×d = {g1, g2, . . . , gM}, where M represents the number of gene categories.
3.2 Hypergraph Learning
We aim to leverage hypergraph learning to capture contextual and hierarchical details from patch-level features in WSIs. Our approach consists of two key components: hypergraph construction, which encodes spatial and structural relationships within WSIs, and the sheaf hypergraph, which enhances representations through higher-order structures. Together, these components form a robust framework for representing spatial and structural patterns in WSIs, enabling more effective analysis of their complex relationships.
Hypergraph construction. A hypergraph G = {V, E} is defined by a set of vertices V and a set of hyperedges E. For a WSI P, each patch is treated as a vertex, such that V = {v1, v2, . . . , vN}, where N is the total number of patches. The feature f (i) v of each vertex vi corresponds to the extracted features of its associated patch.
Hyperedges E are generated using two complementary methods: topological-based and feature-based approaches, capturing spatial and feature-level relationships, respectively. In the topological space, hyperedges are formed by grouping each patch with its neighboring patches based on the Euclidean distance in the spatial domain. Specifically, for a given patch vi, its neighbors are determined as:
where c(i) p and c(j) p denote the coordinates of patches vi and vj, respectively, and δ is a distance threshold. This process results in the set of topological-based hyperedges ET = {{vi, vj1 , vj2 , . . . } | ∀ vj ∈ NT (vi)}.
In the feature space, hyperedges are created based on the similarity between patch features. For a given patch vi, its feature-based neighbors are identified as:
where sim(·, ·) is a similarity function, such as cosine similarity, and γ is a similarity threshold. The values of δ and γ are determined by the hyperedge construction threshold k. Using these neighbors, the feature-based hyperedges are defined as EF = {{vi, vj1 , vj2 , . . . } | ∀ vj ∈ NF (vi)}.
The final hyperedge set E is constructed by merging the topological-based and feature-based hyperedges, such that E = ET ∪ EF where ∪ represents the take union.
Sheaf hypergraph. Given the constructed hypergraph G, the pathology feature P undergoes vanilla hypergraph convolution at the l-th layer, expressed as:
where ∆ represents the Laplacian operator, IN is the identity matrix, Θ(l) is a learnable weight matrix, and σ is a nonlinear activation function. The sheaf hypergraph [Duta et al., 2024] enhances this process by substituting the standard Laplacian operator ∆ in Eq. 4 with the sheaf Laplacian ∆F , allowing for data processing within a structured space over hyperedges, producing high-order features Ph = P(L) after L layers. The sheaf Laplacian is defined as follows:
where Dv is the degree matrix for vertices, and LF is the sheaf Laplacian matrix, given by:
Here, Fv⊥e represents the linear maps that facilitate the flow of information from a vertex v to a hyperedge e. It is achieved by averaging the features of the nodes within each hyperedge and then further aggregating these averaged features based on their association with each vertex.
The sheaf hypergraph creates an information flow space for nodes and hyperedges, enabling more expressive and structured dependencies for fine-grained information propagation. This approach effectively captures both local contextual features within individual patches and global hierarchical relationships across the entire WSI, resulting in a more robust representation. This framework is well-suited for survival prediction tasks requiring diverse information integration.
3.3 Modality Rebalance
We aim to achieve modality rebalance and interactive alignment fusion to recalibrate the contributions of each modality. This stage comprises two key modules: dynamic weighting, which calculates modality-specific weights to rebalance each modality, and interactive alignment fusion, which integrates the balanced features for final prediction.
Dynamic weighting. It dynamically regulates the contributions of pathologic and genomic data by computing the weights wp and wg for their respective representations P and G. This process leverages two confidence measures: mono-confidence, which evaluates the reliability of individual modalities, and holo-confidence, which captures their interactions. Together, these measures ensure effective modality fusion for accurate predictions.
Mono-confidence assesses the reliability of each modality by estimating the probability of accurately identifying the true class label within the respective dataset, thereby reflecting the modality's confidence [Corbi`ere et al., 2019]. The mono-confidence scores for pathology and genomic modalities are computed as:
where Φp and Φg are learnable parameters implemented with MLPs. A higher mono-confidence value indicates greater reliability of the corresponding modality [Cao et al., 2024].
Holo-confidence extends mono-confidence by incorporating cross-modal interactions, reflecting the overall coordination and complementarity between pathology and genomics. The holo-confidence for each modality is computed as:
These measures quantify how effectively each modality interacts with the other, providing a more holistic evaluation of their contributions.
To obtain the final weights, mono-confidence and holoconfidence are combined through a linear operation followed by a softmax to convert probabilities, defined as:
where ϕ denotes the softmax, wp and wg are the final weights for pathology and genomic features, respectively. These weights are used to adjust the pathology and genomic features, resulting in weighted representations Pw = wpPh and Gw = wgG. This dynamic weighting mechanism enables the model to adaptively balance the contributions of the two modalities, leveraging both their individual reliability and their interactions to achieve optimal fusion.
| Model | p. | g. | BLCA | BRCA | CO-READ | HNSC | STAD | Mean |
|---|---|---|---|---|---|---|---|---|
| ABMIL [Ilse et al., 2018] AMISL [Yao et al., 2020] TranMIL [Shao et al., 2021] CLAM-SB [Lu et al., 2021] CLAM-MB [Lu et al., 2021] | ✓ ✓ ✓ ✓ ✓ | 62.4 ± 5.9 62.7 ± 3.2 61.7 ± 64.3 ± 62.3 ± 53.0 ± 7.0 52.1 ± | 67.2 ± 5.1 68.1 ± 3.6 66.3 ± 5.3 67.5 ± 7.4 69.6 ± 9.8 62.2 ± 7.9 | 73.0 ± 15.1 71.0 ± 9.1 74.7 ± 15.1 71.7 ± 17.2 72.1 ± 15.9 71.2 ± 11.4 71.1 ± 16.2 | 62.4 ± 4.2 60.7 ± 4.8 61.9 ± 6.2 63.0 ± 4.8 64.8 ± 5.0 52.0 ± 6.4 51.4 ± 7.6 | 63.6 ± 4.3 55.3 ± 1.2 66.0 ± 7.2 61.6 ± 7.8 62.0 ± 3.4 49.7 ± 3.1 48.5 ± 4.7 | 65.7 63.6 66.1 65.6 66.2 57.6 | |
| 4.5 | ||||||||
| 4.4 | ||||||||
| 4.5 | ||||||||
| MLP [Haykin, 1998] | ✓ | |||||||
| SNN [Klambauer et al., 2017] | ✓ | 7.0 | 62.1 ± 7.3 | 57.0 | ||||
| SNNTrans [Klambauer et al., 2017] | ✓ | 58.3 ± 6.0 | 67.9 ± 5.3 | 73.9 ± 12.4 | 57.0 ± 3.5 | 54.7 ± 4.1 | 62.2 | |
| SNN+CLAM | ✓ | ✓ | 62.5 ± 6.0 | 69.9 ± 6.4 | 71.6 ± 16.0 | 63.8 ± 6.6 | 62.9 ± 6.5 | 66.1 |
| Porpoise [Chen et al., 2022] | ✓ | ✓ | 61.7 ± 5.6 | 66.8 ± 7.0 | 73.8 ± 15.1 | 61.4 ± 5.8 | 66.0 ± 10.6 | 65.9 |
| MCAT [Chen et al., 2021b] | ✓ | ✓ | 64.0 ± 7.6 | 68.5 ± 10.9 | 72.4 ± 13.7 | 56.4 ± 8.4 | 62.5 ± 11.8 | 64.8 |
| MOTCat [Xu and Chen, 2023] | ✓ | ✓ | 65.9 ± 6.9 | 72.7 ± 2.7 | 74.2 ± 12.4 | 65.6 ± 4.1 | 62.1 ± 6.5 | 68.1 |
| CMTA [Zhou and Chen, 2023] | ✓ | ✓ | 67.0 ± 3.0 | 69.1 ± 3.7 | 70.4 ± 11.7 | 56.2 ± 8.6 | 59.2 ± 1.4 | 64.4 |
| SurvPath [Jaume et al., 2024] | ✓ | ✓ | 63.5 ± 2.6 | 67.9 ± 7.7 | 73.1 ± 12.4 | 61.7 ± 5.8 | 62.0 ± 4.4 | 65.6 |
| PIBD [Zhang et al., 2024] | ✓ | ✓ | 65.1 ± 9.2 | 71.2 ± 4.8 | 78.6 ± 13.4 | 60.7 ± 5.9 | 66.8 ± 5.5 | 68.5 |
| MRePath (Ours) | ✓ | ✓ | 70.5 ± 4.1 | 72.9 ± 1.9 | 80.8 ± 5.8 | 66.0 ± 5.8 | 67.5 ± 3.3 | 71.5 |
Interactive alignment fusion. The integration of pathology and genomic features is further enhanced by an interactive alignment strategy, which captures the internal relationships between the two modalities and facilitates their effective fusion. This process involves modality-specific co-attention mechanisms to refine feature representations.
To enhance the selection of pathological features based on genomic information, a gene-guided co-attention layer AG→P is employed. This mechanism results in the PC, as:
where ϕ(·) refers to the softmax function. wk p Gf , wqpPw, and wv pGf are keys, queries, and values, respectively. This co-attention mechanism aligns genomic features Gf with pathology features Pw, highlighting the most relevant pathological features. PC is then combined with Pw via a residual connection to produce the fused pathological features Pf .
For genomic features, a self-attention layer is first applied to capture intra-modal relationships, producing GS. Subsequently, a pathology-guided co-attention layer AP→G is employed to enhance genomic feature selection based on pathological information. The co-attention GC are computed as:
where wk g Pw, wq gGS, and wv g Pw are keys, queries, and values in the co-attention process. The co-attended genomic features GC are then combined with GS via residual connections to produce the refined genomic features Gf .
The interactive alignment strategy ensures that both modalities contribute complementary information while maintaining internal consistency. The fused pathology features Pf and refined genomic features Gf are enriched with modalityspecific and cross-modality interactions, offering a robust and comprehensive representation for survival prediction.
4 Experiments
4.1 Datasets and Settings
Datasets. We followed previous studies [Jaume et al., 2024; Zhang et al., 2024] and selected five datasets from The Cancer Genome Atlas (TCGA) to evaluate the performance of our model. The datasets include: Bladder Urothelial Carcinoma (BLCA) (n=384), Breast Invasive Carcinoma (BRCA) (n=968), Colon and Rectum Adenocarcinoma (COREAD) (n=298), Head and Neck Squamous Cell Carcinoma (HNSC) (n=392), and Stomach Adenocarcinoma (STAD) (n=317). The detailed distribution of survival times within these datasets is provided in the supplementary materials.
Evaluation metric. We used the Concordance Index (CIndex) to assess the predictive accuracy of our model. For each cancer type, we conducted 5-fold cross-validation, splitting the data into training and validation sets with a 4:1 ratio. Results are reported as the mean C-Index ± standard deviation (STD) across the five datasets.
Implementation details. To ensure a fair comparison, we adopted similar settings as previous studies [Chen et al., 2021b; Jaume et al., 2024; Zhang et al., 2024], using identical dataset splits and employing the Adam optimizer with a learning rate of 1 × 10⁻⁴ , a weight decay of 1 × 10⁻⁵ , and 30 training epochs.
| GNN | Hyperedges | BLCA | BRCA | CO-READ | HNSC | STAD | Mean |
|---|---|---|---|---|---|---|---|
| / | / | 62.5± 3.5 | 71.5± 4.2 | 69.9± 9.0 | 63.9± 3.9 | 61.6± 5.1 | 65.9 |
| GAT | / | 69.5± 6.3 | 67.7± 1.8 | 71.0± 5.9 | 62.6± 5.4 | 64.5± 5.7 | 67.1 |
| GCN | / | 69.0± 3.6 | 69.5± 3.3 | 72.6± 9.8 | 60.1± 2.1 | 66.9± 6.6 | 67.6 |
| HGNN | ET+EF | 69.2± 2.2 | 72.4± 5.7 | 80.0± 6.3 | 64.9± 2.5 | 66.1± 5.2 | 70.5 |
| SHGNN | ET | 68.4± 2.9 | 70.1± 2.6 | 77.1± 8.4 | 62.4± 1.7 | 65.3± 5.3 | 68.7 |
| SHGNN | EF | 69.3± 2.2 | 70.6± 3.7 | 73.5± 7.2 | 65.1± 7.2 | 65.3± 3.4 | 68.8 |
| SHGNN | ET+EF | 70.5± 4.1 | 72.9± 1.9 | 80.8± 5.8 | 66.0± 5.8 | 67.5± 3.3 | 71.5 |
4.2 Comparisons and Results
We classified the advanced methods into three distinct groups according to the modalities they used: pathology only (ABMIL, AMISL, TransMIL, and CLAM), genomic only (MLP, SNN, and SNNTrans), and multimodal approaches (Porpoise, MCAT, MOTCat, CMTA, SurvPath, and PIBD).
As shown in Table 1, unimodal methods such as MLP and SNN achieved average C-Index scores of 57.6% and 57.0%, respectively. These scores were significantly lower than those of multimodal methods such as MOTCat (68.1%), SurvPath (65.6%) and PIBD (68.5%), underscoring the limitations of unimodal approaches in capturing complex biological information. Among multimodal strategies, early fusion methods (e.g., MCAT, MOTCat, CMTA, SurPath, PIBD, and our approach) generally outperformed late fusion methods including SNN + CLAM (66.1%) and Porpoise (65.9%). This highlights the importance of effectively capturing interactions between modalities. Our method consistently outperformed both unimodal and other multimodal approaches across all cancer datasets, achieving the highest overall CIndex of 71.5% and an improvement of 3% over the secondhighest method PIBD. These results demonstrate the superior integration of pathology and genomics in our framework.
4.3 Ablation Studies
Hypergraph learning. We evaluated various graph architectures and hypergraph configurations, as summarized in Table 2. The baseline model with only MLP for feature aggregation achieved a C-Index of 65.9%. By employing GNN structures, GAT and GCN enhanced the C-Index to 67.1% and 67.6%, respectively, showing the effectiveness of graph structure in capturing relational interactions. Leveraging HGNN further elevated the mean C-Index to 70.5%, highlighting the utility of hyperedges in capturing high-order relationships compared to standard graph structures.
Incorporating a sheaf hypergraph with only topologicalbased hyperedges ET or feature-based hyperedges EF yielded scores of 68.7% and 68.8%, respectively, while combining both hyperedges achieved a superior C-Index of 71.5%. This indicates that integrating topological and feature-based connections significantly enhances the feature representations of WSIs, and that sheaf hypergraphs encourage local and global interactions to capture richer contextual and hierarchical details. These results highlight the efficacy of hypergraphs in capturing intricate relationships within the pathology data.
Hyperedge construction threshold. We evaluated various hyperedge construction threshold k, as illustrated in Figure 3.
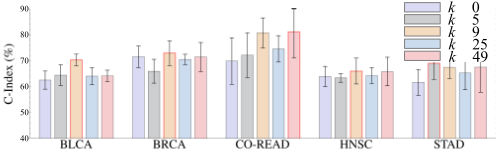
The baseline model without hyperedges (k = 0) showed moderate performance across all five datasets. Increasing k enhanced performance, with the best results achieved at k = 9. However, further increasing k led to a decline in performance and more computational costs. Although there was a slight improvement in CO-READ at k = 49, the other datasets failed to regain their peak performance. The threshold k determines the range of node connections, balancing local and global information. Proper tuning of k enhances model performance by capturing meaningful relationships while avoiding information homogenization (k = 49) or oversimplification (k = 0).
Modality rebalance. We evaluated the modality weighting and Interactive Alignment Fusion (IFA), as shown in Table 3. We first manually assigned equal weights to pathology and genomics (wp=0.5,wg=0.5) with IFA produced a mean C-Index of 67.8%. By using different weights to favor pathology (wp=0.7,wg=0.3), the mean C-Index increased to 69.3%, which can be attributed to the effective extraction of pathology features through the sheaf hypergraph. However, it also exhibited higher instability, with the largest standard deviation observed in the BRCA, CO-READ, HNSC, and STAD datasets. Weighting the higher value to genomics (wp=0.3, wg=0.7) yielded a slightly higher score of 69.5%, verifying the effectiveness of modality rebalance in modality fusion. We observed that introducing a dynamic weighting mechanism with IFA showed the best performance of 71.5%, demonstrating the advantages of dynamically recalibrating each modality's contributions.
When using dynamic weighting, models with different co-attention layers produced varied outcomes. Specifically, pathology-guided and gene-guided co-attention (P.G+G.P) achieved a mean C-Index of 66.9%, while self-attention for genomics combined with either P.G or G.P yielded scores of 68.9% and 68.5%, respectively. Compared to these settings, using IFA resulted in an improvement of 2.6% in the mean CIndex, highlighting the importance of capturing both internal interactions within each modality and their mutual influence during the modality fusion process.
Pathology feature encoder. We evaluated various pathology feature encoders including five pretrained models: UNI [Chen et al., 2024], Conch [Lu et al., 2024], PhiKon2 [Filiot et al., 2023], CTransPath [Wang et al., 2022], and ResNet50 [He et al., 2016], as detailed in Table 4. The UNI and CTransPath achieved the highest values of 69.6% and 76.9% on STAD and BRCA respectively. PhiKon2 performed best on BLCA (72.5%) and HNSC (67.4%). However, these encoders underperformed on other cohorts with TCGA-5T-A9Q9
| Modality weighting | Fusion | BLCA | BRCA | CO-READ | HNSC | STAD | Mean |
|---|---|---|---|---|---|---|---|
| wp = 0.5, wg = 0.5 | IFA. | 69.3 ± 3.0 | 67.2 ± 3.1 | 70.8 ± 8.4 | 65.1 ± 4.1 | 66.5 ± 5.3 | 67.8 |
| wp = 0.7, wg = 0.3 | IFA. | 68.3 ± 2.5 | 68.9 ± 5.5 | 76.2 ± 11.3 | 65.6 ± 5.5 | 67.3 ± 8.0 | 69.3 |
| wp = 0.3, wg = 0.7 | IFA. | 68.6 ± 3.5 | 71.0 ± 4.6 | 75.7 ± 5.7 | 64.1 ± 4.1 | 68.0 ± 4.7 | 69.5 |
| Dynamic weighting | P.G+G.P | 67.6 ± 3.6 | 69.1± 2.3 | 71.1 ± 10.8 | 61.5 ± 4.5 | 65.2 ± 5.4 | 66.9 |
| Dynamic weighting | SA.+P.G | 68.6 ± 3.5 | 67.6± 3.5 | 78.3 ± 7.4 | 63.3 ± 5.0 | 66.6 ± 2.8 | 68.9 |
| Dynamic weighting | SA.+G.P | 68.5 ± 2.9 | 69.9± 3.5 | 73.0 ± 12.4 | 63.3 ± 3.1 | 67.9 ± 5.1 | 68.5 |
| Dynamic weighting | IFA. | 70.5 ± 4.1 | 72.9 ± 1.9 | 80.8 ± 5.8 | 66.0 ± 5.8 | 67.5 ± 3.3 | 71.5 |
suboptimal average scores. Conch demonstrated robust overall performance with leading scores in CO-READ (83.2%), consistently performing well across all datasets and emerging as the most effective patch feature encoder in this study.
4.4 Visualization
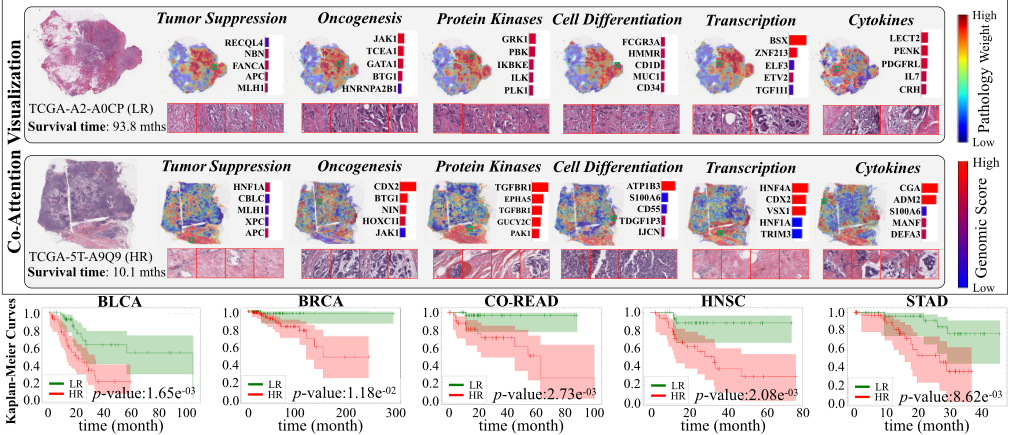
Cross-modality interaction. The pathology-genomics interactions and the impact of genomics in high- and lowrisk BRCA cases are visualized in Figure 4. In the highrisk patient, increased expression of genes associated with cell proliferation and differentiation, such as HNF1A, CDX2, TGFBR1, ATP1B3, HNF4A, and CGA, suggests a tumorpromoting environment, while the elevated expression levels of DNA repair genes, including RECQL4, JAK1, GRK1, FCGR3A, BSX, and LECT2, indicate protective effects for the low-risk patient, enhancing the body's resistance to cancer.
Kaplan-Meier analysis. To validate our model's discriminative ability, we presented Kaplan-Meier curves in Figure 4. Patients are split into high-risk and low-risk groups based on median risk scores predicted by our model, with p-values calculated via the log-rank test. In all five datasets, p-values below 0.05 indicate that our model effectively distinguishes between high-risk and low-risk populations.
| Patch encoder | BLCA | BRCA | CO-READ | HNSC | STAD | Mean |
|---|---|---|---|---|---|---|
| UNI | 71.6± 1.7 | 72.7± 4.2 | 78.3± 6.1 | 66.8± 7.2 | 69.6± 6.4 | 71.8 |
| Conch | 67.6± 4.6 | 75.0± 8.2 | 83.2± 7.7 | 66.2± 3.4 | 67.7± 7.1 | 71.9 |
| Phikon2 | 72.5± 3.9 | 76.6± 8.9 | 73.7± 4.3 | 67.4± 7.8 | 68.4± 6.5 | 71.7 |
| CTransPath | 66.9± 1.9 | 76.9± 7.8 | 81.3± 8.2 | 66.5± 4.0 | 65.9± 4.2 | 71.5 |
| ResNet50 | 70.5± 4.1 | 72.9± 1.9 | 80.8± 5.8 | 66.0± 5.8 | 67.5± 3.3 | 71.5 |
5 Conclusion
In this paper, we propose a multimodal framework MRePath for cancer survival prediction. It addresses MIL-based information loss by using sheaf hypergraphs in WSIs, and pathology-genomics imbalance by employing a dynamic rebalance. Experiments on five datasets demonstrate the superior performance and effectiveness of our framework.
Limitations. Considering WSIs with varying numbers of patches, the same k-value in the hypergraph leads to different scopes, imposing a potential inconsistency in pathology slides. In clinical applications, due to various factors, it may be challenging to obtain complete paired pathology and genomic data. In some cases, low-quality data or even missing modalities can significantly impact our modality rebalancing process, highlighting the need for greater robustness of our framework. We only considered a single WSI or a set of genomic information. However, there may be multiple WSIs and more extensive genomic data, which introduces the need for more sophisticated rebalancing and fusion strategies.
@inproceedings{ijcai2025p201,
  title     = {Multimodal Cancer Survival Analysis via Hypergraph Learning with Cross-Modality Rebalance},
  author    = {Qu, Mingcheng and Yang, Guang and Di, Donglin and Su, Tonghua and Gao, Yue and Song, Yang and Fan, Lei},
  booktitle = {Proceedings of the Thirty-Fourth International Joint Conference on
               Artificial Intelligence, {IJCAI-25}},
  publisher = {International Joint Conferences on Artificial Intelligence Organization},
  editor    = {James Kwok},
  pages     = {1802--1810},
  year      = {2025},
  month     = {8},
  note      = {Main Track},
  doi       = {10.24963/ijcai.2025/201},
  url       = {https://doi.org/10.24963/ijcai.2025/201},
}
TY - CPAPER TI - Multimodal Cancer Survival Analysis via Hypergraph Learning with Cross-Modality Rebalance AU - Qu, Mingcheng AU - Yang, Guang AU - Di, Donglin AU - Su, Tonghua AU - Gao, Yue AU - Song, Yang AU - Fan, Lei T2 - Proceedings of the Thirty-Fourth International Joint Conference on Artificial Intelligence, IJCAI-25 PB - International Joint Conferences on Artificial Intelligence Organization PY - 2025 SP - 1802 EP - 1810 DO - 10.24963/ijcai.2025/201 UR - https://doi.org/10.24963/ijcai.2025/201 ER -Copied
Machine-readable versions of this paper, for tools and AI agents:
 Welcome
 Future Conferences
 AI Journal Division
 IJCAI Proceedings
 About IJCAI
 IJCAI Awards