
Deep Learning-Based Pedestrian Simulation with Limited Real-World Training Data: An Evaluation Framework
Proceedings of the Thirty-Fourth International Joint Conference on Artificial Intelligence. Main Track. Pages 196-204.
https://doi.org/10.24963/ijcai.2025/23
Keywords
- Machine Learning: ML: Benchmarks
- Agent-based and Multi-agent Systems: MAS: Agent-based simulation and emergence
- Machine Learning: ML: Multi-task and transfer learning
Abstract
Simulating pedestrian movement is important for applications such as disaster management, robotics, and game design. While deep learning models have been extensively used on related problems, their use as pedestrian simulators remains relatively unexplored. This paper aims to encourage more research in this direction in two ways. First, it proposes an evaluation framework that is applicable to both traditional and deep learning based simulators. Second, it proposes and evaluates several ideas related to input representation, choice of neural architecture, exploiting knowledge-based simulators in data poor regimes, and repurposing trajectory prediction models. Our extensive experiments provide several useful insights for future research in pedestrian simulation. The code is available at https://github.com/vmahzoon76/DL-Crowd-Sim.
- [Alahi et al., 2016] Alexandre Alahi, Kratarth Goel, Vignesh Ramanathan, Alexandre Robicquet, Li Fei-Fei, and Sil- vio Savarese. Social lstm: Human trajectory prediction in crowded spaces. In Proceedings of the IEEE conference on computer vision and pattern recognition, pages 961-971, 2016.
- [Almeida et al., 2013] João E Almeida, Rosaldo JF Rosseti, and António Lec ¸a Coelho. Crowd simulation model- ing applied to emergency and evacuation simulations us- ing multi-agent systems. arXiv preprint arXiv:1303.4692, 2013.
- [Aschwanden et al., 2008] Gideon Aschwanden, Jan Ha- latsch, and Gerhard Schmitt. Crowd simulation for ur- ban planning. In Architecture in Computro-26th eCAADe Conference Proceedings, pages 493-500, 2008.
- [Bae et al., 2024a] Inhwan Bae, Junoh Lee, and Hae-Gon Jeon. Can language beat numerical regression? language- based multimodal trajectory prediction. In Proceedings of the IEEE/CVF Conference on Computer Vision and Pat- tern Recognition, pages 753-766, 2024.
- [Bae et al., 2024b] Inhwan Bae, Young-Jae Park, and Hae- Gon Jeon. Singulartrajectory: Universal trajectory pre- dictor using diffusion model. In Proceedings of the IEEE/CVF Conference on Computer Vision and Pattern Recognition, pages 17890-17901, 2024.
- [Chik et al., 2016] SF Chik, CF Yeong, ELM Su, TY Lim, Yuvashini Subramaniam, and PJH Chin. A review of social-aware navigation frameworks for service robot in dynamic human environments. Journal of Telecommu- nication, Electronic and Computer Engineering (JTEC), 8(11):41-50, 2016.
- [Francis and others, 2023] Anthony Francis et al. Principles and guidelines for evaluating social robot navigation algo- rithms. arXiv preprint arXiv:2306.16740, 2023.
- [Giuliari et al., 2021] Francesco Giuliari, Irtiza Hasan, Marco Cristani, and Fabio Galasso. Transformer networks for trajectory forecasting. In 2020 25th international conference on pattern recognition (ICPR), pages 10335- 10342. IEEE, 2021.
- [Guo et al., 2022] Ke Guo, Wenxi Liu, and Jia Pan. End-to- end trajectory distribution prediction based on occupancy grid maps. In Proceedings of the IEEE/CVF Conference on Computer Vision and Pattern Recognition, pages 2242- 2251, 2022.
- [Hauri et al., 2021] Sandro Hauri, Nemanja Djuric, Vladan Radosavljevic, and Slobodan Vucetic. Multi-modal tra- jectory prediction of nba players. In Proceedings of the IEEE/CVF Winter Conference on Applications of Com- puter Vision, pages 1640-1649, 2021.
- [Helbing and Molnar, 1995] Dirk Helbing and Peter Molnar. Social force model for pedestrian dynamics. Physical re- view E, 51(5):4282, 1995.
- [Korbmacher and Tordeux, 2022] Raphael Korbmacher and Antoine Tordeux. Review of pedestrian trajectory predic- tion methods: Comparing deep learning and knowledge- based approaches. IEEE Transactions on Intelligent Trans- portation Systems, 2022.
- [Kothari et al., 2021] Parth Kothari, Sven Kreiss, and Alexandre Alahi. Human trajectory forecasting in crowds: A deep learning perspective. IEEE Transactions on Intel- ligent Transportation Systems, 23(7):7386-7400, 2021.
- [Kretz et al., 2018] Tobias Kretz, Jochen Lohmiller, and Pe- ter Sukennik. Some indications on how to calibrate the so- cial force model of pedestrian dynamics. Transportation research record, 2672(20):228-238, 2018.
- [Le et al., 2017] Hoang M Le, Peter Carr, Yisong Yue, and Patrick Lucey. Data-driven ghosting using deep imitation learning. 2017.
- [Lefèvre et al., 2014] Stéphanie Lefèvre, Dizan Vasquez, and Christian Laugier. A survey on motion prediction and risk assessment for intelligent vehicles. ROBOMECH journal, 1:1-14, 2014.
- [Lerner et al., 2007] Alon Lerner, Yiorgos Chrysanthou, and Dani Lischinski. Crowds by example. In Computer graph- ics forum, volume 26, pages 655-664. Wiley Online Li- brary, 2007.
- [Long et al., 2017] Pinxin Long, Wenxi Liu, and Jia Pan. Deep-learned collision avoidance policy for distributed multiagent navigation. IEEE Robotics and Automation Letters, 2(2):656-663, 2017.
- [Mangalam et al., 2020] Karttikeya Mangalam, Harshayu Girase, Shreyas Agarwal, Kuan-Hui Lee, Ehsan Adeli, Ji- tendra Malik, and Adrien Gaidon. It is not the journey but the destination: Endpoint conditioned trajectory pre- diction. In Computer Vision-ECCV 2020: 16th European Conference, Glasgow, UK, August 23-28, 2020, Proceed- ings, Part II 16, pages 759-776. Springer, 2020.
- [Nikhil and Tran Morris, 2018] Nishant Nikhil and Brendan Tran Morris. Convolutional neural network for trajectory prediction. In Proceedings of the European Conference on Computer Vision (ECCV) Workshops, pages 0-0, 2018.
- [Paravarzar and Mohammad, 2020] Shahrokh Paravarzar and Belqes Mohammad. Motion prediction on self-driving cars: A review. arXiv preprint arXiv:2011.03635, 2020.
- [Pellegrini et al., 2009] Stefano Pellegrini, Andreas Ess, Konrad Schindler, and Luc Van Gool. You'll never walk alone: Modeling social behavior for multi-target tracking. In 2009 IEEE 12th international conference on computer vision, pages 261-268. IEEE, 2009.
- [Rudenko et al., 2020] Andrey Rudenko, Luigi Palmieri, Michael Herman, Kris M Kitani, Dariu M Gavrila, and Kai O Arras. Human motion trajectory prediction: A survey. The International Journal of Robotics Research, 39(8):895-935, 2020.
- [Russakoff et al., 2024] Alexander Russakoff, Kenny Miller, Vahid Mahzoon, Parsa Esmaeilkhani, Christine Cho, Jaf- far Alzeidi, Sandro Hauri, and Slobodan Vucetic. Court- sighttv: An interactive visualization software for labeling key basketball moments. In Proceedings of the 33rd ACM International Conference on Information and Knowledge Management, pages 5270-5274, 2024.
- [Salzmann et al., 2020] Tim Salzmann, Boris Ivanovic, Punarjay Chakravarty, and Marco Pavone. Trajectron++: Dynamically-feasible trajectory forecasting with heteroge- neous data. In Computer Vision-ECCV 2020: 16th Euro- pean Conference, Glasgow, UK, August 23-28, 2020, Pro- ceedings, Part XVIII 16, pages 683-700. Springer, 2020.
- [Tang and Jia, 2011] Ming Tang and Hongfei Jia. An ap- proach for calibration and validation of the social force pedestrian model. In Proceedings 2011 International Con- ference on Transportation, Mechanical, and Electrical En- gineering (TMEE), pages 2026-2031. IEEE, 2011.
- [Thalmann and Musse, 2012] Daniel Thalmann and So- raia Raupp Musse. Crowd simulation. Springer Science & Business Media, 2012.
- [Van Den Berg et al., 2010] Jur Van Den Berg, Stephen J Guy, Ming Lin, and Dinesh Manocha. Optimal reciprocal collision avoidance for multi-agent navigation. In Proc. of the IEEE International Conference on Robotics and Au- tomation, Anchorage (AK), USA, 2010.
- [Vaswani et al., 2017] Ashish Vaswani, Noam Shazeer, Niki Parmar, Jakob Uszkoreit, Llion Jones, Aidan N Gomez, Łukasz Kaiser, and Illia Polosukhin. Attention is all you need. Advances in neural information processing systems, 30, 2017.
- [Vemula et al., 2018] Anirudh Vemula, Katharina Muelling, and Jean Oh. Social attention: Modeling attention in human crowds. In 2018 IEEE international Conference on Robotics and Automation (ICRA), pages 4601-4607. IEEE, 2018.
- [Wei et al., 2018] Xiang Wei, Wei Lu, Lili Zhu, and Weiwei Xing. Learning motion rules from real data: Neural net- work for crowd simulation. Neurocomputing, 310:125- 134, 2018.
- [Weng et al., 2023] Erica Weng, Hana Hoshino, Deva Ra- manan, and Kris Kitani. Joint metrics matter: A better standard for trajectory forecasting. In Proceedings of the IEEE/CVF International Conference on Computer Vision, pages 20315-20326, 2023.
- [Wong et al., 2017] Sai-Keung Wong, Yu-Shuen Wang, Pao- Kun Tang, and Tsung-Yu Tsai. Optimized evacuation route based on crowd simulation. Computational Visual Media, 3(3):243-261, 2017.
- [Xu et al., 2022a] Chenxin Xu, Maosen Li, Zhenyang Ni, Ya Zhang, and Siheng Chen. Groupnet: Multiscale hyper- graph neural networks for trajectory prediction with rela- tional reasoning. In Proceedings of the IEEE/CVF Confer- ence on Computer Vision and Pattern Recognition, pages 6498-6507, 2022.
- [Xu et al., 2022b] Chenxin Xu, Weibo Mao, Wenjun Zhang, and Siheng Chen. Remember intentions: retrospective- memory-based trajectory prediction. In Proceedings of the IEEE/CVF Conference on Computer Vision and Pat- tern Recognition, pages 6488-6497, 2022.
- [Xue et al., 2018] Hao Xue, Du Q Huynh, and Mark Reynolds. Ss-lstm: A hierarchical lstm model for pedes- trian trajectory prediction. In 2018 IEEE Winter Confer- ence on Applications of Computer Vision (WACV), pages 1186-1194. IEEE, 2018.
- [Yan et al., 2024] Dapeng Yan, Gangyi Ding, Kexiang Huang, Chongzhi Bai, Lian He, and Longfei Zhang. En- hanced crowd dynamics simulation with deep learning and improved social force model. Electronics, 13(5):934, 2024.
- [Yao et al., 2020] Zhenzhen Yao, Guijuan Zhang, Dianjie Lu, and Hong Liu. Learning crowd behavior from real data: A residual network method for crowd simulation. Neurocomputing, 404:173-185, 2020.
- [Yi et al., 2016] Shuai Yi, Hongsheng Li, and Xiaogang Wang. Pedestrian behavior understanding and predic- tion with deep neural networks. In Computer Vision- ECCV 2016: 14th European Conference, Amsterdam, The Netherlands, October 11-14, 2016, Proceedings, Part I 14, pages 263-279. Springer, 2016.
- [Yu et al., 2020] Cunjun Yu, Xiao Ma, Jiawei Ren, Haiyu Zhao, and Shuai Yi. Spatio-temporal graph transformer networks for pedestrian trajectory prediction. In Computer Vision-ECCV 2020: 16th European Conference, Glasgow, UK, August 23-28, 2020, Proceedings, Part XII 16, pages 507-523. Springer, 2020.
- [Yu et al., 2023] Yingfei Yu, Wei Xiang, and Xiaogang Jin. Multi-level crowd simulation using social lstm. Computer Animation and Virtual Worlds, 34(3-4):e2180, 2023.
- [Yuan et al., 2021] Ye Yuan, Xinshuo Weng, Yanglan Ou, and Kris M Kitani. Agentformer: Agent-aware transform- ers for socio-temporal multi-agent forecasting. In Pro- ceedings of the IEEE/CVF International Conference on Computer Vision, pages 9813-9823, 2021.
- [Zhang et al., 2022] Guozhen Zhang, Zihan Yu, Depeng Jin, and Yong Li. Physics-infused machine learning for crowd simulation. In Proceedings of the 28th ACM SIGKDD Conference on Knowledge Discovery and Data Mining, pages 2439-2449, 2022.
- [Zhong et al., 2022] Jinghui Zhong, Dongrui Li, Zhixing Huang, Chengyu Lu, and Wentong Cai. Data-driven crowd modeling techniques: A survey. ACM Transactions on Modeling and Computer Simulation (TOMACS), 32(1):1- 33, 2022.
References were extracted automatically from the PDF and may contain errors.
Full text extracted automatically from the PDF; figures, tables and equations may differ. The PDF is the version of record.
1 Introduction
Predicting and modeling human trajectories is a substantial challenge across various domains [Rudenko et al., 2020]. It has diverse applications, including the development of realistic crowd simulations [Zhong et al., 2022], enabling safe navigation for self-driving cars [Lef`evre et al., 2014; Paravarzar and Mohammad, 2020], and supporting service robots [Chik et al., 2016]. This problem is also a topic of interest in sports analysis, such as in soccer [Le et al., 2017] and basketball [Hauri et al., 2021; Russakoff et al., 2024], thanks to the extensive availability of tracking systems in sports.
The most common problem in this field is pedestrian trajectory prediction [Korbmacher and Tordeux, 2022], where we briefly observe behaviors of pedestrians in a scene and use it to predict their short-term further movement. An example of a typical evaluation protocol [Alahi et al., 2016] is to observe 8 previous locations (equal to a few seconds) of the pedestrians and to predict their next 12 locations. For model evaluation, there are several benchmark data sets extracted from relatively short (several minutes) videos recorded at various locations worldwide. The most common performance metric is the distance between predicted and true trajectories.
There is a related problem called crowd simulation with numerous practical applications, such as urban planning [Aschwanden et al., 2008], crowd evacuation [Wong et al., 2017; Almeida et al., 2013], simulated environments for reinforcement learning in robotics [Francis and others, 2023], and game design [Thalmann and Musse, 2012]. In case of crowd simulation, a user can define the preferences and behaviors of each pedestrian, including their desired destinations. The movement of each pedestrian is determined by their current location, current velocity, goal location, and knowledge of the environment, such as other pedestrians and obstacles. In a common setting of this problem, the crowd simulator ingests this information at time step t and predicts positions of all agents for the subsequent time step t+1. After moving all agents to their new locations at time step t +1 with the simulator, we can continue applying the simulator for an arbitrary number of steps. This process is referred to as rollout.
Knowledge-based simulators, like the Optimal Reciprocal Collision Avoidance (ORCA) model [Van Den Berg et al., 2010] and the Social Force Model (SFM) [Helbing and Molnar, 1995], are classic crowd simulation approaches [Zhong et al., 2022]. The ORCA model uses a mathematical framework to ensure collision avoidance but fails to produce realistic behaviors. The SFM assumes that each pedestrian is subject to forces from other agents and obstacles, similar to how physical objects respond to forces in classical mechanics. While SFM generates more realistic trajectories than ORCA, it remains limited by quantitative metrics, as it only approximates pedestrian behavior.
Recent interest has emerged in using deep learning in crowd simulation [Wei et al., 2018; Yao et al., 2020; Zhang et al., 2022; Yan et al., 2024], although the research community in this area is much smaller compared to pedestrian trajectory prediction [Kothari et al., 2021]. Existing studies differ widely in datasets and evaluation protocols, making it difficult to establish reliable baselines. To address this, this paper proposes a unified evaluation protocol, and introduces several baselines, which are thoroughly evaluated to encourage further research in this field.
In this paper, we aim to bridge the gap between the crowd simulation and trajectory prediction communities. To achieve this, it is important to first highlight the key differences between the two tasks. Both involve predicting future trajectories based on historical data, but in crowd simulation, goal information for each pedestrian is known, whereas this information is typically unavailable in trajectory prediction. In trajectory prediction, observing several past locations is necessary to infer a pedestrian's walking behavior. In contrast, only two past locations are sufficient for crowd simulation to determine the current location and velocity, as walking behavior can either be predefined by the researcher or learned from historical data. Additionally, in trajectory prediction, the prediction horizon is limited to a few seconds because longer-term predictions are unreliable without knowledge of the pedestrians' desired destinations. In crowd simulation, however, the prediction horizon can be much longer due to the knowledge of destination, making a rollout approach a natural choice for generating trajectories. Despite these differences, crowd simulation could benefit from the advanced deep learning models, metrics, and benchmark datasets developed in trajectory prediction research. Nevertheless, adapting these models and metrics for crowd simulation is challenging due to the subtle distinctions between the two tasks.
Another key challenge addressed in this paper is developing deep learning crowd simulators despite the limited availability of real-world training data, which often consists of only a few minutes of observations. To address this, we utilize simulation-assisted machine learning by pretraining deep learning models on data generated by knowledge-based simulators and fine-tuning them using real-world data.
1.1 Contributions
The contributions of this work can be summarized as follows:
- Bridge the gap between crowd simulation and pedestrian trajectory prediction.
- Establish an evaluation framework inspired by pedestrian trajectory research to facilitate benchmarking in crowd simulation.
- Address data scarcity in crowd simulation by utilizing knowledge-based simulators.
- Thorough evaluation of several crowd simulation approaches in data-poor scenarios.
2 RelatedWork
2.1 Short-term trajectory Prediction
The advances in deep learning and the ability to learn complex patterns resulted in the emergence of data-driven pedestrian trajectory prediction approaches [Korbmacher and Tordeux, 2022]. Proposed deep learning models for this application include all popular architectures such as LSTM [Alahi et al., 2016; Xue et al., 2018], RNN [Vemula et al., 2018], CNN [Nikhil and Tran Morris, 2018; Yi et al., 2016], and Transformers [Giuliari et al., 2021; Yu et al., 2020; Yuan et al., 2021]. Some notable trajectory prediction models are Trajectron++ [Salzmann et al., 2020], PECNet [Mangalam et al., 2020], STAR [Yu et al., 2020], TransformerTF [Giuliari et al., 2021], MemoNet [Xu et al., 2022b], GroupNet [Xu et al., 2022a], Singular Trajectory [Bae et al., 2024b], and LMTraj [Bae et al., 2024a]. These models have been typically evaluated on several real pedestrian datasets such as ETH [Pellegrini et al., 2009] and UCY [Lerner et al., 2007] using metrics such as average displacement error
(ADE), final displacement error (FDE) and, less commonly, collision frequency.
2.2 Knowledge-based Crowd Simulators
Knowledge-based approaches such as popular Social Force Models [Helbing and Molnar, 1995] and Optimal Reciprocal Collision Avoidance (ORCA) [Van Den Berg et al., 2010] are collision-avoidant models grounded in mathematical rules, which contribute to their high level of generalizablity and interpretability. However, their reliance on rules poses a challenge in replicating real-life pedestrian behaviors. ORCA guarantees no collisions while ensuring movement towards the goal. SFM [Van Den Berg et al., 2010] considers each agent as a particle that interacts with other agents through attracting and repulsing social forces. Both ORCA and SFM have parameters that should be calibrated to create realistic behaviors. Most of the papers applying ORCA and SFM use the default values for their parameters and there are only a few that use calibration [Kretz et al., 2018; Tang and Jia, 2011].
2.3 Deep learning-based Crowd Simulators
A limited number of papers leverage deep learning models for crowd simulation [Zhong et al., 2022], employing models such as FNN [Wei et al., 2018], CNN [Yao et al., 2020], LSTM [Yu et al., 2023], Transformers [Yan et al., 2024], and graph neural networks [Zhang et al., 2022]. Various real-life datasets have been used such as SNU [Wei et al., 2018], ETH [Yan et al., 2024], UCY [Zhang et al., 2022], GC [Zhang et al., 2022], and a crowd evacuation scenario in an office environment [Yao et al., 2020]. Evaluation metrics are varied and can be classified into three categories: intermediate metrics, distance-based metrics, and collision-avoidance metrics. Intermediate metrics capture characteristics such as speed [Wei et al., 2018; Yan et al., 2024], density, cohesiveness, and collectiveness [Yao et al., 2020]. Distance-based metrics focus on the accuracy of predicted trajectories and include Mean Absolute Error, Optimal Transport Divergence, Maximum Mean Discrepancy [Zhang et al., 2022], KL-Divergence, and energy [Wei et al., 2018]. Collision-avoidance metrics include measures like collision rate [Yan et al., 2024] and the number of collisions [Wei et al., 2018]. Each of previous papers uses a different evaluation protocol with varying combinations of datasets, input-output representations, and metrics, making it difficult to compare the approaches.
3 Methodology
3.1 ProblemFormulation
Let us assume we are given a dataset covering T consecutive time steps where at each time step t we know the location pi(t) of every agent i in a scene. The velocity of agent i at time step t is vector vi(t) derived from the agent's two previous positions. The goal of agent i is represented by location gi of a desired destination at some point in future. We assume that agent i is present for a consecutive period Ti, which is a subset of [1, T]. We denote the positions of all N agents at time step t by P(t) = [p1(t), p2(t), . . . , pN(t)]. If agent i is not present in a scene at time t we record the value of pi(t) as NaN. Additionally, P(t1 : t2 ) represents the positions of all agents from time step t1 up to t2.
Given the knowledge of pedestrian locations during the last K time steps, P(t -K + 1 : t), and knowledge w(t) about the environment at time t, such as the location of obstacles, the objective of rollout is to predict locations of pedestrians at time t+1, ˆP(t+1). By accepting the prediction at time t+1 as truth, it is possible to repeat the process to predict ˆP(t + 2), and continue it for the arbitrary number of time steps. If the rollout is repeated L times, we denote the prediction as ˆP(tt+1 : tL).
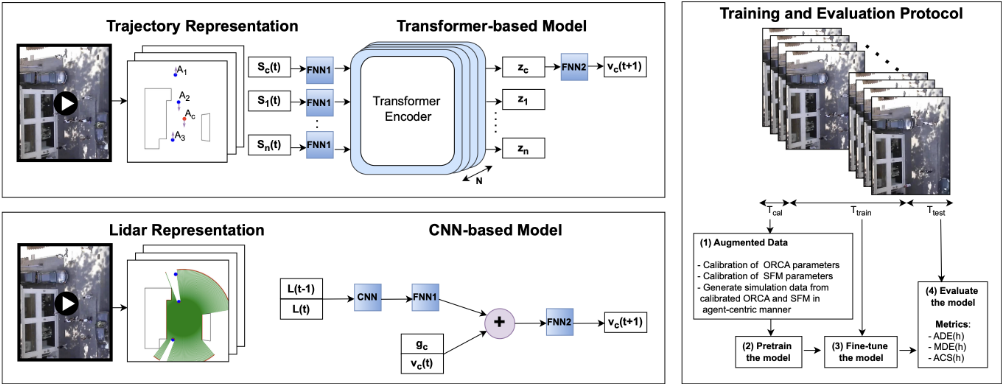
The quality of the prediction can be measured in multiple ways, and Section 3.4 describes the evaluation metrics used in this work. In order to create the prediction, several decisions have to be made. The first includes the choice of a prediction model. The model selection impacts how the input information (K historical locations and the environment) should be processed to provide input to the model. Questions about model selection and input representation are answered in Section 3.2. Each knowledge-based and deep-learning based has parameters that need to be fitted to training data. In pedestrian crowd simulation, the majority of existing benchmark data set are very short, on the order of several minutes. Thus, this creates an issue of learning from very limited training data. In Section 3.3 we introduce an approach for utilizing knowledge-based models to augment the training data for deep learning-based models. Putting all those steps together, we obtain a workflow for development and evaluation of deep learning crowd simulators, illustrated in Figure 1.
3.2 Modeling
Data Representation
To provide an input to a crowd simulator, we need to process the raw data. The common input representations in the trajectory prediction literature are trajectory representation [Alahi et al., 2016] and grid representation [Guo et al., 2022]. A less common representation is lidar representation [Van Den Berg et al., 2010]. In this paper, we propose and evaluate models based on trajectory and lidar representations as illustrated in Figure 1. We do not consider grid representation appropriate for crowd simulations because of the need to discretize the space, which creates quantization issues with the rollout.
Trajectory Representation: In this representation, we define a center agent and place it at the origin. Using only the last two time steps (K = 2), we record its location, velocity, and desired destination. We also record the location, velocity, and goal of each neighboring agent within a specified distance relative to the center agent. Thus, neighbor agent i at t is represented as a 6-dimensional vector Si(t) = (pi(t), vi(t), gi ). All agent vectors are concatenated and provided as an input to the simulation model. We note that including information about non-pedestrian moving objects and static obstacles or other information about the environment is not straightforward for this representation. This is why it is common in the pedestrian trajectory prediction community to ignore the obstacles. We adopt this common practice for the deep learning models that use trajectory representation.
Lidar Representation: In this representation, we imagine that a 2D laser scanner is positioned at the center agent. The scanner has an angular resolution of θ degrees, resulting in 360/θ distance measurements per scan, defined as the distance to the nearest object in a given direction. We refer to this measurement as L(t). If no obstacle is detected within the maximum sensing range of the imagined lidar, the distance is set to this maximum distance. With this representation, the center agent is aware both of other pedestrians and of any moving or static obstacles. For crowd simulation, we use L(t - 1) and L(t) as a model input. While the lidar representation is not common in trajectory prediction, we think it is an appealing option for crowd simulation.
Deep Learning Models
In our experiments, we employed different deep learning model depending on input representation: (1) a transformer model for the trajectory representation and (2) a CNN model for the lidar representation. They will be described next. For benchmarking, we also used a modified version of the popular Social-LSTM [Alahi et al., 2016] trajectory prediction model with the trajectory representation in our experiments, and we outline this model in Section 4.2.
Transformer-based model: As illustrated in Figure 1, inputs to the model are the 6-dimensional vector Sc(t) of the center agent and corresponding vectors of its neighbors Si(t). Each agent's vector is first passed to a shared feedforward neural network (FNN1), which transforms it into a hidden representation of dimension nhid. Subsequently, a Transformer encoder [Vaswani et al., 2017], incorporating a multihead attention mechanism, generates embeddings that are context-aware and capture the interactions among the agents. The embedding associated with the center agent, denoted as zc ∈ Rnhid , is extracted and passed through another feedforward neural network (FNN2) of dimension Rnhid×2 to predict the next velocity of the center agent ˆ vc(t + 1), which is then used to predict its next position ˆ pc(t+1). By repeatedly using every agent as the center agent, we obtain ˆP(t + 1).
CNN-based model: We developed a CNN-based model illustrated in Figure 1 as a crowd simulator based on lidar representation. The model inputs (L(t - 1), L(t)) are sufficient to capture the locations and relative velocities of all agents as well as the geometry and position of static obstacles. The input is passed through a series of convolutional layers, which slide over the angular dimensions, followed by an FNN layer. This resulting embedding is concatenated with the goal destination gc and current velocity vc(t) of the center agent. The augmented embedding is passed to an FNN to predict the next velocity of the center agent ˆ vc(t + 1), which is then used to predict its next position ˆ pc(t + 1). By repeating the process for every agent, we obtain ˆP(t + 1).
The loss function for both deep learning models is
3.3 Transfer Learning
One of the primary challenges associated with deep learning models is their requirement for extensive amounts of realworld pedestrian trajectory data for training, which is often not readily available. In our case, the benchmark datasets have only minutes of data. To address this limitation, we use knowledge-based crowd simulators to generate large quantities of augmented training data and pretrain a deep learning model on the augmented data before fine-tuning it on realworld data. We hypothesized that training on augmented data will help models gain knowledge about collision avoidance and general principles of pedestrian behavior, allowing them to be rapidly fine-tuned on small quantities of real-life data.
Parameter Calibration: Before we generate augmented data, we calibrate ORCA and SFM parameters on the first Tcal seconds of real-life training data. Our experiments showed that Tcal = 10 is sufficient because each model has only a few parameters needing calibration. For each parameter in either knowledge-based model, we explored a set of candidates. We accepted a set of parameters that resulted in the smallest average displacement error, defined as the mean Euclidean distance between predicted and ground truth agent positions after rollout. Information about each calibrated parameter for ORCA and SFM is listed in the Appendix(B) 1 .
Data Augmentation: Our process to create augmented data was inspired by [Long et al., 2017], who used calibrated ORCA [Van Den Berg et al., 2010] to create a large dataset to train a neural network. To create one augmented data point, we place the center agent at the origin and place up to 10 neighboring agents at random locations around the center agent, as shown in Figure 1. We generate agents' velocities at random and set each agent's goal at a random location. There are no static obstacles in the generated data. Once the scene is set, we run calibrated ORCA or SFM for a single time step to avoid overemphasizing linear behaviors and increase generalizability. We generated ORCA-augmented and SFM-augmented datasets.
1 Appendix is provided in:
https://vmahzoon76.github.io/DL-Crowd-Sim/appendix.pdf
Pretraining and Fine-tuning: Depending on the model, we convert the augmented data into their trajectory or lidar representation. Then, we pretrain the model on ORCAor SFM-augmented data. It is followed by fine-tuning on real-world data. This fine-tuning process adjusts the model weights to better align with actual pedestrian behaviors and environmental nuances present in the real-world data, thereby enhancing the model's accuracy and robustness.
3.4 EvaluationMetrics
Numerous metrics have been proposed in trajectory prediction and crowd simulation literature [Zhong et al., 2022; Kothari et al., 2021; Weng et al., 2023], often complicating benchmarking efforts. We think that crowd simulation community should strive to use a small set of simple metrics. In this paper, we propose to use only three metrics: distancebased, goal-reaching, and collision-severity.
In order to evaluate a simulator, we can start the simulator at any time step ts and roll it out for any number of steps h. A good simulator will produce trajectories that closely resemble real trajectories from time ts + 1 to ts + h for any ts and h. Thus, we run simulations with different ts and h and average out their performance.
Average Displacement Error (ADE): Given simulation start time ts and simulation horizon h, we define
where Tj is the set of time steps during which agent j is present within the rollout interval [ts + 1, ts + h], and N is the number of agents present during the rollout. ADE(ts, h) is the average discrepancy between the predicted and actual positions of all agents present during the rollout.
Minimum Displacement Error (MDE): Given simulation start time ts and simulation horizon h, we define
MDE measures how close agents get to their final position during the rollout. We note that MDE is similar to the Final Displacement Error (FDE), which is popular in trajectory prediction [Alahi et al., 2016]. However, while FDE measures the difference between the last predicted position and the last actual position, MDE evaluates how close the simulator gets to the final destination during the rollout.
Average Collision Severity (ACS): Agents in our work are modeled as disks with radius r, with the distance between two agents defined as the distance between the centers of their disks. A collision is considered to occur when the disks overlap. Given the distance d between two agents i and j at time step t, we define soft collision severity between agents i and j as the ramp function
and hard collision severity as the step function
While hard CS counts number of collisions, soft CS puts a smaller weight to minor collisions. We note that CS metrics do not need knowledge of ground truth positions and they solely focus on occasions when simulated agents collide.
Given simulation start time ts and simulation horizon h, we define
where HT = [ts +1, ts +h] and Agents(t) is a set of agents existing at time t. ACS measures the average collision severity experienced by agents across all time steps during a rollout. In the results section, we refer to ACS using soft CS as sACS and the one using hard CS as hACS.
Averaged Metrics: For a given h, we run multiple rollouts by shifting ts across time steps. For example, starting from ts = 1, we perform a rollout to obtain ˆP(1:h), then repeated the process from ts = 2 to obtain ˆP(2 : h+1), continuing this until the final rollout in which ˆP(T - h+ 1 :T) is obtained. We then average the metrics over all rollouts for a given h to obtain ADE(h), MDE(h) and ACS(h).
Nonlinear ADE(h): In our benchmark datasets, most pedestrians exhibit linear behavior, allowing even the simple simulators to achieve a low ADE(h). Consequently, we identify non-linear agents in each dataset and compute ADE(h) on them, denoting it as nADE(h). An agent is non-linear if the area between the ground truth trajectory and a straight line from the pedestrian's starting point to their goal exceeds a threshold.
4 Results
4.1 Datasets
Real-world data: We used four datasets popular in pedestrian trajectory prediction research: ETH, Hotel [Pellegrini et al., 2009], Zara1, and Zara2. They contain manually extracted trajectories from static camera videos ranging from 6 to 13 minutes. All datasets use a time step of 0.4s. Since the datasets do not contain information about obstacles, we manually extracted them from original data in form of polygons. Appendix(D) contains more information about all four datasets. It is interesting to note that related work [Alahi et al., 2016] only considers pedestrians that exist during the full prediction horizon, thus corrupting the data. In contrast, we do not remove any pedestrians during training or simulations.
Augmented data generation: For pretraining (see Section 3.3), for both ORCA and SFM, we generated 500, 000 training, 50, 000 validation, and 50, 000 test data points.
4.2 Experimental Design
Given that there are 4 different datasets, we used two types of evaluation. In the first, for each dataset we trained models on the first 50% of the dataset and tested them on the last 50%. This evaluated how a simulator behaves when applied under known conditions. We refer to this as the within distribution evaluation. In the second, we trained the models on three datasets and tested on the remaining dataset. This evaluated how a simulator trained in one environment will perform in a different environment. We refer to this as the outside distribution evaluation. In either case, to calibrate ORCA and SFM models we used only the first 10 seconds of the training data.
Crowd Simulation Models
We used the following crowd simulation models:
CVM: Constant Velocity Model ("CVM") is a simple baseline model that maintains the agent's current speed and directs it towards the goal. In our datasets, the majority of agents exhibit linear behavior, allowing this baseline to achieve a low ADE(h).
SFM and ORCA: These are calibrated knowledge-based models on the first 10 seconds of training data. ORCA implementation allows for inclusion of information about static obstacles. Thus, we evaluated ORCA versions that include obstacles ("Vis Obst") and that ignore them ("Invis Obst"). Our implementation of SFM was blind to obstacles.
S-LSTM: We adapted Social-LSTM [Alahi et al., 2016], a well-known benchmark in trajectory prediction that uses trajectory data representation. We modified the original model for K = 2 time steps as input. We concatenated the resulting LSTM embedding with the center agent's goal location and passed this to feedforward layers to predict the velocity.
CNN and Transformer: "CNN" refers to a CNN-based model that inputs lidar representation, while "Transf" refers to transformer-based model that uses trajectory representation, as described in 3.2. Suffix "Scratch" means that the model was not pretrained on augmented data, while "Fine" means that model was pretrained, and it is followed by suffix "ORCA" or "SFM" that specifies which knowledge-based model was used to create the pretraining data. For instance, "Transf Fine SFM" denotes a Transformer-based model that was pretrained on the SFM-augmented dataset and fine-tuned on real-world training data. For more details about the models, training, and lidar implementation, refer to Appendix(C).
| Data | ORCA | SFM | ||||
|---|---|---|---|---|---|---|
| Model | CVM | Transf | CNN | CVM | Transf | CNN |
| Training Data | 0.359 | 0.002 | 0.055 | 0.508 | 0.000 | 0.017 |
| Test Data | 0.359 | 0.026 | 0.061 | 0.508 | 0.005 | 0.021 |
| Method | ADE | nADE | MDE | hACS | sACS |
|---|---|---|---|---|---|
| CVM | 1.44 | 2.83 | 0.11 | 3.57 | 1.08 |
| ORCAVis Obst | 1.41 | 2.02 | 0.16 | 0.00 | 0.00 |
| ORCA Invis Obst | 1.53 | 2.57 | 0.16 | 0.05 | 0.00 |
| SFM Invis Obst | 1.41 | 2.16 | 0.13 | 0.00 | 0.00 |
| S-LSTM | 1.11 | 1.29 | 0.13 | 7.50 | 2.67 |
| ETH Transf Scratch | 1.36 | 2.00 | 0.19 | 7.46 | 2.97 |
| Transf Fine ORCA | 1.11 | 1.66 | 0.07 | 3.57 | 1.08 |
| Transf Fine SFM | 0.85 | 1.19 | 0.05 | 0.41 | 0.10 |
| CNN Scratch | 1.21 | 1.53 | 0.12 | 7.05 | 1.97 |
| CNN Fine ORCA | 0.87 | 1.09 | 0.06 | 5.33 | 1.02 |
| CNN Fine SFM | 0.89 | 1.06 | 0.06 | 3.25 | 0.79 |
| CVM | 1.31 | 2.21 | 0.08 | 0.72 | 0.24 |
| ORCAVis Obst | 1.29 | 1.94 | 0.12 | 0.00 | 0.00 |
| ORCA Invis Obst | 1.37 | 2.20 | 0.12 | 0.00 | 0.00 |
| SFM Invis Obst | 1.36 | 2.10 | 0.10 | 0.00 | 0.00 |
| S-LSTM | 1.86 | 2.11 | 0.12 | 2.58 | 0.97 |
| Zara1 Transf Scratch | 1.34 | 1.70 | 0.12 | 2.98 | 0.58 |
| Transf Fine ORCA | 1.44 | 1.87 | 0.06 | 1.77 | 0.68 |
| Transf Fine SFM | 1.20 | 1.48 | 0.02 | 0.08 | 0.01 |
| CNN Scratch | 1.73 | 2.00 | 0.12 | 2.01 | 0.56 |
| CNN Fine ORCA | 1.32 | 1.78 | 0.04 | 2.01 | 0.37 |
| CNN Fine SFM | 1.18 | 1.45 | 0.03 | 1.45 | 0.35 |
4.3 Results
Pretraining Results
Table 1 shows the performance of our CNN and transformer pretrained on augmented training data generated by ORCA and SFM and tested on the augmented test data. We can see that transformer was more accurate than CNN, and that both deep learning models were superior to CVM. Transformer achieved near zero error on training data, while CNN had considerable error on the training data, possibly indicating higher capacity of the transformer approach for overfitting.
Fine-tuning Results
Table 2 shows the performance of fine-tuned, scratch, knowledge-based, and baseline models on ETH and Zara1 in within distribution evaluation. Table 3 compares the same models on ETH data in outside distribution evaluation. The time horizon for these results was set to h = ∞, meaning that the rollouts were going from ts to T. We provide results for the same models on other test datasets in the Appendix(E).
The results show that fine-tuned models performed better than models trained from scratch on real-world data. While for ADE the improvement due to fine-tuning was relatively small, it was much more pronounced for nADE. A low MDE means that agents were able to reach their goal locations during rollouts. While all models had relatively low MDE, finetuned models had the lowest MDE. It is also notable from the results that fine-tuned transformers had lower ADE, nADE, and MDE than fine-tuned CNN on within distribution evaluation (Table 2). Interestingly, the outcome changed on the outside distribution evaluation in Table 3, where fine-tuned CNN had the lowest ADE, nADE, and MDE.
| ETH | Method | ADE | nADE | MDE | hACS | sACS |
|---|---|---|---|---|---|---|
| CVM | 1.38 | 3.16 | 0.11 | 3.46 | 1.14 | |
| ORCAVis Obst | 1.35 | 2.10 | 0.16 | 0.00 | 0.00 | |
| ORCA Invis Obst | 1.49 | 2.83 | 0.16 | 0.02 | 0.00 | |
| SFM Invis Obst | 1.62 | 2.44 | 0.14 | 0.00 | 0.00 | |
| S-LSTM | 1.65 | 2.47 | 0.08 | 7.43 | 2.32 | |
| Transf Scratch | 1.71 | 2.50 | 0.08 | 7.23 | 2.23 | |
| Transf Fine ORCA | 1.62 | 2.32 | 0.06 | 2.76 | 0.88 | |
| Transf Fine SFM | 1.25 | 1.65 | 0.04 | 1.36 | 0.16 | |
| CNN Scratch | 1.82 | 2.08 | 0.05 | 6.46 | 1.61 | |
| CNN Fine ORCA | 1.65 | 2.27 | 0.05 | 3.57 | 0.87 | |
| CNN Fine SFM | 1.11 | 1.39 | 0.03 | 3.80 | 0.78 |
| Method | Zara1 | Zara2 |
|---|---|---|
| CVM | 6 | 7 |
| SFM | 6 | 6 |
| S-LSTM | 5 | 6 |
| Transf Fine SFM | 4 | 5 |
| CNN Fine SFM | 0 | 0 |
Based on the collision metrics, we can see that ORCA and SFM performed with virtually no collisions. This is due to the nature of these knowledge-based simulators, where ORCA guarantees no collisions and SFM has parameters that can be tuned to make agents collision avoidant. Deep learning models result in collisions, but the numbers (expressed in percent in the tables) are relatively small. Fine-tuned models retained relatively low values for these metrics. sACS values were lower than hACS, indicating that many collisions were minor. When comparing "CNN Scratch" and "CNN Fine ORCA" on Zara1 in Table 2, we see that both had the same value of hACS but latter had a lower sACS, indicating that "CNN Scratch" had more severe collisions than "CNN Fine ORCA".
When comparing models pretrained on ORCA data with those pretrained on SFM, we found that training on SFM data produced better results. Thus, we continue the rest of our analysis with models pretrained on SFM data. Line plots in Figures 2 and 3 compare performance of different models for each metric across varying values of h, highlighting the evolution of these metrics as h increases. For readability, only a subset of representative models is shown. As h grows, predicting the trajectory of an agent becomes increasingly challenging. This trend is evident as the ADE(h), nADE(h), and Soft Collision metrics (sACS) generally increased across all methods with increasing h.
Fine-tuned models consistently outperformed other methods across all values of h, with the performance gap widening notably in within-evaluation scenario as h increased. In the ADE(h) and nADE(h) plots of Figure 2, we observe that for small values of h, most methods performed similarly, but as h increased particularly after h = 20, the "Scratch Transformer" and CVM methods exhibited a much steeper deterioration compared to others.
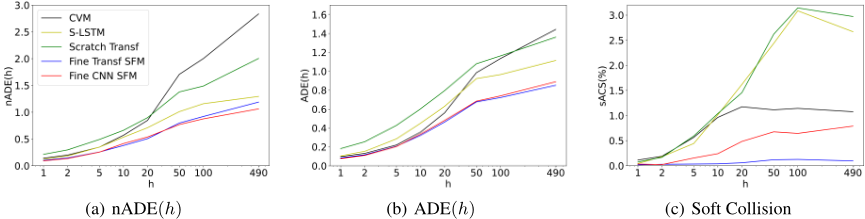
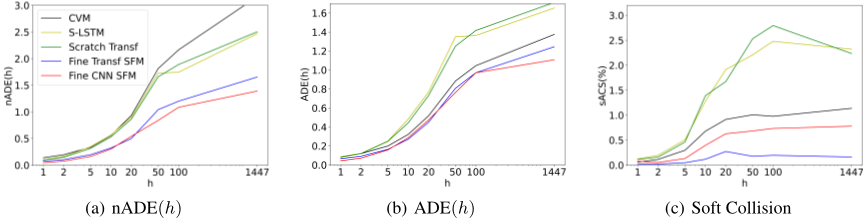
The soft collision metric indicates that as the horizon h grew, the risk of collisions increased, especially for models that were not pretrained like "Social LSTM" and "Transformer Scratch". Fine-tuned CNN and transformer models pretrained on the SFM augmented data managed to keep the soft collision metric relatively low, demonstrating their effectiveness in maintaining safe and realistic simulations even as prediction horizon increased.
Table 4 shows the number of collisions with static obstacles for different models on Zara1 and Zara2. Fine-tuned CNN model outperformed the others, with zero collisions across both datasets. This superior performance is attributed to the lidar representation, which is aware of the obstacles in the environment. In contrast, models like CVM, Social-LSTM and Fine-tuned Transformer, which lack this environmental awareness, exhibited a higher number of collisions with static obstacles. Short-term trajectory prediction community typically overlooks the role of obstacles, primarily focusing on agent location and behavior without considering the environment. In our approach, we incorporated lidar representation with a CNN because we believe that the environment significantly influences agent behavior and trajectories.
5 Limitations and FutureWork
Our work has several limitations that warrant further research. First, obstacles were not incorporated into the trajectory representation, leaving the exploration of methods to integrate obstacle and environmental information with this representation for future work. Additionally, we evaluated a limited set of deep learning models, focusing on three representative architectures with two input representations. While we demonstrated how existing trajectory prediction models could be repurposed for crowd simulation, a broader exploration of models remains an avenue for future work.
The benchmark datasets used in this study are another limitation, as they are not particularly diverse or challenging. The data predominantly feature street scenes with linear trajectories in relatively uncrowded environments. Expanding the diversity and complexity of datasets is essential for advancing benchmarking in both the trajectory prediction and crowd simulation communities.
6 Conclusion
In this work, we presented an evaluation framework for crowd simulation models. We leveraged results from the closely related field of pedestrian trajectory prediction. We compared various crowd simulation models, including deep learning models, knowledge-based models, and simulation-assisted deep learning models. Our results indicate that pretraining deep learning-based simulators on augmented data generated by knowledge-based models could lead to significant performance improvements when real-world datasets are small. Agent behavior has many nuances and dimensions. While one simulator could be good at reaching goal locations, it may cause many collisions with agents or obstacles. Because of this, it is important to consider an ensemble of metrics when evaluating crowd simulators. From our results, we conclude that using multiple metrics reveals the strengths and weaknesses of individual simulators, which could help practitioners choose the simulator that suits their needs best.
Contribution Statement
Vahid Mahzoon and Abigail Liu contributed equally to this paper.
@inproceedings{ijcai2025p23,
  title     = {Deep Learning-Based Pedestrian Simulation with Limited Real-World Training Data: An Evaluation Framework},
  author    = {Mahzoon, Vahid and Liu, Abigail and Vucetic, Slobodan},
  booktitle = {Proceedings of the Thirty-Fourth International Joint Conference on
               Artificial Intelligence, {IJCAI-25}},
  publisher = {International Joint Conferences on Artificial Intelligence Organization},
  editor    = {James Kwok},
  pages     = {196--204},
  year      = {2025},
  month     = {8},
  note      = {Main Track},
  doi       = {10.24963/ijcai.2025/23},
  url       = {https://doi.org/10.24963/ijcai.2025/23},
}
TY - CPAPER TI - Deep Learning-Based Pedestrian Simulation with Limited Real-World Training Data: An Evaluation Framework AU - Mahzoon, Vahid AU - Liu, Abigail AU - Vucetic, Slobodan T2 - Proceedings of the Thirty-Fourth International Joint Conference on Artificial Intelligence, IJCAI-25 PB - International Joint Conferences on Artificial Intelligence Organization PY - 2025 SP - 196 EP - 204 DO - 10.24963/ijcai.2025/23 UR - https://doi.org/10.24963/ijcai.2025/23 ER -Copied
Machine-readable versions of this paper, for tools and AI agents:





