
Beyond Individual and Point: Next POI Recommendation via Region-aware Dynamic Hypergraph with Dual-level Modeling
Proceedings of the Thirty-Fourth International Joint Conference on Artificial Intelligence. Main Track. Pages 3081-3089.
https://doi.org/10.24963/ijcai.2025/343
Keywords
- Data Mining: DM: Mining graphs
- Data Mining: DM: Mining spatial and/or temporal data
- Data Mining: DM: Applications
- Data Mining: DM: Information retrieval
Abstract
Next POI recommendation contributes to the prosperity of various intelligent location-based services. Existing studies focus on exploring sequential patterns and POI interactions using sequential and graph-based methods to enhance recommendation performance. However, they don't effectively exploit geographical information. In addition, methods that focus on modeling mobility patterns using individual limited data may suffer from data sparsity and the information cocoons problem. Moreover, most graph structures focus on adjacent nodes, failing to capture potential high-order associations among POIs. To address these challenges, we propose the Region-aware dynamic Hypergraph learning method with Dual-level interaction Modeling (ReHDM), which exploits users' dynamic mobility beyond individual and point. Specifically, ReHDM utilizes regional encoding to mine the potential spatial relationships among POIs with coarse-grained geographical information. By incorporating POI-level and trajectory-level associations within a hypergraph convolutional network, ReHDM comprehensively captures cross-user collaborative information. Furthermore, ReHDM captures not only dependencies among POIs within each trajectory for a single user, but also the high-order collaborative information across individual user trajectories and associated users' trajectories. Experimental results on three public datasets demonstrate the superiority of ReHDM to the state-of-the-art.
- [An et al., 2024] Jingmin An, Ming Gao, and Jiafu Tang. Mvsthgl: Multi-view hypergraph learning with spatial- temporal periodic interests for next poi recommendation. TOIS, 42(6):1-29, 2024.
- [Bai et al., 2021] Song Bai, Feihu Zhang, and Philip HS Torr. Hypergraph convolution and hypergraph attention. Pattern Recognition, 110:107637, 2021.
- [Cho et al., 2011] Eunjoon Cho, Seth A Myers, and Jure Leskovec. Friendship and mobility: user movement in location-based social networks. In SIGKDD, pages 1082- 1090, 2011.
- [Feng et al., 2015] Shanshan Feng, Xutao Li, Yifeng Zeng, Gao Cong, Yeow Meng Chee, and Quan Yuan. Person- alized ranking metric embedding for next new poi recom- mendation. In IJCAI, pages 2069-2075, 2015. IJCAI
- [Gao et al., 2022] Yue Gao, Yifan Feng, Shuyi Ji, and Ron- grong Ji. Hgnn+: General hypergraph neural networks. TPAMI, 45(3):3181-3199, 2022.
- [Han et al., 2020] Haoyu Han, Mengdi Zhang, Min Hou, Fuzheng Zhang, Zhongyuan Wang, Enhong Chen, Hong- wei Wang, Jianhui Ma, and Qi Liu. Stgcn: a spatial- temporal aware graph learning method for poi recommen- dation. In ICDM, pages 1052-1057, 2020.
- [Lai et al., 2023] Yantong Lai, Yijun Su, Lingwei Wei, Gaode Chen, Tianci Wang, and Daren Zha. Multi-view spatial-temporal enhanced hypergraph network for next poi recommendation. In DASFAA, pages 237-252, 2023.
- [Lai et al., 2024] Yantong Lai, Yijun Su, Lingwei Wei, Tianqi He, Haitao Wang, Gaode Chen, Daren Zha, Qiang Liu, and Xingxing Wang. Disentangled contrastive hyper- graph learning for next poi recommendation. In SIGIR, pages 1452-1462, 2024.
- [Li et al., 2024] Shuzhe Li, Wei Chen, Bin Wang, Chao Huang, Yanwei Yu, and Junyu Dong. Mcn4rec: Multi- level collaborative neural network for next location rec- ommendation. TOIS, 42(4):1-26, 2024.
- [Lian et al., 2020] Defu Lian, Yongji Wu, Yong Ge, Xing Xie, and Enhong Chen. Geography-aware sequential lo- cation recommendation. In SIGKDD, pages 2009-2019, 2020.
- [Liu et al., 2023] Shaohua Liu, Yu Qi, Gen Li, Mingjian Chen, Teng Zhang, Jia Cheng, and Jun Lei. Stgin: Spatial- temporal graph interaction network for large-scale poi rec- ommendation. In CIKM, pages 4120-4124, 2023.
- [Luo et al., 2021] Yingtao Luo, Qiang Liu, and Zhaocheng Liu. Stan: Spatio-temporal attention network for next location recommendation. In WWW, pages 2177-2185, 2021.
- [Qin et al., 2022a] Yanjun Qin, Yuchen Fang, Haiyong Luo, Fang Zhao, and Chenxing Wang. Next point-of-interest recommendation with auto-correlation enhanced multi- modal transformer network. In SIGIR, pages 2612-2616, 2022.
- [Qin et al., 2022b] Yingrong Qin, Chen Gao, Yue Wang, Shuangqing Wei, Depeng Jin, Jian Yuan, and Lin Zhang. Disentangling geographical effect for point-of-interest rec- ommendation. TKDE, 35(8):7883-7897, 2022.
- [Rao et al., 2022] Xuan Rao, Lisi Chen, Yong Liu, Shuo Shang, Bin Yao, and Peng Han. Graph-flashback network for next location recommendation. In SIGKDD, pages 1463-1471, 2022.
- [Rendle et al., 2010] Steffen Rendle, Christoph Freuden- thaler, and Lars Schmidt-Thieme. Factorizing personal- ized markov chains for next-basket recommendation. In WWW, pages 811-820, 2010.
- [Sun et al., 2020] Ke Sun, Tieyun Qian, Tong Chen, Yile Liang, Quoc Viet Hung Nguyen, and Hongzhi Yin. Where to go next: Modeling long-and short-term user preferences for point-of-interest recommendation. In AAAI, pages 214-221, 2020.
- [Vaswani et al., 2017] Ashish Vaswani, Noam Shazeer, Niki Parmar, Jakob Uszkoreit, Llion Jones, Aidan N. Gomez, Łukasz Kaiser, and Illia Polosukhin. Attention is all you need. In AAAI, pages 1-11, 2017.
- [Wang et al., 2022a] Xiaolin Wang, Guohao Sun, Xiu Fang, Jian Yang, and Shoujin Wang. Modeling spatio-temporal neighbourhood for personalized point-of-interest recom- mendation. In IJCAI, pages 3530-3536, 2022. IJCAI
- [Wang et al., 2022b] Zhaobo Wang, Yanmin Zhu, Haobing Liu, and Chunyang Wang. Learning graph-based disen- tangled representations for next poi recommendation. In SIGIR, pages 1154-1163, 2022.
- [Wu et al., 2020] Yuxia Wu, Ke Li, Guoshuai Zhao, and Xueming Qian. Personalized long-and short-term pref- erence learning for next poi recommendation. TKDE, 34(4):1944-1957, 2020.
- [Xia et al., 2021] Xin Xia, Hongzhi Yin, Junliang Yu, Qinyong Wang, Lizhen Cui, and Xiangliang Zhang. Self-supervised hypergraph convolutional networks for session-based recommendation. In AAAI, pages 4503- 4511, 2021.
- [Xie and Chen, 2023] Jiayi Xie and Zhenzhong Chen. Hier- archical transformer with spatio-temporal context aggre- gation for next point-of-interest recommendation. TOIS, 42(2):1-30, 2023.
- [Yan et al., 2023] Xiaodong Yan, Tengwei Song, Yifeng Jiao, Jianshan He, Jiaotuan Wang, Ruopeng Li, and Wei Chu. Spatio-temporal hypergraph learning for next poi recommendation. In SIGIR, pages 403-412, 2023.
- [Yang et al., 2014] Dingqi Yang, Daqing Zhang, Vincent W Zheng, and Zhiyong Yu. Modeling user activity preference by leveraging user spatial temporal characteristics in lbsns. TSMC, 45(1):129-142, 2014.
- [Yang et al., 2020] Dingqi Yang, Benjamin Fankhauser, Paolo Rosso, and Philippe Cudre-Mauroux. Location pre- diction over sparse user mobility traces using rnns. In IJ- CAI, pages 2184-2190, 2020.
- [Yang et al., 2022] Song Yang, Jiamou Liu, and Kaiqi Zhao. Getnext: trajectory flow map enhanced transformer for next poi recommendation. In SIGIR, pages 1144-1153, 2022.
- [Zhang et al., 2022] Lu Zhang, Zhu Sun, Ziqing Wu, Jie Zhang, Yew Soon Ong, and Xinghua Qu. Next point-of- interest recommendation with inferring multi-step future preferences. In IJCAI, pages 3751-3757, 2022.
- [Zhang et al., 2024] Jixiao Zhang, Yongkang Li, Ruotong Zou, Jingyuan Zhang, Renhe Jiang, Zipei Fan, and Xuan Song. Hyper-relational knowledge graph neural network for next poi recommendation. WWW, 27(4):46, 2024.
- [Zhao et al., 2020] Pengpeng Zhao, Anjing Luo, Yanchi Liu, Jiajie Xu, Zhixu Li, Fuzhen Zhuang, Victor S Sheng, and Xiaofang Zhou. Where to go next: A spatio-temporal gated network for next poi recommendation. TKDE, 34(5):2512-2524, 2020.
References were extracted automatically from the PDF and may contain errors.
Full text extracted automatically from the PDF; figures, tables and equations may differ. The PDF is the version of record.
1 Introduction
The adoption of mobile technologies has driven the growth of location-based social networks(LBSNs). Popular LBSNs like Foursquare and Gowalla generate extensive user check-in data, fostering POI recommender systems to predict potential locations of interest. Next Point-of-Interest (POI) recommendation has gained popularity for personalized route planning, targeted advertising, and business recommendations, drawing significant attention from academia and industry.
∗Corresponding author.
In recent years, how to enhance the performance of the next POI recommendation has been extensively studied. Traditional methods use sequential models[Yang et al., 2020; Qin et al., 2022a] to mine transitions and sequential dependencies, while graph-based[Wang et al., 2022a] approaches refine POI representations with collaborative information. Despite the effectiveness of existing methods, there still exist some limitations that need to be better explored.
Some works address the sparsity issue by incorporating spatial-temporal[Qin et al., 2022b], social, and sequential features[Xie and Chen, 2023]. However, they focus on individual mobility patterns, limited by the information cocoons problem and the sparsity issue. Graph Neural Networks(GNNs)[Yang et al., 2022; Zhang et al., 2024; Lai et al., 2024] mitigate sparsity by leveraging global historical check-ins and refining POI representations through collaborative relations. However, static graph construction struggles with extreme sparsity. Moreover, they neglect higherorder connections among non-adjacent POIs and overlook dynamic sequential dependencies, which are crucial for capturing complex mobility patterns and user interest changes.
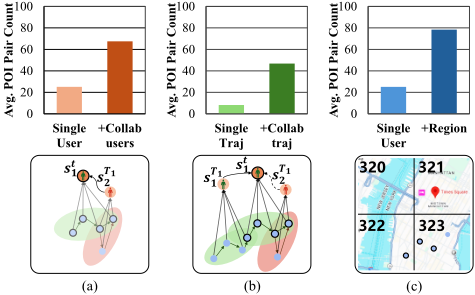
Motivation. In view of the limitations of existing approaches, we aim to enrich the mobility modeling from collaborative users rather than a single user. Besides, we attempt to model mobility patterns from both POI level and trajectory level. Additionally, we want to capture more potential associations among POIs from the coarse granularity. To validate the idea above, we analyzed the number of POI pairs associated with specific relationships on a real-world dataset. As shown in Figure 1(a), the average number of POI pairs in a single user's visit records is 25.1, which increases significantly when collaborative users are considered. Similarly, in Figure 1(b), the number of POI pairs within a single trajectory is relatively small but grows substantially with the inclusion of collaborative trajectories. Additionally, in Figure 1(c), incorporating POIs located within the same region also leads to an increase in the number of POI pairs. These findings suggest that leveraging collaborative users, dual-level modeling, and regional partitioning have the potential to effectively mitigate the sparsity issue and uncover underlying associations.
To this end, we propose a novel region-aware dynamic hypergraph learning method with dual-level modeling for next POI recommendation (ReHDM). It explores dynamic spatio-temporal mobility beyond individual and point, considering associations among POIs, users, and trajectories. Specifically, it leverages coarse-grained geographical influence through quadkey-based regional encoding to explore potential spatial associations among POIs. Then, a hypergraph convolutional network integrated with a transformer is designed to dynamically learn spatio-temporal patterns at both POI level and trajectory level, and capture cross-user collaborative information for enhanced representation. During hypergraph learning, intra- and inter-sequence interactions are mined simultaneously. At the POI level, a self-attention mechanism captures sequential and spatio-temporal dependencies within each sub-sequence. At the trajectory level, hypergraph convolution combined with the transformer models high-order correlations among trajectories.
The main contributions of this paper are as follows:
- We propose a novel region-aware dynamic hypergraph learning method with dual-level modeling for next POI recommendation. To enhance knowledge representation, it explores dynamic mobility patterns beyond individual and point.
- We consider associations among users, POIs, and trajectories. Specifically, we leverage coarse-grained geographical influence to exploit more potential POI correlations. We identify dynamic and complex patterns by POI-level and trajectory-level interaction modeling, and mine beneficial cross-user collaborative information.
- Evaluations on three public real-world datasets demonstrate that the proposed method outperforms state-ofthe-art approaches.
2 RelatedWork
The methods for next POI recommendation can be broadly classified into two distinct literature streams: Sequentialbased methods and Graph-based methods.
2.1 Sequential POI Recommendation
Previous methods have commonly treated next POI recommendation as a sequential prediction task. With the success of recurrent neural networks (RNNs) [Sun et al., 2020], RNN
and its variants have been widely adopted to capture complex sequential dependencies enriched with contextual information [Wu et al., 2020]. However, RNN-based methods primarily focus on short-term dependencies and emphasize contiguous interactions, which restricts their effectiveness in handling more diverse patterns.
To address these limitations, self-attention networks [Vaswani et al., 2017] have been employed to model longterm dependencies and capture non-consecutive correlations between POIs [Zhang et al., 2022]. For example, STAN [Luo et al., 2021] incorporates a bi-layer attention mechanism to explore non-adjacent check-ins and spatiotemporal interactions. Despite these advancements, self-attention models mainly concentrate on intra-sequence relationships, often neglecting inter-sequence information.
Nevertheless, sequential methods rely heavily on individual user data, which constrains their recommendation performance. Moreover, effectively capturing both local and global spatiotemporal dependencies remains a significant challenge.
2.2 Graph and Hypergraph-basedModels
Graph-based methods [Han et al., 2020; Rao et al., 2022; Liu et al., 2023] represent user-POI interactions as graph structures and aggregate neighborhood information to overcome the limitations of sequ,ential models, enabling more complex and global behavior modeling. Methods such as STGCAN [Wang et al., 2022a] and DRAN [Wang et al., 2022b] utilize GNNs to capture spatio-temporal dependencies across users. However, these approaches typically incorporate only low-order POI-POI relations, making it challenging to model the complex behaviors arising from trajectory collaborations.
Hypergraphs [Bai et al., 2021; Xia et al., 2021; Gao et al., 2022] extend beyond pairwise connections to capture higherorder relationships among POIs, users, and spatio-temporal contexts. Hypergraph Neural Networks [Lai et al., 2023] have emerged as a promising solution to the limitations of sequential and graph-based methods. They effectively integrate spatio-temporal information and collaborative signals across users. For instance, STHGCN [Yan et al., 2023] combines hypergraph structure encoding with spatio-temporal features to provide a more comprehensive understanding of user preferences, while MvStHgL [An et al., 2024] introduces a multiview hypergraph learning approach to capture users' spatiotemporal periodic interests, offering richer representations of user behavior. However, these methods still struggle to fully explore spatial associations and transcend individual and POI-level collaborative information.
In contrast to existing methods, our ReHDM is a regionaware dynamic hypergraph learning method with dual-level interaction modeling. (1) While grounded in hypergraph learning, this framework models user visit records at both POI level and trajectory level simultaneously. By modeling the target user's check-in sequence to capture inter-POI dependencies, we also emphasize inter-trajectory correlations. (2) Specifically, we incorporate collaborative trajectories from other users to assist in predicting the current trajectory, thereby uncovering high-order collaborative information among users. (3) Furthermore, we employ coarse-grained regions to capture spatial correlations among POIs.
3 ProblemFormulation
Raw Data: Consider the user set U = {u1, u2, . . . , u|U|}, the POI set P = {p1, p2, . . . , p|P|}, and the category set C = {c1, c2, . . . , c|C|}. Let Q = {q1, q2, . . . , q|Q|} denote the set of all check-in records. Each check-in is denoted by q = ⟨u, p, c, g, t⟩ with information of user u visited a POI p at timestamp t, with the POI category c and geometric information g. The geometric information g uniquely identifies the POI p and is represented as a tuple (longitude, latitude).
Trajectory Definition: Let S = {s1, s2, . . . , s|S|} be the set of all trajectories. A trajectory is a set of consecutive check-ins generated as follows: For each user u, let Qu denote the history check-ins of u. Split Qu by specific time interval (i.e., 1 day) and get a trajectory sequence Su = {s1u , s2u , . . . , s|Su| u }, where the m-th trajectory smu contains a sequence of user's check-ins, denoted by smu = {q1u , q2u , . . . q|smu | u }. Given the historical trajectories S before the current timestamp tc, and the current target trajectory stu of a specific user u, the goal of next POI recommendation is to recommend the top-K POIs that user u may visit at the next timestamp after the target trajectory.
4 ProposedMethodology
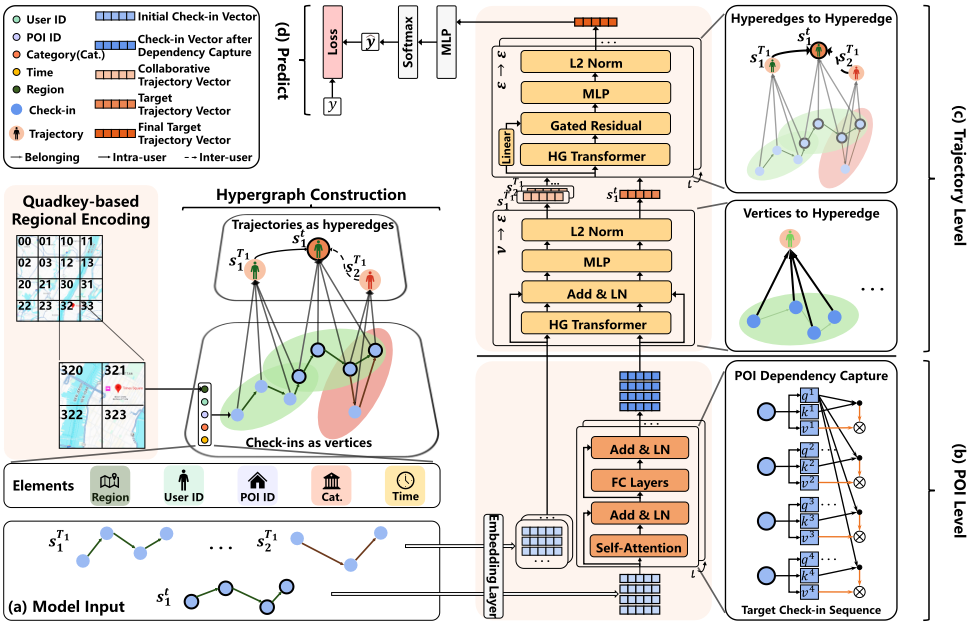
The proposed ReHDM framework is schematically illustrated in Figure 2. This method models user check-in sequences at both POI level and trajectory level, leveraging collaborative trajectories to enhance the representation of the target trajectory. Additionally, it employs the quadkey encoding scheme to partition POIs into coarse-grained regions.
4.1 Quadkey-based Regional Encoding
In POI recommendation, latitude and longitude are commonly embedded to capture geographical features. However, geographic data are often sparse and nonlinear, and the strong interaction between latitude and longitude makes separate embedding suboptimal. To address this, we adopt a quadkey-based region encoding method to hierarchically divide dispersed POIs into regions and leverage coarse-grained regional information to uncover spatial correlations.
Following [Lian et al., 2020], we partition the Earth's surface using the Tile Map System and assign each grid cell a unique quadkey. The encoding process involves selecting a zoom level, projecting POI coordinates, dividing the grid, and generating a base-4 quadkey string to represent each region. As shown in Figure 2, regions sharing the same quadkey prefix are adjacent at higher hierarchical levels.
To facilitate processing, each check-in point's quadkey is treated as a discrete categorical feature, with its regional index derived by taking a modulo of the total grid count at the final zoom level.
4.2 Hypergraph Construction
To leverage collaborative information from other users and reveal high-order inter-user relationships, we construct a hypergraph that models both individual trajectories and their collaborative connections. Specifically, we define a hypergraph H = (V, E), where V represents the set of check-in records (nodes), and E represents the set of user trajectories (hyperedges). Each hyperedge e ∈ E corresponds to a user's time-partitioned trajectory smu , and it connects all check-in records {q1u , q2u , . . . , q|smu | u }within that trajectory. This design captures high-order relationships among multiple check-ins belonging to different trajectories.
To encode this structure, we utilize two matrices: H1 ∈ R|V|×|E| , H2 ∈ R|E|×|E| . The matrix H1 (node-to-hyperedge incidence) is defined as
Hence, H1 indicates which check-ins are associated with which trajectories.
The matrix H2 (hyperedge-to-hyperedge adjacency) encodes collaborative relationships among trajectories. We set H2(m, n) = 1, if sm ∼ sn or sm ≈ sn, where "∼" represents two trajectories from the same user (intra-user relationship), and "≈" represents two trajectories from different users that are sufficiently similar (inter-user relationship). To prevent data leakage when predicting future check-ins, we require that the end time of a source trajectory sm precedes the start time of a target trajectory sn.
In addition, we introduce an edge-type matrix rE→E to indicate whether each connection in H2 is an intra-user correlation or an inter-user collaboration:
During training and inference, we focus on trajectories connected to the target trajectory being predicted, as well as the check-ins associated with these trajectories. This restricted sub-hypergraph ensures efficiency in computation and maintains relevance to the prediction task.
4.3 POI-Level ModelingModule
The POI-level modeling module focuses on efficiently encoding the underlying relationships between POIs to capture user movement patterns. This module employs attention mechanisms for representation learning on individual user trajectory data, using self-attention mechanisms to capture dependencies between POIs, thereby understanding user movement behavior at the POI level. To more accurately reflect user preferences, representative POI pairs in users' historical visit records are given greater weight, underscoring their importance in predictions. For this purpose, we have designed a POI dependency capture module specifically to model the dependencies between check-in points in the sequence of user visits, enhancing the understanding and predictive capabilities regarding user movement patterns.
Embedding Layer
Each check-in point q = ⟨u, p, c, g, t⟩ in the sub-hypergraph includes three ID features: user ID u, POI ID p, and category ID c. To capture temporal characteristics, two time-related IDs are added: hour ID th (24 categories) and day-of-week ID td (7 categories), reflecting mobility patterns like visiting entertainment venues on weekends. Finally, the POI location g is clustered into a region ID r using the quadkey-based regional encoding method.
The embedding layer femb transforms each ID feature into a dense vector of dimension did, and subsequently, all six embeddings are concatenated to form the check-in representation. The formula is as follows:
so that the dimensionality of the check-in representation E(q) is d = 6 did.
Target Check-in Sequence Processing
In the POI-level modeling stage, we use a simplified Transformer encoder layer to capture dependencies among POIs visited by the target user, uncovering latent preferences. While both target and collaborative sequences are initially input, this stage focuses on the target sequence. The encoder includes two sublayers: a multi-head self-attention (MSA) sublayer and a feed-forward sublayer (FFN).
To implement the attention mechanism, we employ three learnable projection matrices W(k) Q ,W(k) K ,W(k) V ∈ Rd×dh , dh = d/h, where k denotes the index of the attention head. Accordingly, the query, key, and value vectors are given by:
where E(stu ) ∈ R|stu |×d represents the embedding of the target check-in sequence, which is formed by stacking individual check-in embeddings E(q) ∈ Rd for all records in the sequence. For the k-th attention head, the output is obtained via scaled dot-product attention:
Next, the outputs of all attention heads are concatenated and mapped back to the original embedding dimension by another learnable matrix WO ∈ Rd×d :
where h denotes the number of attention heads.
After attention calculation, a FFN refines the representation at each sequence position using two fully connected layers with ReLU activation in between:
where W0 ∈ Rd×df , W1 ∈ Rdf×d , b0 ∈ Rdf , b1 ∈ Rd are all learnable parameters, and df denotes the hidden dimension of the feed-forward layers.
To ensure stable training and facilitate gradient flow, we apply residual connections, layer normalization (LN), and dropout around both the MSA sublayer and the FFN sublayer. Formally, the updated embeddings for the target sequence are iteratively computed as:
Here, E(stu ) represents the original embedding of the target check-in sequence, while ˆE0(stu ) and E0(stu ) are the updated embeddings after passing through the MSA and FFN modules, respectively.
4.4 Trajectory-Level ModelingModule
The trajectory-level modeling module aims to further uncover the collaborative relationships among multiple trajectories from both the same user and different users, building upon the processing at the POI level. First, we employ hypergraph convolution to aggregate check-in information and generate an initial representation for each trajectory, ensuring that the representation of each trajectory encapsulates its internal checkin information. Then, by applying hyperedge convolution on hyperedges, this module jointly learns the representations of multiple trajectories that exhibit collaborative relationships, thereby capturing higher-order collaboration among users.
Generating Initial Trajectory Representations
To better integrate check-in information within each trajectory, we use a hypergraph convolution approach. Specifically, a Hypergraph Transformer (HG Transformer) layer aggregates check-in data to generate initial trajectory representations (V → E). Following [Yan et al., 2023], the HG Transformer consists of two stages: message assembling (MA) and message propagation (MP).
Message Assembling. In this step, we combine the source node's hidden representation h(l) j with the edge-type vector rij, time vector tij, and distance vector sij between the two nodes to obtain the message vector m(l) ij :
where i and j denote the target node (practically treating hyperedges as special nodes) and the source node, respectively. Message Propagation. The importance of each message is evaluated with multi-head scaled dot-product attention (MSDA), and neighbor messages are aggregated via weighted summation based on attention scores. The hidden representation of the target node h(l+1) i is then updated as:
where N(i) represents the set of neighbors of node i in the sub-hypergraph adjacency matrix. Here, h(l+1) i ∈ Rd is the hidden representation of the target node at layer (l + 1).
In summary, the HG Transformer can be written as:
As trajectories lack initial raw features, we introduce a learnable weight matrix θ ∈ Rd as a shared embedding for all trajectories. The representation after one HG Transformer layer is computed as:
To preserve initial information, we apply residual connections, layer normalization, and a multi-layer perceptron (MLP) to compress the representation back to d-dimensions:
where L2 denotes L2 normalization. W(0) 0 ∈ Rhd×d , W(0) 1 ∈ Rd×d , and b(0) 0 , b(0) 1 ∈ Rd are learnable parameters. At this stage, the target check-in sequence E0(stu ) is also processed as the set of E(q) features for the target trajectory.
Finally, we aggregate the check-in information from the target and collaborative trajectories into their trajectory representations h(1) i ∈ Rd .
Convolution Across Trajectories
To update hidden representations (E → E) with messages from collaborative trajectories and capture higher-order collaboration, we stack (L-1) HG Transformer layers. This allows the model to gather information from distant neighbors across trajectories, capturing both intra-trajectory spatiotemporal relationships and inter-trajectory interactions. Each layer applies an MLP and L2 normalization. A linear projection and gated residual module balance the previous layer's output h(l) i with the HG Transformer's output ˆh(l+1) i , effectively integrating knowledge from collaborative trajectories:
where l = 1, 2, . . . , L - 1. β is a hyperparameter indicating the residual weight. W(l) 2 ∈ Rd×hd is used for dimensional alignment in the gated residual module, and b(l) 2 ∈ R is a bias term. Thus, after l-layer convolution, the information from collaborative trajectory nodes is aggregated into the final representation of the target trajectory h(L) i ∈ Rd .
4.5 Predict
Finally, we use a one-layer perceptron to map the representation of the target trajectory h(L) i to the POI ID space, thus predicting the next location visited by the user:
where Wp ∈ Rd×|P| and bp ∈ R|P| are the weight matrix and bias term, respectively. We adopt the cross-entropy loss for mini-batch training:
| Method | NYC | TKY | Gowalla | |||||||||
|---|---|---|---|---|---|---|---|---|---|---|---|---|
| Acc@1 | Acc@5 | Acc@10 | MRR | Acc@1 | Acc@5 | Acc@10 | MRR | Acc@1 | Acc@5 | Acc@10 | MRR | |
| FPMC(WWW10) | 0.1003 | 0.2126 | 0.2970 | 0.1701 | 0.0814 | 0.2045 | 0.2746 | 0.1344 | 0.0383 | 0.0702 | 0.1159 | 0.0911 |
| PRME(IJCAI15) | 0.1159 | 0.2236 | 0.3105 | 0.1712 | 0.1052 | 0.2278 | 0.2944 | 0.1786 | 0.0521 | 0.1034 | 0.1425 | 0.1002 |
| STGCN(TKDE20) | 0.1799 | 0.3425 | 0.4279 | 0.2788 | 0.1716 | 0.3453 | 0.3927 | 0.2504 | 0.0961 | 0.2097 | 0.2613 | 0.1712 |
| PLSPL(TKDE20) | 0.1917 | 0.3678 | 0.4523 | 0.2806 | 0.1889 | 0.3523 | 0.4150 | 0.2542 | 0.1072 | 0.2278 | 0.2995 | 0.1847 |
| STAN(WWW21) | 0.2231 | 0.4582 | 0.5734 | 0.3253 | 0.1963 | 0.3798 | 0.4464 | 0.2852 | 0.1104 | 0.2348 | 0.3018 | 0.1869 |
| GETNext(SIGIR22) | 0.2435 | 0.5089 | 0.6143 | 0.3261 | 0.2254 | 0.4417 | 0.5287 | 0.3262 | 0.1357 | 0.2852 | 0.3590 | 0.2103 |
| STHGCN(SIGIR23) | 0.2734 | 0.5361 | 0.6244 | 0.3915 | 0.2950 | 0.5207 | 0.5980 | 0.3986 | 0.1730 | 0.3529 | 0.4191 | 0.2558 |
| MCN4Rec(TOIS24) | 0.2569 | 0.5429 | 0.6405 | 0.3868 | 0.2535 | 0.4580 | 0.5656 | 0.3475 | 0.1794 | 0.3279 | 0.4322 | 0.2613 |
| DCHL(SIGIR24) | 0.2684 | 0.4385 | 0.4861 | 0.3582 | 0.1918 | 0.3662 | 0.4083 | 0.2308 | 0.1622 | 0.2863 | 0.3287 | 0.2035 |
| ReHDM(Ours) | 0.2914 | 0.5686 | 0.6521 | 0.4130 | 0.3184 | 0.5461 | 0.6063 | 0.4229 | 0.1920 | 0.3805 | 0.4335 | 0.2885 |
| %Improv. | 6.58% | 4.73% | 1.81% | 5.49% | 7.93% | 4.88% | 1.39% | 6.10% | 7.02% | 7.82% | 0.30% | 10.40% |
Dataset #Users #POIs #Check-ins #Sessions Sparsity
14,130 98.01%
65,499 97.73%
45,123 99.38%
| Dataset | #Users | #POIs | #Check-ins |
|---|---|---|---|
| NYC | 1,048 | 4,981 | 103,941 |
| TKY | 2,282 | 7,833 | 405,000 |
| Gowalla | 3,957 | 9,690 | 238,369 |
5 Experiments and Analysis
5.1 Experimental Setting
Datasets and Metrics
Datasets. We leverage three real-world LBSN datasets in this work: Foursquare-NYC, Foursquare-TKY [Yang et al., 2014], and Gowalla-CA [Cho et al., 2011]. Foursquare-NYC
and Foursquare-TKY cover New York City and Tokyo from April 2012 to February 2013, while Gowalla-CA spans California and Nevada from March 2009 to October 2010. During preprocessing, POIs and users with fewer than 10 check-ins were removed. Each user's check-in sequence was divided into 24-hour trajectories, and those with only one check-in were discarded. Table 2 summarizes the key statistics after preprocessing. The data was split chronologically, with 80% for training, 10% for validation, and 10% for testing. Validation and test sets include only users and POIs from the training set, and evaluation was performed on the last check-in of each trajectory.
Metrics. We use two evaluation metrics: Top-k accuracy rates (Acc@k) and Mean Reciprocal Rank (MRR), which are widely used in the next POI recommendation task. Acc@k represents the rate at which the true POI appears in the top-k predicted POIs, while MRR reflects the rank of the true POI in the predicted POI list. Both metrics measure the classification precision and ranking quality of the models.
Baseline Models
Our study compares our method with traditional, sequential, graph and hypergraph-based-based models, as follows: 1) FPMC [Rendle et al., 2010]: A model that integrates a Markov chain with matrix factorization; 2) PRME [Feng et al., 2015]: A model that employs a pairwise ranking metric embedding algorithm for personalized ranking; 3) STGCN [Zhao et al., 2020]: A model that introduces a gating mechanism into LSTM to account for time and distance; 4) PLSPL [Wu et al., 2020]: A rnn model that fuses short-term and long-term user preferences; 5) STAN [Luo et al., 2021]: A
model featuring a bi-attention architecture to capture spatiotemporal correlations; 6) GETNext [Yang et al., 2022]: A Transformer-based model enhanced by a global trajectory flow map; 7) STHGCN [Yan et al., 2023]: A Transformer model that integrates hypergraph structural encoding with implicit spatio-temporal features solves the cold-start problem; 8) MCN4Rec [Li et al., 2024]: A neural network model that employs multi-graph collaboration and contrastive learning for next-location recommendation; 9) DCHL [Lai et al., 2024]: A disentangled contrastive hypergraph learning model.
5.2 Performance Comparison
Table 1 shows that ReHDM achieves the best performance across all datasets. On the NYC dataset, it outperforms the second-best method by 6.58% in Acc@1, 4.73% in Acc@5, 1.81% in Acc@10, and 5.49% in MRR. On the TKY and Gowalla datasets, improvements range from 1.39% to 7.93% and 0.30% to 10.40%, respectively.
These improvements can be attributed to the following factors. First, ReHDMmodels user check-ins at both POI level and trajectory level simultaneously. This dual-layer modeling allows it to capture both the dependencies between user check-ins and high-order collaborative information among users, significantly improving recommendation accuracy. For instance, on the NYC dataset, ReHDM achieves a 6.58% higher Acc@1 compared to STHGCN. Second, ReHDM dynamically learns collaborative relationships among users, addressing the limitations of methods like STAN, which only model individual user preferences. As a result, it achieves a 0.0877 improvement in MRR compared to STAN. Lastly, ReHDM employs quadkey-based regoinal encoding to capture spatial associations between POIs. By incorporating coarsergrained regional spatial information into POI representation learning, this approach effectively mitigates data sparsity issues and further enhances recommendation performance.
| User Group | Model | Acc@1 | Acc@5 | Acc@10 |
| Inactive | STHGCN | 0.1391 | 03913 | 0.4336 |
|---|---|---|---|---|
| Normal | STHGCN | 0.3219 | 0.6369 | 0.7328 |
| Very active | STHGCN | 0.2701 | 0.4594 | 0.6756 |
| Inactive | Ours | 0.1826 | 0.3565 | 0.4347 |
| Normal | Ours | 0.3287 | 0.6986 | 0.7465 |
| Very active | Ours | 0.2702 | 0.4864 | 0.6216 |
| Trajectory Type | Model | Acc@1 | Acc@5 | Acc@10 | MRR |
|---|---|---|---|---|---|
| Short | STHGCN | 0.1519 | 0.2624 | 0.3011 | 0.2099 |
| Middle | STHGCN | 0.2060 | 0.4074 | 0.4398 | 0.2913 |
| Long | STHGCN | 0.2682 | 0.6167 | 0.7456 | 0.4198 |
| Short | Ours | 0.2348 | 0.4889 | 0.5276 | 0.3392 |
| Middle | Ours | 0.2476 | 0.4305 | 0.5023 | 0.3365 |
| Long | Ours | 0.3135 | 0.6202 | 0.7108 | 0.4444 |
5.3 Ablation Study
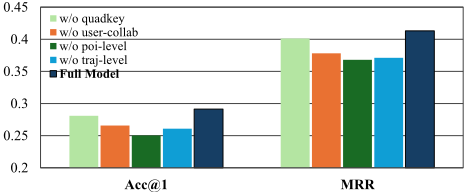
We conduct an ablation study on the NYC dataset to evaluate how each proposed component affects the model's final performance. Specifically, we consider five configurations: 1) w/o quadkey: Remove the quadkey region encoding, using only the other four features of each check-in for embedding; 2) w/o poi-level: Remove the POI-level modeling module and directly aggregate the embedded check-in features for the initial trajectory representation; 3) w/o traj-level: Remove the trajectory-level modeling module; 4) w/o user-collab: Remove the user collaboration module, thereby omitting the collaboration among users through hyper-edges; 5) Full Model: The complete proposed model with all components enabled.
From Figure 3, we observe that the full model achieves the best performance. Among the ablated components, removing the POI-level modeling has the most significant negative impact on performance, followed by the removal of the trajectory-level modeling or the user-collab module. Meanwhile, omitting the quadkey region encoding also reduces performance.
5.4 Cold-start Study
Inactive users and active users. Table 3 shows recommendation results on the NYC dataset under cold-start scenarios caused by inactive users. Users are categorized by trajectory count: the bottom 30% as Inactive, the top 30% as Very active, and the remaining 40% as Normal. Recommendations for inactive users are the most challenging due to insufficient historical data. As shown, our method outperforms STHGCN in most metrics. The slightly lower Acc@10 metric for the Very active user group may be due to instability in predictions caused by an insufficient number of samples in this group within the dataset. Notably, for Inactive users, Acc@1 improves from 0.1391 to 0.1826 (31.28%), demonstrating its effectiveness in addressing cold-start issues.
Short trajectories and long trajectories. When a trajectory contains only one or two check-ins, the limited spatiotemporal context complicates learning user preferences, posing challenges for next POI recommendation. Following previous studies, we classify trajectories by length, labeling the shortest 30% as short, the longest 30% as long, and the rest as middle trajectories. Table 4 compares our method with the baseline model STHGCN on the NYC dataset. Our method maintains stable Acc@1 across all trajectory types, achieving a relatively high Acc@1 of 0.2348 for short trajectories. In contrast, STHGCN performs poorly on short trajectories due to its lack of POI-level modeling, resulting in significantly lower Acc@1 scores. Its poor performance on long trajectories likely stems from similar limitations. By employing region-aware dynamic hypergraph learning and dual-level modeling, our method effectively mitigates data sparsity for short trajectories, addressing cold-start challenges.
5.5 Hyperparameter Analysis
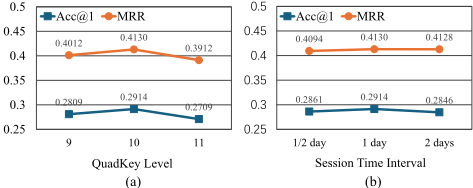
In order to examine the model's stability from both spatial and temporal segmentation perspectives, we further conduct a qualitative analysis of the impacts of the quadkey hierarchical level and the session time interval in ReHDM.
Impact of Quadkey Level. As shown in Figure 4(a), setting the quadkey level to 10 yields the best performance. A smaller quadkey level (e.g., 9) provides less fine-grained spatial encoding, making it insufficient for capturing spatial dependencies. Conversely, a larger quadkey level (e.g., 11) may introduce redundant spatial information, leading to performance degradation.
Impact of Session Time Interval. Figure 4(b) presents the effect of different session time intervals on ReHDM's performance. A session interval of 1 day achieves the best overall results. A shorter interval (e.g., 1/2 day) can segment trajectories too finely, causing the loss of critical temporal dependencies; on the other hand, a longer interval (e.g., 2 days) may group unrelated check-ins together, introducing noise.
6 Conclusion and FutureWork
We propose a region-aware dynamic hypergraph method with dual-level interaction modeling, capturing POI dependencies and higher-order user collaboration at both POI level and trajectory level. Collaborative trajectories address data sparsity, while coarse-grained regional modeling enhances spatial correlations. Experiments on real-world datasets demonstrate our method's superiority and potential for broader locationbased service applications.
Future endeavors will concentrate on incorporating user social relationships, despite current challenges in obtaining such data.
Acknowledgments
This work was supported in part by the National Natural Science Foundation of China under Grant Nos. 62172417, 62272461.
@inproceedings{ijcai2025p343,
  title     = {Beyond Individual and Point: Next POI Recommendation via Region-aware Dynamic Hypergraph with Dual-level Modeling},
  author    = {Li, Xixi and Gu, Zhuo and Yao, Rui and Zhou, Yong and Zhu, Hancheng and Zhao, Jiaqi and Du, Wen-liang},
  booktitle = {Proceedings of the Thirty-Fourth International Joint Conference on
               Artificial Intelligence, {IJCAI-25}},
  publisher = {International Joint Conferences on Artificial Intelligence Organization},
  editor    = {James Kwok},
  pages     = {3081--3089},
  year      = {2025},
  month     = {8},
  note      = {Main Track},
  doi       = {10.24963/ijcai.2025/343},
  url       = {https://doi.org/10.24963/ijcai.2025/343},
}
TY - CPAPER TI - Beyond Individual and Point: Next POI Recommendation via Region-aware Dynamic Hypergraph with Dual-level Modeling AU - Li, Xixi AU - Gu, Zhuo AU - Yao, Rui AU - Zhou, Yong AU - Zhu, Hancheng AU - Zhao, Jiaqi AU - Du, Wen-liang T2 - Proceedings of the Thirty-Fourth International Joint Conference on Artificial Intelligence, IJCAI-25 PB - International Joint Conferences on Artificial Intelligence Organization PY - 2025 SP - 3081 EP - 3089 DO - 10.24963/ijcai.2025/343 UR - https://doi.org/10.24963/ijcai.2025/343 ER -Copied
Machine-readable versions of this paper, for tools and AI agents:





