
Exploring the Over-smoothing Problem of Graph Neural Networks for Graph Classification: An Entropy-based Viewpoint
Proceedings of the Thirty-Fourth International Joint Conference on Artificial Intelligence. Main Track. Pages 3235-3244.
https://doi.org/10.24963/ijcai.2025/360
Keywords
- Data Mining: DM: Mining graphs
- Machine Learning: ML: Classification
- Machine Learning: ML: Deep learning architectures
Abstract
The over-smoothing has emerged as a major challenge in the development of Graph Neural Networks (GNNs). While existing state-of-the-art methods effectively mitigate the diminishing distance between nodes and improve the performance of node classification, they tend to be elusive for graph-level tasks. This paper introduces a novel entropy-based perspective to explore the over-smoothing problem, simultaneously enhancing the distinguishability of non-isomorphic graphs. We provide a theoretical analysis of the relationship between the smoothness and the entropy for graphs, highlighting how the over-smoothing in high-entropic regions negatively impact the graph classification performance. To tackle this issue, we propose a simple yet effective method to Sample and Discretize node features in high-Entropic regions (SDE), aiming to preserve the critical and complicated structural information. Moreover, we introduce a new evaluation metric to assess the over-smoothing for graph-level tasks, focusing on node distributions. Experimental results demonstrate that the proposed SDE method significantly outperforms existing state-of-the-art methods, establishing a new benchmark in the field of GNNs.
- [Bai and Hancock, 2014] Lu Bai and Edwin R. Hancock. Depth- based complexity traces of graphs. Pattern Recognit., 47(3):1172-1186, 2014.
- [Bai et al., 2016] Lu Bai, Francisco Escolano, and Edwin R. Han- cock. Depth-based hypergraph complexity traces from directed line graphs. Pattern Recognit., 54:229-240, 2016.
- [Bai et al., 2022] Lu Bai, Lixin Cui, Yuhang Jiao, Luca Rossi, and Edwin R. Hancock. Learning backtrackless aligned-spatial graph convolutional networks for graph classification. IEEE Trans. Pat- tern Anal. Mach. Intell., 44(2):783-798, 2022.
- [Bai et al., 2023] Lu Bai, Yuhang Jiao, Lixin Cui, Luca Rossi, Yue Wang, Philip S. Yu, and Edwin R. Hancock. Learning graph con- volutional networks based on quantum vertex information propa- gation. IEEE Trans. Knowl. Data Eng., 35(2):1747-1760, 2023.
- [Cai and Wang, 2020] Chen Cai and Yusu Wang. A note on over- smoothing for graph neural networks. CoRR, abs/2006.13318, 2020.
- [Chen et al., 2020] Ming Chen, Zhewei Wei, Zengfeng Huang, Bolin Ding, and Yaliang Li. Simple and deep graph convolutional networks. In Proceedings of ICML, pages 1725-1735, 2020.
- [Cui et al., 2024a] Lixin Cui, Lu Bai, Xiao Bai, Yue Wang, and Ed- win R. Hancock. Learning aligned vertex convolutional networks for graph classification. IEEE Trans. Neural Networks Learn. Syst., 35(4):4423-4437, 2024.
- [Cui et al., 2024b] Lixin Cui, Ming Li, Lu Bai, Yue Wang, Jing Li, Yanchao Wang, Zhao Li, Yunwen Chen, and Edwin R. Hancock. QBER: quantum-based entropic representations for un-attributed graphs. Pattern Recognit., 145:109877, 2024.
- [Fang et al., 2023] Taoran Fang, Zhiqing Xiao, Chunping Wang, Jiarong Xu, Xuan Yang, and Yang Yang. Dropmessage: Unifying random dropping for graph neural networks. In Proceedings of AAAI, pages 4267-4275, 2023.
- [Guo and Wang, 2021] Zhiwei Guo and Heng Wang. A deep graph neural network-based mechanism for social recommendations. IEEE Transactions on Industrial Informatics, 17(4):2776-2783, 2021.
- [Guo et al., 2019] Zhijiang Guo, Yan Zhang, Zhiyang Teng, and Wei Lu. Densely connected graph convolutional networks for graph-to-sequence learning. Trans. Assoc. Comput. Linguistics, 7:297-312, 2019.
- [Guo et al., 2023] Xiaojun Guo, Yifei Wang, Tianqi Du, and Yisen Wang. Contranorm: A contrastive learning perspective on over- smoothing and beyond. In Proceedings of ICLR, 2023.
- [Hasanzadeh et al., 2020] Arman Hasanzadeh, Ehsan Haji- ramezanali, Shahin Boluki, Mingyuan Zhou, Nick Duffield, Krishna Narayanan, and Xiaoning Qian. Bayesian graph neural networks with adaptive connection sampling. In Proceedings of ICML, pages 4094-4104, 2020.
- [He et al., 2016] Kaiming He, Xiangyu Zhang, Shaoqing Ren, and Jian Sun. Deep residual learning for image recognition. In Pro- ceedings of CVPR, pages 770-778, 2016.
- [Hossain et al., 2024] Tanvir Hossain, Khaled Mohammed Saifud- din, Muhammad Ifte Khairul Islam, Farhan Tanvir, and Esra Ak- bas. Tackling oversmoothing in gnn via graph sparsification: A truss-based approach. In Proceedings of ECML PKDD, page 161-179, 2024.
- [Jang et al., 2017] Eric Jang, Shixiang Gu, and Ben Poole. Cate- gorical reparameterization with gumbel-softmax. In Proceedings of ICLR, 2017.
- [Jing et al., 2022] Li Jing, Pascal Vincent, Yann LeCun, and Yuan- dong Tian. Understanding dimensional collapse in contrastive self-supervised learning. In Proceedings of ICLR, 2022.
- [Kipf and Welling, 2017] Thomas N. Kipf and Max Welling. Semi- supervised classification with graph convolutional networks. In Proceedings of ICLR, 2017.
- [Klicpera et al., 2019] Johannes Klicpera, Aleksandar Bojchevski, and Stephan Günnemann. Predict then propagate: Graph neural networks meet personalized pagerank. In Proceedings of ICLR, 2019.
- [Leman and Weisfeiler, 1968] Andrei Leman and Boris Weisfeiler. A reduction of a graph to a canonical form and an algebra aris- ing during this reduction. Nauchno-Technicheskaya Informat- siya, 2(9):12-16, 1968.
- [Li et al., 2018] Qimai Li, Zhichao Han, and Xiao-Ming Wu. Deeper insights into graph convolutional networks for semi- supervised learning. In Proceedings of AAAI, pages 3538-3545, 2018.
- [Liu et al., 2020] Meng Liu, Hongyang Gao, and Shuiwang Ji. To- wards deeper graph neural networks. In Proceedings of SIGKDD, pages 338-348, 2020.
- [Morris et al., 2020] Christopher Morris, Nils M. Kriege, Franka Bause, Kristian Kersting, Petra Mutzel, and Marion Neumann. Tudataset: A collection of benchmark datasets for learning with graphs. CoRR, abs/2007.08663, 2020.
- [Rong et al., 2020] Yu Rong, Wenbing Huang, Tingyang Xu, and Junzhou Huang. Dropedge: Towards deep graph convolutional networks on node classification. In Proceedings of ICLR, 2020.
- [Rusch et al., 2023] T. Konstantin Rusch, Michael M. Bronstein, and Siddhartha Mishra. A survey on oversmoothing in graph neural networks. CoRR, 2023.
- [Shannon, 1948] Claude Elwood Shannon. A mathematical theory of communication. The Bell system technical journal, 27(3):379- 423, 1948.
- [Sun et al., 2024] Ziheng Sun, Xudong Wang, Chris Ding, and Ji- cong Fan. Learning graph representation via graph entropy max- imization. In Proceedings of ICML, 2024.
- [Wollschläger et al., 2024] Tom Wollschläger, Niklas Kemper, Leon Hetzel, Johanna Sommer, and Stephan Günnemann. Ex- pressivity and generalization: Fragment-biases for molecular gnns. In Proceedings of ICML, 2024.
- [Xu et al., 2018] Keyulu Xu, Chengtao Li, Yonglong Tian, To- mohiro Sonobe, Ken-ichi Kawarabayashi, and Stefanie Jegelka. Representation learning on graphs with jumping knowledge net- works. In Proceedings of ICML, pages 5449-5458, 2018.
- [Xu et al., 2019] Keyulu Xu, Weihua Hu, Jure Leskovec, and Ste- fanie Jegelka. How powerful are graph neural networks? In Proceedings of ICLR, 2019.
- [Yang et al., 2021] Liangwei Yang, Zhiwei Liu, Yingtong Dou, Jing Ma, and Philip S. Yu. Consisrec: Enhancing GNN for social recommendation via consistent neighbor aggregation. In Pro- ceedings of SIGIR, pages 2141-2145. ACM, 2021.
- [Zhao and Akoglu, 2020] Lingxiao Zhao and Leman Akoglu. Pairnorm: Tackling oversmoothing in gnns. In Proceedings of ICLR, 2020.
- [Zhou et al., 2020] Kaixiong Zhou, Xiao Huang, Yuening Li, Daochen Zha, Rui Chen, and Xia Hu. Towards deeper graph neural networks with differentiable group normalization. In Pro- ceedings of NeurIps, 2020.
- [Zhou et al., 2021] Kuangqi Zhou, Yanfei Dong, Kaixin Wang, Wee Sun Lee, Bryan Hooi, Huan Xu, and Jiashi Feng. Under- standing and resolving performance degradation in deep graph convolutional networks. In Proceedings of CIKM, pages 2728- 2737, 2021.
References were extracted automatically from the PDF and may contain errors.
Full text extracted automatically from the PDF; figures, tables and equations may differ. The PDF is the version of record.
1 Introduction
Graph Neural Networks (GNNs) have become powerful tools for analyzing structured data and have been widely employed in various fields [Cui et al., 2024a; Bai et al., 2022], including social networks [Guo and Wang, 2021], molecules [Wollschl¨ager et al., 2024], recommendation systems [Yang et al., 2021], etc. The core idea of GNNs is to learn node representations by iteratively propagating and aggregating the features of neighboring nodes, similar to the Weisfeiler-Lehman(WL) graph isomorphism test [Leman and Weisfeiler, 1968]. The difference is that the WL method iteratively aggregates discrete node labels, while GNNs aggregate continuous node features. For GNNs, stacking multiple layers in the network architecture is essential for capturing long-range dependencies and enhancing the expressiveness of the model. However, this leads to a notorious phenomenon known as over-smoothing [Li et al., 2018; Rusch et al., 2023; Cai and Wang, 2020], where node representations tend to be gradually indistinguishable when the number of layers increases.
∗Corresponding Author: Lu Bai
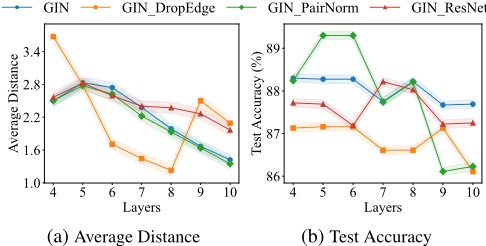
Recently, several methods have been proposed to address the over-smoothing, following the common principle of reducing the similarity between node features. These state-ofthe-art methods can be roughly categorized into three categories, i.e., random dropping methods, normalization-based methods, and residual-based methods. One notable method is the DropEdge [Rong et al., 2020], that randomly removes a certain rate of edges during the training process. Similar methods include the Drop-connect [Hasanzadeh et al., 2020] and DropMessage [Fang et al., 2023], that randomly drop edge weights and messages respectively. [Zhao and Akoglu, 2020] have proposed the PairNorm method to mitigate the over-smoothing by normalizing the differences between node features, ensuring that the feature variance remains balanced during the training process. Other normalization-based methods include the NodeNorm [Zhou et al., 2020] and GroupNorm [Zhou et al., 2021]. Inspired by the success of ResNet [He et al., 2016], several methods incorporate the residual connection to deep GNNs [Klicpera et al., 2019; Chen et al., 2020], and effectively prevent node features from significantly converging as the number of layers increases. However, they are still limited to node classification tasks.
To validate the above limitation, we conduct an experiment to demonstrate the less effectiveness of the aforementioned methods for graph classification. Since the Graph Isomorphism Network (GIN) [Xu et al., 2019] has proven highly effective for graph classification, we adopt the GIN as the backbone network and incorporate the DropEdge, PairNorm, and ResNet respectively. We report the curves of average distance and classification accuracies when the number of layers increases in Figure 1. The average distance between all node pairs in each graph is defined to measure the smoothness. When the number of layers increases to 8, the DropEdge, PairNorm, and ResNet effectively slow down the decrease in the distance between node features. However, these methods still have lower classification accuracy than the original GIN architecture. This indicates that merely reducing the similarity between node features does not alleviate the impact of over-smoothing for graph classification. For graphlevel tasks, it is essential to preserve the features that capture the complicated information of graphs (i.e., the key structural characteristics). Therefore, we need to move beyond existing measures and focus on the overall distribution of the graph to prevent the smoothing of crucial local information.
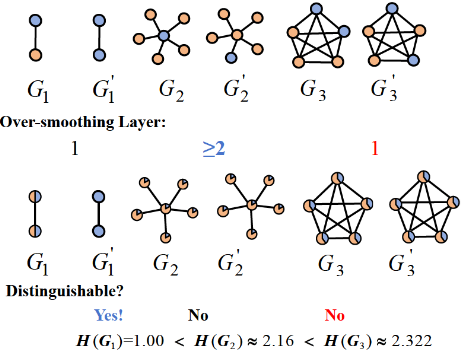
In this paper, we propose a new perspective to explore the over-smoothing problem for graph classification. Specifically, we focus on the distribution of subgraphs and emphasize the impact of over-smoothing on high-entropic local structures. To illustrate this, we provide a toy example in Figure 2. We can observe that although graph G1 is highly sensitive to the over-smoothing, it is easily distinguishable from G′1 due to its relatively simple structural distribution, i.e., the relatively smaller graph entropy. In contrast, G3 has the highest structural entropy, thus reflecting a more complicated and diverse structural distribution. The representative characteristics of the graphs are likely to be smoothed out, making it difficult to distinguish from G′3 and ultimately leading to misclassification. As a result, we hypothesize that the over-smoothing in high-entropic regions has a more significant impact for graph classification performance. In the following sections, we will provide a theoretical proof that this conclusion also holds true in general. Inspired by [Bai and Hancock, 2014], we employ the depth-based subgraph entropy to capture the dominant structural characteristics of graphs. To prevent the key structural characteristics of the graph from being over-smoothed, we propose a simple yet effective method: Sampling and Discretizing the node features in high-Entropic regions (SDE), making the feature distributions between nodes more distinct. We summarize our main contributions as follows:
- We commence by analyzing the limitations of existing over-smoothing theories and propose an innovative perspective to explore the over-smoothing problem for graph-level tasks. Moreover, we theoretically demonstrate the importance of high-entropic regions in improving graph classification performance.
- We adopt the depth-based subgraph entropy to capture the dominant characteristics and select the top-k highest entropy nodes for discrete sampling, thereby preventing the over-smoothing.
- We incorporate state-of-the-art over-smoothing mitigation techniques into GNNs and evaluate their performance on downstream graph classification tasks. Experimental results demonstrate that the proposed model significantly outperforms existing methods, establishing a new benchmark in the field.
2 SDE Versus ExistingMethodologies
In this section, we provide a brief overview of three classical methods that aim at addressing the over-smoothing and conduct a comparative analysis with our findings.
SDEVersus ContraNorm. ContraNorm [Guo et al., 2023] is an innovative technique that addresses the over-smoothing problem for GNNs, by contrastively normalizing node features. The method identifies the dimensional collapse [Jing et al., 2022] as another cause of over-smoothing, in contrast to previous works that primarily focus on reducing the node similarity. ContraNorm minimizes the uniformity loss and makes node features away from each other, leading to a more uniform distribution. The proposed discretization method SDE also takes the node distribution into the consideration. To some extents, ContraNorm shares certain similarities with our proposed method.
SDE Versus Graph Sparsification. [Hossain et al., 2024] propose a Truss-based Graph Sparsification (TGS) model, the first to address the over-smoothing problem for graph classification. The TGS method prunes the edges with the highest support, where the support of an edge e is defined as the number of triangles involving e, thereby sparsifying the dense regions of the graph. Our theory states that reducing the density of a graph results in a decrease in its entropy. Therefore, TGS can be viewed as mitigating the over-smoothing problem in the high-entropic regions of the graph, aligning with the insights discussed in this paper.
SDE Versus Dense-Based GNNs. Dense-based methods aggregate the embeddings of all network layers into a final representation. Examples include the JKnet [Xu et al., 2018], DCGCN [Liu et al., 2020], and DAGNN [Guo et al., 2019]. These methods allow the model to capture both local and global features, thus alleviating the impact of oversmoothing. Since the backbone network GIN also concatenates the outputs from each layer to produce the final representation, our proposed model is also a dense-based method. To make a fair comparison, we adopt the same dense-based strategy for all baseline methods.
3 Alleviating the Over-smoothing Through An Entropy-Based Viewpoint
In this section, we commence by theoretically analyzing the effect of over-smoothing in high-entropic regions, for the distinguishability of non-isomorphic graphs. To tackle the oversmoothing problem and simultaneously improve the graph classification performance, we propose a simple yet effective method. Furthermore, to consider the node feature distribution, we introduce a new metric to evaluate the oversmoothing for graph-level tasks.
3.1 Theoretical Insights of the Over-smoothing for High-Entropic Graphs
Previous studies have not explored the relationship between the graph classification performance and the regions suffered from the over-smoothing. We argue that the over-smoothing in high-entropic regions has a more significant impact for graph classification. Below, we provide theoretical supports for this claim. We commence by defining the graph entropy.
Definition 1. (The Shannon entropy [Shannon, 1948]) Given a graph G with node set V , let the degree of the i-th node be di. The structural Shannon entropy is defined as
Our theoretical analysis is divided into two parts. When all graphs are loosely connected, non-isomorphic graphs with fewer nodes are more easily distinguishable by the model, even though the over-smoothing occurs. The following Theorem 1 establishes the relationship between the number of nodes and the graph entropy. When graphs have the same number of nodes, the graphs with denser connections are more likely to suffer from over-smoothing than graphs with sparser connections. However, graphs with denser connections often have more complicated local structures, better representing the core structure of a graph. As a result, the oversmoothing restricts the ability to distinguish non-isomorphic graphs. Theorem 2 provides a detailed analysis of the relationship between the connectivity and the graph entropy.
Theorem1. In the case where both graphs have loosely connected nodes, graph G1 with fewer nodes has a lower entropy than graph G2 with more nodes.
Proof. Assume G1 has n nodes and the degree distribution probability pn of the n-th node is divided into m parts, corresponding to the degree distribution probabilities q1, q2, . . . , qm of m nodes, i.e., ∑mj=1 qj = pn. Consequently, graph G2 consists of n -m+ 1 nodes. Based on the additivity of the entropy function, the following equality holds:
An example is shown in Figure 2. The probability of the orange node for G1 is 12 , that is divided among five orange nodes, with the probability distribution { 1 10 , 1 10 , 1 10 , 1 10 , 1 10 }. Obviously, G2 has a higher Shannon entropy than G1. Hence, given that the connections exhibit the same level of sparsity, Theorem 1 holds true.
Theorem2. In the case that both graphs have the same number of nodes, graph G2 with sparser connections has lower entropy than graph G3 with denser connections.
Proof. Assume G2 and G3 have the same number of nodes, but G2 has fewer edges than G3. Furthermore, G3 is obtained by adding one edge (vn-1, vn) to G2. We use D2 and D3 to denote the total degree of graphs G2 and G3, respectively. Thus, D3 = D2 + 2. Assume the added edge is located in the sparse region of the graph, such that D2 > 2d2,n-1 and D2 > 2d2,n, where dp,i denotes the degree of the i-th node of graph Gp. Therefore, we have
Since D2 > 2d2,n-1 and D2 > 2d2,n, we have
Hence,
Algorithm 1 Top-k Entropy Selection
Input: A Graph G, adjacency matrix A, number of hops h, number of nodes k
Output: Top-k nodes
- 1: for each node u ∈ G do
- 2: Initialize an empty set for the neighbors of N(u)
- 3: for i ← 1 to h do
- 4: Construct i-th neighbors Ni(u) based on shortest paths
- 5: end for
- 6: N(u) = ⋃hi=1 Ni(u) ∪ {u}
- 7: for each node v ∈ N(u) do
- 8: dv = ∑j∈N(u) Avj , Dtotal = ∑v∈N(u) dv
- 9: pv = dv/Dtotal
- 10: end for
- 11: The subgraph entropy Hu = - ∑v∈N(u) pv log(pv)
- 12: end for
- 13: Sort(u ∈ G, item =Hu) // in non-increasing order
- 14: Select the top k nodes with the highest entropy values.
- 15: return the top k nodes
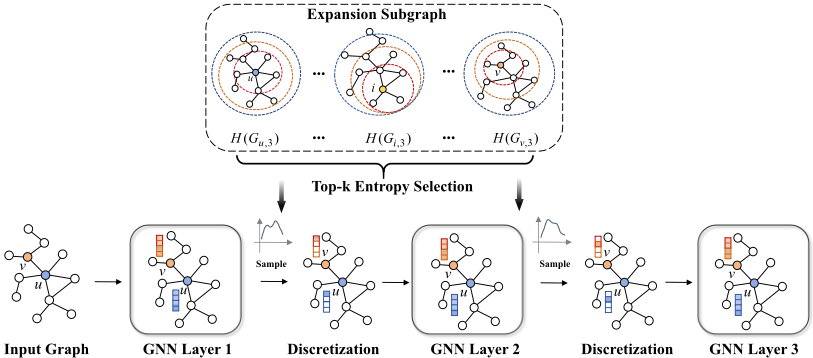
process of constructing the expansion subgraph. Then, we use Eq.(1) to compute each j-th order expansion subgraph entropy H(Gi,j) rooted at the i-th node. We sort the expansion subgraph entropies of all nodes and select the top-k nodes with the highest entropy. Based on the theorems proven above, these k nodes can represent the key structural characteristics of a graph.
The Sampling and Discretization
To alleviate the over-smoothing in the core regions of graphs during the training process, we discretely sample the top-k node features to increase the variance of their distributions. Inspired by [Jang et al., 2017], we adopt the Gumbel-Softmax for differentiable discrete sampling from a categorical distribution. First, at each layer of the GNNs, we use a linear transformation (or MLP in GIN) to determine the number of node categories C. Then, we use a softmax layer to transform
An example is shown in Figure 2, where G3 is a 4-regular graph. Based on the extremality of entropy, the Shannon entropy of G3 is the maximum for a graph with 5 nodes. Clearly, G2 has a smaller Shannon entropy than G3. Thus, for graphs with the same node number, Theorem 2 holds true.
In summary, it is crucial to take the structural distribution of graphs into consideration, since this affects the distinguishability of non-isomorphic graphs. According to our theory, alleviating the over-smoothing in high-entropic regions is more effective in distinguishing non-isomorphic graphs, thereby improving the graph classification performance.
3.2 The ProposedMethod of Relieving the Over-smoothing for Graph Classification
With the above theoretical proofs to hand, we focus on alleviating the over-smoothing in high-entropic regions for graph classification. We propose to utilize the depth-based subgraph entropy to identify the dominant region, specifically by selecting the top-k nodes with the highest expansion subgraph entropy. Furthermore, we define the SDE method to sample and discretize the distributions of the top-k nodes, thereby increasing the distributional difference between nodes.
The Top-k Entropy Selection
We first employ the expansion subgraph [Bai et al., 2016] to capture the dominant substructure, and the subgraph is defined as follows.
Definition 2. (The Expansion Subgraph [Bai and Hancock, 2014]) Given a graph G(V,E), V is the set of nodes and E is the set of edges. For a specified center node u, the node set VS of the i-th order expansion subgraph is defined as VS = {v ∈ V |d(u, v) ≤ i}, where d(u, v) represents the shortest path length from node u to node v. The edge set ES of the expansion subgraph contains all edges between nodes in VS, i.e., ES = {(v1, v2) ∈ E|v1, v2 ∈ VS}.
As shown in Figure 3, we present an example of the 3-rd order expansion subgraphs for the blue node u and the orange node v. Lines 1 to 10 of Algorithm 1 illustrate the detailed the node features H ∈ Rk×C into a probability distribution Z ∈ Rk×C for the top-k nodes. To increase the distributional differences among these nodes, we represent the node distributions as one-hot vectors, i.e., reassigning the label of each node. For each logit zk,i, we add Gumbel noise gk,i drawn from the Gumbel distribution, i.e.,
where uk,i ∼ Uniform(0, 1). To enable the backpropagation through discrete variables, we apply the following Gumbel-Softmax transformation, i.e.,
where τ is the temperature controlling the sharpness of the distribution. As τ → 0, the distribution converges to a onehot encoded vector, effectively performing discrete sampling. This increases the variance in the feature distribution, making the top-k nodes more distinct from one another.
The Pipeline for Graph Classification
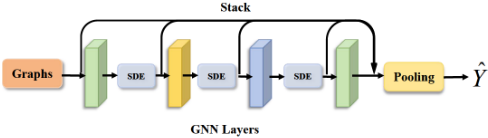
We introduce the pipeline employed for graph classification. Following the classical dense-based method [Xu et al., 2018; Liu et al., 2020; Guo et al., 2019], we concatenate the outputs from all GNN layers to obtain the final node embeddings. To derive the graph representation, we use SumPooling to aggregate the node embeddings, and the proposed pipeline is shown in Figure 4.
3.3 The Metric of Over-smoothing for Graph Classification
To better capture the distributional differences among nodes, we propose a new metric based on the Jensen-Shannon Divergence (JSD), for evaluating the over-smoothing problem for graph classification. Unlike traditional methods that primarily focus on measuring the similarity between nodes, our approach aims to account for the diverse feature distributions across nodes. We use a softmax layer to transform the embeddings from the final layer into probability distributions. Let Pu and Pv represent the feature distributions of two nodes u and v, we compute the JSD DJS between them as
where M = 12 (Pu + Pv) and DKL(Pu||M) represents the Kullback-Leibler (KL) divergence between Pu and the composite distribution M. In addition, the JSD metric possesses desirable properties such as symmetry, boundedness, and a strong capacity to capture distributional differences, making it well-aligned with our theoretical emphasis on distributionlevel analysis rather than similarity. A higher JSD value indicates a larger difference in their feature distributions, suggesting that the over-smoothing has not occurred. By monitoring the JSD value, we can effectively assess the extent of oversmoothing in the model.
3.4 The Complexity Analysis
The time complexity of the proposed method mainly relies on the preprocessing time of the top-k entropy selection algorithm. Assume |V | and |E| are the average number of nodes and edges, h is the number of hops. The time complexity of the neighborhood construction based on the shortestpath is O((|V | + |E|)|V |log|V |). The probability calculation (Lines 7-10 in Algorithm 1) requires a time complexity O(|V | · |N(u)|2 ), where |N(u)| is the average number of node neighbors. The time complexities of the entropy calculation and sorting are O(|V | · |N(u)|) and O(|V |log|V |), respectively. Given that |N(u)| << |V |, the whole preprocessing time complexity is O(|V |2 log|V | + |E||V |log|V |). Since the discretization process has constant time complexity, the overall training time remains consistent with that of the original backbone.
3.5 Discussion
We establish a unified framework to address the oversmoothing problem in graph-level tasks through entropyaware analysis. First, we theoretically demonstrate that the over-smoothing tends to occur more severely in high-entropy regions of a graph. Building on this insight, we propose a discrete sampling strategy that samples and discretizes nodes in high-entropy regions by analyzing their distributional patterns. To support this, we introduce a new evaluation metric, the Jensen-Shannon Divergence (JSD), to quantify distributional differences between nodes. Overall, this entropy-aware perspective not only deepens our understanding of the underlying causes of over-smoothing but also provides a principled and efficient solution to mitigate it.
| Datasets | # of graphs | Mean # nodes | Mean # edges | classes |
|---|---|---|---|---|
| MUTAG | 188 | 17.93 | 19.79 | 2 |
| PROTEINS | 1113 | 39.06 | 72.82 | 2 |
| PTC MR | 344 | 14.29 | 14.69 | 2 |
| COLLAB | 5000 | 74.49 | 2457.78 | 3 |
| IMDB-B | 1000 | 19.77 | 96.53 | 2 |
| IMDB-M | 1500 | 13.00 | 65.94 | 3 |
| DD | 1178 | 284.32 | 715.66 | 2 |
4 Experiments
To validate the correctness of our theoretical framework and demonstrate the effectiveness of the proposed SDE method, we employ two high-performing GNNs as backbone networks and compare the proposed SDE method with existing state-of-the-art methods.
| Model | MUTAG | PROTEINS | PTC MR | COLLAB | IMDB-B | IMDB-M | DD |
|---|---|---|---|---|---|---|---|
| GIN | 89.16±0.93 | 75.61±0.34 | 62.23±1.65 | 79.57±0.28 | 74.08±0.38 | 52.15±0.27 | 76.24±0.61 |
| +ResNet | 88.84±1.00 | 75.26±0.40 | 61.92±1.00 | 79.75±0.33 | 74.09±0.51 | 52.48±0.28 | 76.00±0.59 |
| +DropEdge | 86.29±0.57 | 75.38±0.20 | 61.55±0.67 | 79.38±0.14 | 74.25±0.36 | 51.41±0.41 | 76.93±0.50 |
| +PairNorm | 88.78±1.17 | 73.34±1.12 | 61.65±0.85 | 77.96±0.87 | 73.55±0.33 | 50.58±0.67 | 73.13±0.43 |
| +ContraNorm | 88.99±0.98 | 75.44±1.02 | 62.04±0.71 | 79.54±0.31 | 73.54±0.44 | 52.23±0.41 | OOM |
| +TGS | - | 75.31±0.29 | 61.90±1.06 | 69.34±0.23 | 71.67±0.32 | 47.46±0.30 | 76.49±0.95 |
| +SDE(ours) | 89.32±0.49 | 76.62±0.35 | 61.98±1.16 | 80.12±0.36 | 74.34±0.54 | 52.51±0.47 | 77.25±0.49 |
| GCN | 85.95±0.89 | 73.98±0.11 | 60.66±0.37 | 74.13±0.28 | 70.20±0.22 | 50.88±0.25 | 76.37±0.24 |
| +ResNet | 85.99±0.45 | 74.61±0.09 | 60.67±0.29 | 72.87±0.19 | 73.60±0.07 | 50.98±0.39 | 76.88±0.28 |
| +DropEdge | 86.17±0.82 | 74.60±0.24 | 60.29±0.73 | 74.51±0.17 | 73.33±0.17 | 51.11±0.36 | 76.54±0.24 |
| +PairNorm | 86.39±0.79 | 73.11±0.24 | 60.73±0.80 | 72.35±0.32 | 67.10±0.59 | 49.00±0.47 | 76.34±0.91 |
| +ContraNorm | 86.35±1.04 | 74.00±0.19 | 60.09±0.62 | 72.93±0.93 | 73.05±0.07 | 50.75±0.13 | OOM |
| +TGS | - | 74.40±0.08 | 61.07±0.25 | 66.80±0.20 | 69.47±0.29 | 44.44±0.77 | 76.54±0.50 |
| +SDE(ours) | 86.53±1.04 | 74.62±0.33 | 62.14±0.79 | 74.10±0.27 | 73.70±0.28 | 50.96±0.16 | 76.77±0.56 |
4.1 Experimental Setups
Datasets
We conduct extensive evaluations on seven standard graph datasets, extracted from Small Molecules (Mole), Bioinformatics (Bio), and Social Networks (SN) [Morris et al., 2020]. Detailed statistics of these datasets are shown in Table 1.
Backbone Models
Since GIN [Xu et al., 2019] has been proven a powerful model for graph classification tasks, we primarily adopt GIN as the backbone model. To further validate the effectiveness of the proposed method, we also apply Graph Convolutional Networks (GCN) [Kipf and Welling, 2017] for graph classification using the same pipeline shown in Figure 4. In the GIN backbone, the network depth is set to 5 layers, while in the GCN backbone, it is set to 6 layers. To make a fair comparison, we perform a 10-fold cross-validation. For the GIN backbone, the experiments are repeated 10 times. Computing the Laplacian matrix is more time-consuming with the GCN backbone, but the classification accuracies remain comparable, and the standard deviations are smaller for each repeated experiment. Therefore, to more precisely assess the stability and reliability of the methods, we repeat the experiments three times for each method.
Baseline Methods
We select three mainstream methods of addressing the oversmoothing as baselines, i.e., the ResNet [Klicpera et al., 2019], DropEdge [Rong et al., 2020], and PairNorm [Zhao and Akoglu, 2020]. Furthermore, we compare our method with two recent related studies, i.e., the ContraNorm [Guo et al., 2023] and Truss-based Graph Sparsification (TGS) [Hossain et al., 2024]. Since our pipeline concatenates the outputs of all layers to form the final graph representation, we do not compare our approach with methods based on densebased strategies [Xu et al., 2018]. We incorporate these baseline methods into two backbone models. Note that, under the same backbone network, both the baseline methods and our proposed SDE method are evaluated with the same configurations. For our method-specific parameters, we employ a grid search approach to evaluate the performance of different parameter combinations, ultimately selecting the optimal parameter configuration. Based on empirical experience, k is varied across five percentage levels {1%, 10%, 30%, 50%, 100%}, hop varies from 1 to 3 and the temperature τ varies from {0.1, 0.3, 0.6, 1.0, 5.0}. Note that, to ensure a fair comparison, the hyperparameter C used in the discrete sampling strategy is set to be equal to the hidden size used in the GIN baseline configuration. Our code is publicly available 1 .
4.2 The Experimental Results and Analysis
As shown in Table 2, our proposed method demonstrates the highly competitive performance. When existing methods for alleviating the over-smoothing are applied to downstream graph classification tasks, their classification accuracies are typically lower than the original backbone networks (GIN or GCN). This observation is consistent with our theoretical findings, i.e., focusing solely on node similarity cannot effectively improve graph classification performance. In contrast, our method achieves higher classification accuracies than GIN and GCN on six datasets. Furthermore, the proposed SDE method outperforms the existing state-of-theart methods for alleviating over-smoothing, especially on the GIN backbone network. Experimental results show that discretizing the node distributions in high-entropic regions is beneficial for graph classification.
4.3 The Over-smoothing Analysis
To validate the effectiveness of the proposed JSD metric, we compute the averaged JSD values for all node pairs of the graph and present the variations of JSD values over various network depths in Figure 5. Since the MUTAG dataset does not include the Truss-based graph, we do not evaluate the performance of the TGS method on the MUTAG dataset. We can observe that as the network depth increases, the JSD values of the original GIN decrease, indicating the occurrence of over-smoothing. Notably, when the network depth increases to 8 layers, the JSD value remains stable rather than dropping sharply, demonstrating that the SDE method effectively maintains the distribution difference between nodes.
1 https://github.com/Sophia0830BNU/SDE
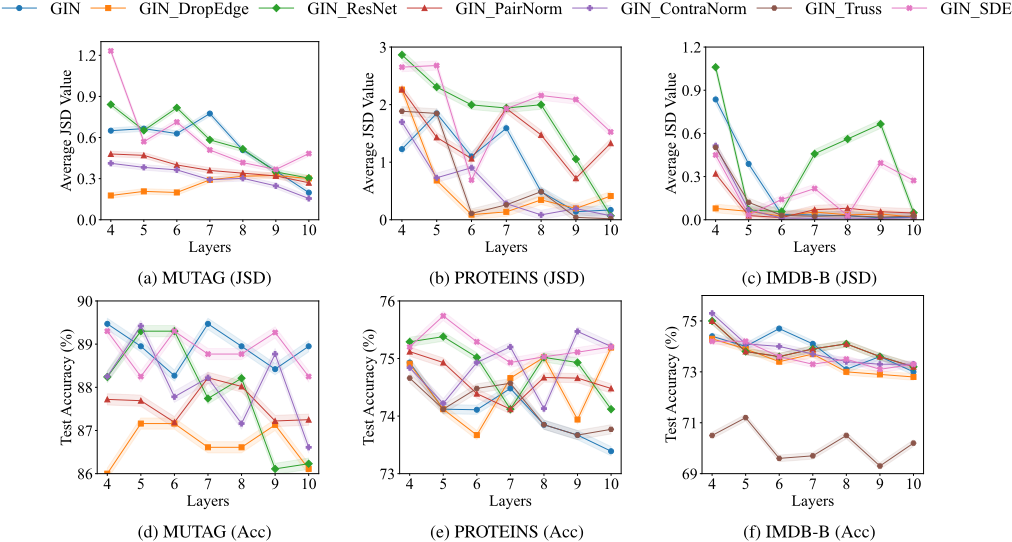
To further demonstrate that our method effectively addresses the over-smoothing issue, we present the classification accuracy based on different network depths. Figure 5 shows that the SDE method achieves the highly competitive performance. Specifically, when the network layer increases to 10, our method outperforms all state-of-the-art methods on both the PROTEINS and IMDB-B datasets.
| Method | MUTAG | PROTEINS | IMDB-B | |
|---|---|---|---|---|
| GIN | SDE | 89.32±0.49 | 76.62±0.35 | 74.34±0.54 |
| SDE L | 89.11±0.73 | 75.01±0.18 | 73.89±0.42 | |
| SDE A | 88.52±1.24 | 76.21±0.25 | 74.07±0.35 | |
| GCN | SDE | 86.53±1.04 | 74.62±0.33 | 73.70±0.28 |
| SDE L | 85.47±0.66 | 73.34±0.39 | 72.80±0.37 | |
| SDE A | 86.01±0.58 | 74.00±0.06 | 73.35±0.07 |
4.4 The Ablation Study
To validate the effectiveness of selecting the top-k highest entropy nodes, we compare the SDE method with two variants, i.e., the SDE L performing the discrete sampling on the nodes with the lowest entropy, and the SDE A sampling all nodes by removing the top-k entropy selection component. From the results shown in Table 3, we can draw the following two conclusions. (1) Selecting high-entropic nodes for discrete sampling significantly improves classification performance, whether using GIN or GCN as the backbone. This demonstrates that addressing the over-smoothing in high-entropic regions can enhance classification performance. (2) When the model removes the top-k entropy selection component, the classification accuracy drops, demonstrating that increasing the distribution differences among all nodes does not improve the over-smoothing problem for graph classification.
4.5 The Analysis of the Discrete Sampling Strategy
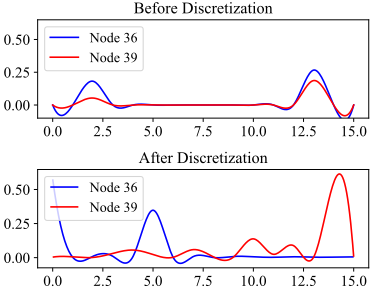
To better illustrate the effectiveness of the proposed Discrete Sampling Strategy in mitigating the over-smoothing issue, we visualize the distributions of two similar nodes from the PROTEINS dataset before and after discretization with a threshold of τ = 0.6, as shown in Figure 6. Before discretization, these two nodes exhibit highly similar distribution curves, indicating potential over-smoothing due to indistinguishable representations. After applying the discrete sampling strategy, their distributions become significantly more distinct. This increased divergence highlights the effectiveness of the proposed method in amplifying structural differences among nodes, thereby alleviating the over-smoothing problem.
4.6 The Hyper-parameter Analysis
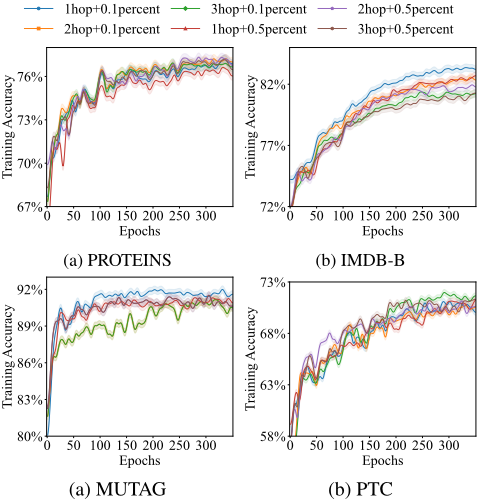
To evaluate the sensitivity of the proposed method with different hyper-parameters, we vary the ratio of high-entropic nodes and hop counts in the expansion subgraph. Specifically, the number of hops (ranging from 1 to 3) is used to define the size of the expansion subgraph, while the high-entropic node ratios are set to either 10% or 50%, representing the percentage of critical nodes. Figure 7 shows that, on the PROTEINS dataset, constructing subgraphs with 2-hop neighbors and selecting the top 10% of high-entropic nodes achieves the best performance. Besides, on the IMDB-B and MUTAG datasets, 1-hop neighbors with a 10% high-entropic node ratio yield the optimal results. These findings indicate that selecting a small proportion of high-entropic nodes for discretization can significantly improve classification performance.
4.7 The Scalability Analysis
To validate the correctness of our theoretical analysis and demonstrate the scalability of the proposed method, we generate test graphs using network generation models. Table 4 presents the performance comparison between the baseline GIN model and our proposed method with the SDE module on synthetic graph datasets of varying sizes and densities. As the average graph entropy increases, the classification performance of GIN degrades. In contrast, our proposed method consistently achieves superior performance across all settings. Notably, the performance gains brought by SDE become more significant on datasets with higher entropy. These results empirically validate the effectiveness of our SDE framework in alleviating over-smoothing.
| Method | Synthetic Graphs (|V |,|E|) | ||
|---|---|---|---|
| (20, 39.3) | (50, 100) | (50, 240) | |
| Ave Entropy | 2.4 | 2.53 | 3.56 |
| GIN (Acc) | 90 | 76.53 | 83.33 |
| +SDE (ours) (Acc) | 100 | 78.33 | 100 |
4.8 The Runtime Evaluation
In this section, we compare the training time of the proposed SDE method with various baselines. To make a fair comparison, we compute the training time on one same fold, excluding the preprocessing time. The results in Table 5 demonstrate that our proposed method achieves competitive training times across all datasets. On the IMDB-B dataset, the SDE method outperforms all baselines. On the other three datasets, the training time of SDE is only slightly higher than that of the ResNet method, but still comparable. This demonstrates the efficiency of the proposed SDE method.
| Method | MUTAG | PROTEINS | IMDB-B | DD |
|---|---|---|---|---|
| ResNet | 3m11s | 4m35s | 4m15s | 22m8s |
| DropEdge | 3m20s | 4m39s | 4m1s | 25m31s |
| PairNorm | 3m40s | 4m38s | 5m2s | 24m10s |
| TGS | 3m30s | 5m52s | 4m9s | 34m16s |
| ContraNorm | 3m47s | 5m15s | 4m43s | OOM |
| SDE | 3m14s | 4m38s | 3m45s | 23m39s |
5 Conclusion
In this paper, we have proposed a new perspective to explore the over-smoothing problem for graph-level tasks. The theoretical analysis has strongly demonstrated that addressing the over-smoothing in high-entropic regions can significantly enhance the discriminative power between graphs. Moreover, we have defined a novel SDE method to tackle the oversmoothing problem, significantly improving the graph classification performance. Experiments have shown that the proposed SDE method outperforms the existing state-of-the-art methods. In future work, we plan to explore alternative graph entropy measures, e.g. the von Neumann entropy, and investigate the use of entropy maximization to identify regions that contribute to over-smoothing [Sun et al., 2024]. We also consider incorporating quantum-inspired methods to more precisely localize and characterize these critical regions [Cui et al., 2024b; Bai et al., 2023].
Acknowledgements
This work is supported by the National Natural Science Foundation of China under Grants T2122020, 61602535, U21A20473, and 62172370. This work is also supported in part by the Humanity and Social Science Foundation of Ministry of Education (24YJAZH022), and the Program for Innovation Research in the Central University of Finance and Economics.
@inproceedings{ijcai2025p360,
  title     = {Exploring the Over-smoothing Problem of Graph Neural Networks for Graph Classification: An Entropy-based Viewpoint},
  author    = {Qian, Feifei and Bai, Lu and Cui, Lixin and Li, Ming and Du, Hangyuan and Wang, Yue and Hancock, Edwin},
  booktitle = {Proceedings of the Thirty-Fourth International Joint Conference on
               Artificial Intelligence, {IJCAI-25}},
  publisher = {International Joint Conferences on Artificial Intelligence Organization},
  editor    = {James Kwok},
  pages     = {3235--3244},
  year      = {2025},
  month     = {8},
  note      = {Main Track},
  doi       = {10.24963/ijcai.2025/360},
  url       = {https://doi.org/10.24963/ijcai.2025/360},
}
TY - CPAPER TI - Exploring the Over-smoothing Problem of Graph Neural Networks for Graph Classification: An Entropy-based Viewpoint AU - Qian, Feifei AU - Bai, Lu AU - Cui, Lixin AU - Li, Ming AU - Du, Hangyuan AU - Wang, Yue AU - Hancock, Edwin T2 - Proceedings of the Thirty-Fourth International Joint Conference on Artificial Intelligence, IJCAI-25 PB - International Joint Conferences on Artificial Intelligence Organization PY - 2025 SP - 3235 EP - 3244 DO - 10.24963/ijcai.2025/360 UR - https://doi.org/10.24963/ijcai.2025/360 ER -Copied
Machine-readable versions of this paper, for tools and AI agents:





