
Multi-Scale Temporal Neural Network for Stock Trend Prediction Enhanced by Temporal Hyepredge Learning
Proceedings of the Thirty-Fourth International Joint Conference on Artificial Intelligence. Main Track. Pages 3272-3280.
https://doi.org/10.24963/ijcai.2025/364
Keywords
- Machine Learning: ML: Relational learning
- Data Mining: DM: Applications
- Machine Learning: ML: Deep learning architectures
- Machine Learning: ML: Classification
Abstract
Existing research in Stock Trend Prediction (STP) focuses on temporal features extracted from a temporal sequence of stock data with a look-back window, which frequently leads to the omission of important periodic patterns, such as weekly and monthly variations in stock prices. Furthermore, these methods examine stocks individually, ignoring the temporal variation patterns among stocks that share higher-order relationships, like those within the same industry. These relationships typically provide contextual insights into market investments influencing stock price fluctuations. To tackle these issues, we propose a Multi-Scale Temporal Neural Network (MSTNN) framework tailored for STP. This architecture explores the periodic fluctuation behaviors of individual stocks through an innovative 3D convolutional neural network, alongside examining temporal variation patterns of stocks linked to specific industries via a temporal hypergraph attention mechanism. Empirical results from two real-world benchmark datasets show that MSTNN significantly outperforms prior state-of-the-art STP methods. The code of our MSTNN is available at https://github.com/sunlitsong/MSTNN.
- [Ariyo et al., 2014] Adebiyi A Ariyo, Adewumi O Adewumi, and Charles K Ayo. Stock price prediction using the arima model. In 2014 UKSim-AMSS 16th international confer- ence on computer modelling and simulation, pages 106- 112. IEEE, 2014.
- [Bai et al., 2021] Song Bai, Feihu Zhang, and Philip HS Torr. Hypergraph convolution and hypergraph attention. Pattern Recognition, 110:107637, 2021.
- [Chen et al., 2018] Yingmei Chen, Zhongyu Wei, and Xu- anjing Huang. Incorporating corporation relationship via graph convolutional neural networks for stock price pre- diction. In Proceedings of the 27th ACM International Conference on Information and Knowledge Management, pages 1655-1658, 2018.
- [Cui et al., 2023] Chaoran Cui, Xiaojie Li, Chunyun Zhang, Weili Guan, and Meng Wang. Temporal-relational hyper- graph tri-attention networks for stock trend prediction. Pat- tern Recognition, 143:109759, 2023.
- [Ding et al., 2021] Qianggang Ding, Sifan Wu, Hao Sun, Ji- adong Guo, and Jian Guo. Hierarchical multi-scale gaussian transformer for stock movement prediction. In Proceed- ings of the Twenty-Ninth International Joint Conference on Artificial Intelligence, IJCAI'20, 2021. IJCAI
- [Feng et al., 2019a] Fuli Feng, Huimin Chen, Xiangnan He, Ji Ding, Maosong Sun, and Tat-Seng Chua. Enhancing stock movement prediction with adversarial training. In Proceedings of the Twenty-Eighth International Joint Con- ference on Artificial Intelligence, IJCAI-19, pages 5843- 5849. International Joint Conferences on Artificial Intelli- gence Organization, 7 2019. IJCAI
- [Feng et al., 2019b] Fuli Feng, Xiangnan He, Xiang Wang, Cheng Luo, Yiqun Liu, and Tat-Seng Chua. Temporal relational ranking for stock prediction. ACM Trans. Inf. Syst., 37(2), 2019.
- [Feng et al., 2019c] Fuli Feng, Xiangnan He, Xiang Wang, Cheng Luo, Yiqun Liu, and Tat-Seng Chua. Temporal relational ranking for stock prediction. ACM Transactions on Information Systems (TOIS), 37(2):1-30, 2019.
- [Hochreiter and Schmidhuber, 1997] Sepp Hochreiter and Jürgen Schmidhuber. Long short-term memory. Neural computation, 9:1735-80, 12 1997.
- [Hu et al., 2018] Ziniu Hu, Weiqing Liu, Jiang Bian, Xu- anzhe Liu, and Tie-Yan Liu. Listening to chaotic whispers: A deep learning framework for news-oriented stock trend prediction. In Proceedings of the Web Search and Data Mining, page 261-269, 2018.
- [Huynh et al., 2023] Thanh Trung Huynh, Minh Hieu Nguyen, Thanh Tam Nguyen, Phi Le Nguyen, Matthias Weidlich, Quoc Viet Hung Nguyen, and Karl Aberer. Ef- ficient integration of multi-order dynamics and internal dynamics in stock movement prediction. In Proceedings of the Sixteenth ACM International Conference on Web Search and Data Mining, pages 850-858, 2023.
- [Kim et al., 2019] Raehyun Kim, Chan Ho So, Minbyul Jeong, Sanghoon Lee, Jinkyu Kim, and Jaewoo Kang. Hats: A hierarchical graph attention network for stock movement prediction. arXiv preprint arXiv:1908.07999, 2019.
- [Lu and Lu, 2021] Ruochen Lu and Muchao Lu. Stock trend prediction algorithm based on deep recurrent neural net- work. Wireless Communications and Mobile Computing, 2021:1-10, 2021.
- [Qin et al., 2017] Yao Qin, Dongjin Song, Haifeng Chen, Wei Cheng, Guofei Jiang, and Garrison W. Cottrell. A dual- stage attention-based recurrent neural network for time series prediction. In Proceedings of the Twenty-Sixth Inter- national Joint Conference on Artificial Intelligence, pages 2627-2633, 2017.
- [Sawhney et al., 2020] Ramit Sawhney, Shivam Agarwal, Ar- nav Wadhwa, and Rajiv Ratn Shah. Spatiotemporal hyper- graph convolution network for stock movement forecasting. In Proceedings of the IEEE International Conference on Data Mining, pages 482-491, 2020.
- [Sawhney et al., 2021] Ramit Sawhney, Shivam Agarwal, Ar- nav Wadhwa, Tyler Derr, and Rajiv Ratn Shah. Stock selection via spatiotemporal hypergraph attention network: A learning to rank approach. Proceedings of the AAAI Conference on Artificial Intelligence, 35(1):497-504, May 2021.
- [Song et al., 2024] Lingyun Song, Haodong Li, Yacong Tan, Zhanhuai Li, and Xuequn Shang. Enhancing enterprise credit risk assessment with cascaded multi-level graph rep- resentation learning. Neural Networks, 169:475-484, 2024.
- [Vaswani et al., 2017] Ashish Vaswani, Noam Shazeer, Niki Parmar, Jakob Uszkoreit, Llion Jones, Aidan N Gomez, Łukasz Kaiser, and Illia Polosukhin. Attention is all you need. Advances in neural information processing systems, 30, 2017.
- [Xu et al., 2021] Wentao Xu, Weiqing Liu, Lewen Wang, Yingce Xia, Jiang Bian, Jian Yin, and Tie-Yan Liu. Hist: A graph-based framework for stock trend forecasting via min- ing concept-oriented shared information. arXiv preprint arXiv:2110.13716, 2021.
- [Zhang et al., 2017] Liheng Zhang, Charu Aggarwal, and Guo-Jun Qi. Stock price prediction via discovering multi- frequency trading patterns. In Proceedings of the 23rd ACM SIGKDD International Conference on Knowledge Discovery and Data Mining, KDD '17, page 2141-2149, New York, NY, USA, 2017. Association for Computing Machinery.
- [Zhang et al., 2022a] Qiuyue Zhang, Chao Qin, Yunfeng Zhang, Fangxun Bao, Caiming Zhang, and Peide Liu. Transformer-based attention network for stock movement prediction. Expert Systems with Applications, 202:117239, 2022.
- [Zhang et al., 2022b] Qiuyue Zhang, Chao Qin, Yunfeng Zhang, Fangxun Bao, Caiming Zhang, and Peide Liu. Transformer-based attention network for stock movement prediction. Expert Systems with Applications, 202:117239, 2022.
- [Zhu et al., 2024] Peng Zhu, Yuante Li, Yifan Hu, Qinyuan Liu, Dawei Cheng, and Yuqi Liang. Lsr-igru: Stock trend prediction based on long short-term relationships and im- proved gru. In Proceedings of the 33rd ACM International Conference on Information and Knowledge Management, pages 5135-5142, 2024.
References were extracted automatically from the PDF and may contain errors.
Full text extracted automatically from the PDF; figures, tables and equations may differ. The PDF is the version of record.
1 Introduction
Stock Trend Prediction (STP) is important for helping investors make profitable decisions. There has been a significant increase in attention towards STP, which aims to forecast upcoming trends in stock prices to boost trading gains. Recently, numerous Time-Series Data Modeling (TSDM) techniques have emerged for STP, modeling stock data as time series. These include methods such as autoregressive integrated moving average (ARIMA) [Ariyo et al., 2014], recurrent neural networks (RNNs) [Lu and Lu, 2021], and transformers [Zhang et al., 2022a], all of which have shown promising results.
∗Corresponding author
Nevertheless, current TSDM techniques often employ a look-back window to collect sequence data, depicting the time-series data as a linear temporal sequence with a restricted receptive field. This limitation hinders their ability to effectively discern periodic fluctuation patterns. For instance, when the look-back window size is set to k, the TSDM method solely focuses on the sequence data from the previous k days, thereby disregarding the inherent weekly, monthly, or annual patterns within the stock time-series data. (Limitation 1).
Alternative approaches to STP focus on the analysis of the correlation data of stocks, a factor often neglected by conventional TSDMmethods. Consequently, a range of STP techniques that employ graph neural networks have been developed, such as HIST [Xu et al., 2021] and temporal graph convolution (TGC) [Feng et al., 2019b], both of which incorporate pairwise correlation modeling into STP. To enhance the modeling of correlation data among stocks, hypergraph neural network (HGNN) based methods, including the spatio-temporal hypergraph convolutional network (STHGCN) [Sawhney et al., 2020], hypergraph tri-attention network (HGTAN) [Cui et al., 2023], and the spatial-temporal hypergraph attention network [Sawhney et al., 2021], are employed. These approaches leverage the inherent high-order correlations present in stocks.
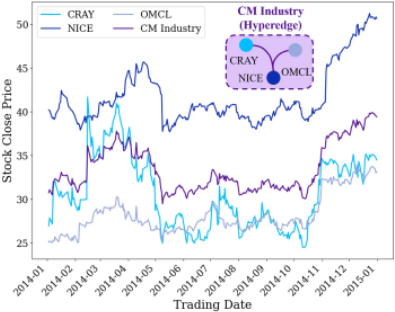
While these HGNN-based techniques do generate and aggregate hyperedge features, they overlook the dynamic characteristics of these features, which are crucial for effective stock market investments (Limitation 2). As an illustration, the dynamics of the entire Computer Manufacturing (CM) industry are displayed within the stock market's industry sector. This data is crucial for investors to examine as it summarizes the general trends of all stocks in the industry, providing insights necessary for making profitable investment decisions, as illustrated in Fig. 1. Considering the CM industry's representation as a hyperedge within the stock market's industry sector hypergraph, with the associated stocks (companies) functioning as nodes on this hyperedge, it is both logical and essential to model the dynamics of the hyperedge features.
To address these challenges, we introduce an STP framework founded on HGNN, titled Multi-Scale Convolutional Neural Network with Temporal Hypergraph Attention (MSTNN). The MSTNN model identifies repeating temporal patterns in individual stocks, and then applies a hypergraph learning method to merge these patterns to discern fluctuations of by exploiting high-order correlations among stocks. In addition, it expresses hyperedge features as time-varying sequences within the hypergraph learning model to improve STP performance. In summary, we highlight the core contributions of our study as follows.
- We present an innovative Multi-scale Convolutional Neural Network integrated with a Temporal Hypergraph Attention framework. This approach discerns each stock's unique internal dynamics and can identify movement trends in industry sectors by utilizing high-order correlations among stocks.
- We employ a Multi-scale 3D convolutional neural network strategy for dynamically modeling individual stocks, by reorganizing the time-series data into years,months, and days. In contrast to conventional TSDM methods that focus on stock price fluctuations within a fixed historical window, our method employs 3D filters of differing scales to examine the weekly, monthly, and yearly trends inherent in stock time series, thus uncovering the fundamental patterns of these sequences using receptive fields with varying scales.
- We introduce a Temporal Hypergraph Attention Network (THAN), where the features of each hyperedge, accumulated over multiple time steps, are considered as a form of time-series data for subsequent analysis of their dynamics. The THAN allows MSTNN to integrate sector insights from the stock market into predictions of stock movement trends, thereby enhancing the effectiveness of STP.
2 Preliminaries
2.1 Hypergraph
The hypergraph used in this paper indicates the high-order relationships among multiple stocks. Specifically, the hypergraph can be denoted as G = (V, E,W), where V is the set of vertices, E is the set of hyperedges, and W ∈ R|E|×|E| is a diagonal matrix indicating the weights assigned to each hyperedge. We set W = I, which means that each hypergraph is assigned with the same weight.
2.2 Task Formulation
Stock moving trend. For a specific stock s, the return ratio at time step t is determined by rts = (cts - ct-1 s )/ct-1 s , where cs denotes the closing price of the stock s. Based on rts , the moving trend of stock s at time step t is determined as follows:
where 0 stands for downward moving trend and 1 stands for non-downward moving trend.
Stock trend prediction. We follow the work [Hu et al., 2018] to define STP as a classification problem. Generally, the goal of STP is to map the input stock sequence data x ∈ RN×T×d into the category of the stock moving trend y, where N is the number of stocks, T is the duration of trading days and d is the dimension of the stock features. In our work, given the high-order relationships (hypergraph G) and the input stock sequence data x, the learning of y can be formulated by ˆ y = f(x;G; θ), where ˆ y ∈ RN×T×1 is the predictive category, θ are the parameters and f(·) denotes the nonlinear mapping function.
3 Methodology
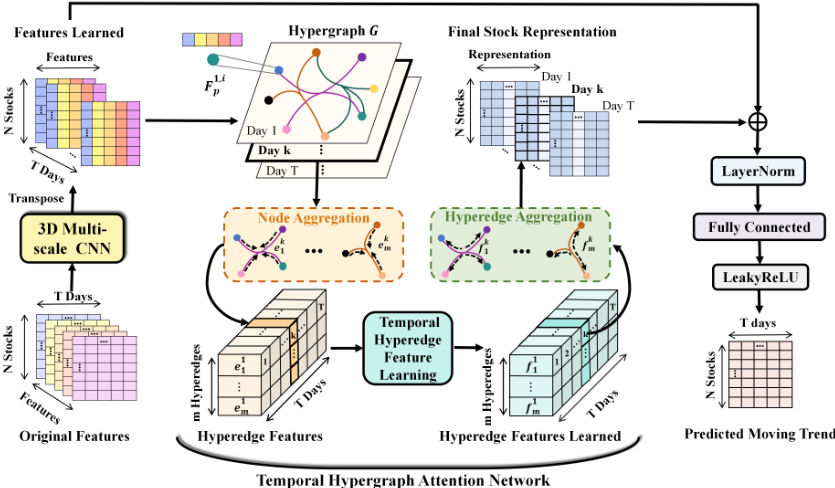
As illustrated in Fig. 2, our MSTNN is primarily composed of two key components: the 3D multiscale convolutional neural network (3D-MCNN) and the Temporal Hypergraph Attention Network (THAN).
MSTNN initially applies 3D-MCNN to identify periodic temporal trends. This method allows for the detection of inherent weekly, monthly, and annual patterns within stock time series data. By utilizing filters of varying dimensions, it aids in recognizing temporal patterns across multiple time scales. MSTNN next consolidates each stock's periodic temporal trends through THAN, which integrates hyperedge feature modeling as time sequence data into HGNN. Ultimately, MSTNN merges the outputs of 3D-MCNN and THAN, applying a LayerNorm to harness the strengths of both components.
3.1 3DMulti-scale Convolutional Neural Network
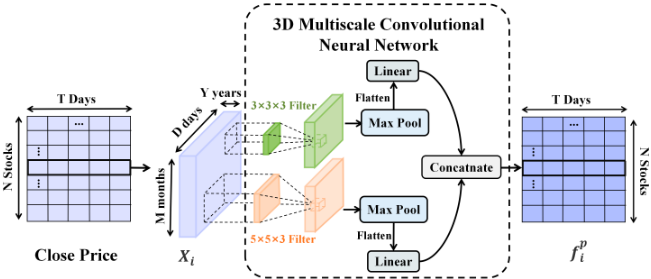
As demonstrated in Fig. 3, this part is dedicated to recognizing the periodic temporal patterns in stock features, including the intrinsic weekly, monthly, and annual patterns of stock closing prices. With the close price of stock si as a case study, our 3D-MCNN method aims to identify temporal trends via an innovative 3D tensor Xi ∈ RY ×M×D , which incorporates the close price information over a period of T = Y ×M ×D days. In particular, Y = 3 denotes the span of years, M = 12 signifies the count of months, and D = 30 indicates the days considered per month. The closing price feature of the stock si can be learned through
where f pi ∈ RT×2 is the learned closing price feature, || is the vector concatenation operation, Conv3D denotes the 3D convolution operations which produces d-dimensional vectors, W1 and W2 denote convolutional kernels of different sizes. Ultimately, by applying 3D-MCNN on each initial input feature, we derive the feature for all N stocks, represented as Fp ∈ RN×T×2d , where 2d signifies the feature dimension.
3.2 Temporal Hyeprgraph Attention Network (THAN)
In this section, we enhance HyperGAT [Bai et al., 2021] by introducing a technique for aggregating temporal hyperedge features. This method takes into account the temporal fluctuation patterns exhibited by stocks within high-order relationships. For example, the periodic variation tendencies of stocks belonging to the same sector. This module is composed of three main parts: Node Aggregation, Temporal Hyperedge Feature Learning, and Node Representation Learning through Hyperedge Aggregation.
Node Aggergation. This section focuses on learning the hyperedge feature using the stock features provided by 3DMCNN. Specifically, under each time step, at the l-th layer, we denote the feature representations for hyperedge ej ∈ E by elj , which can be learned by
The hl-1 k ∈ R1×d(l-1) denotes the embedding for node vk in hyperedge ej, h0k denotes the stock feature produced by 3D-MCNN and σ is a nonlinearity activation function such as LeakyReLU. We also adopt a multi-head mechanism for THAN module (we omit this in Fig 2 for ease of understanding), Wn ∈ Rd(l-1)×h×dl is a learnable weight matrix mapping the input node embedding into the feature spaces of different heads, where h denotes the head number, d(l-1) and dl are the output size of the (l - 1)-th layer, the l-th layer, respectively. αv jk is the attention coefficient matrix which quantifies the importance of node vk on the hyperedge ej. Specifically, αv jk can be learned by:
where wv ∈ R2dl×1 denotes a learnable parameter vector, ∥ denotes the concatenation operation and σ denotes a nonlinearity function such as LeakyReLU. Finally, we obtain the features of all m hyperedges, denoted by{e} ∈ Rm×h×T×dl , where T is the number of trading days.
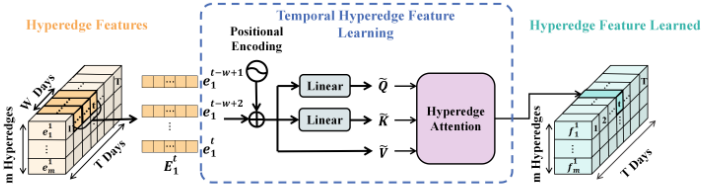
Temporal Hyperedge Feature Learning. In this section, we incorporate the temporal feature of hyperedges into hypergraph learning to capture the time-varying pattern of stocks with the same high-order relationship with a hyperedge attention mechanism which is inspired by Transformer [Vaswani et al., 2017]. As shown in Fig. 4, the temporal features of each hyperedge across T days are considered as a time series, forming the feature tensor e ∈ Rm×h×T×dl , which represents m sequences of temporal hyperedges. Specifically, the temporal hyperedge feature for hyperedge ej is obtained by
where ˜Q = ˜ Et jWQ, ˜K = ˜ Et jWK, and ˜ V = ˜ Et j . The f tj denotes the learned hyperedge feature of hyperedge j at time step t and ˜Et j = Et j + PE. The Et j = {et-W+1 j , et-W+2 j , · · · , etj } ∈ RW×h×dl denotes a newly formed sequence of hyperedge features with a length of W. This sequence is derived from the input sequence of temporal hyperedge features using a look-back window of length W. The PE ∈ RW×h×dl denotes the matrix of Periodic Position Encoding (PPE) [Vaswani et al., 2017] for the corresponding W hyperedge features and is set to the same under different head feature spaces. To accommodate the periodic fluctuation pattern of stock prices, PPE is designed to vary periodically at intervals of W steps throughout the temporal hyperedge sequence. Specifically, the value at the t-th row and i-th column of PE can be obtained with:
where ωk = 1 100002k/Dn is the frequency of trigonometric functions, i = 0, 1, 2, . . . , Dn 2 - 1 specifies the dimension within a position encoding and t = 0, 1, . . . , W - 1 refers to the position. The range of position in position is set between 0 and W - 1, since we use periodic position encoding with a look back window size of W. WQ ∈ RDn×Dn and WK ∈ RDn×Dn are learnable weight matrices. Finally, we obtain the feature representations for all m hyperedges, denoted by Fh ∈ Rm×h×T×dl .
Node Representation Learning via Hyperedge Aggregation (HA). Under each time step, at the l-th layer, by the above temporal hyperedge feature learning module, we can obtain representations {f lj |∀ej ∈ εi} for the hyperedges connecting node vi denoted as εi = {e1, · · · , es}. At one certain time step, NHA module aims to learn the representation of each node (stock) vi (i.e., hi) by Eq. (7), which aggregates all the information of hyperedges connected to vi.
where αe ij represents the attention coefficient of hyperedge ej on vertex vi. The αe ij can be obtained by
in which σ is the nonlinear function such as LeakyReLU, and We ∈ R2Dl×1 is a weight matrix. Through the action of HA module on f for each time step, the node (stock) representation under different head feature space, denoted as h ∈ RN×h×T×Dh is obtained. The final node (stock) representation Fo ∈ RN×T×Dh is obtained by calculating the mean of node (stock) representation across each head's feature space, i.e., by averaging the second dimension of h.
Finally, we compute the final stock representation r ∈ RN×T×(Dn+Dh) by:
where σ represents activation function such as LeakyReLU, Fp is the output of 3D-MCNN module, Fo is the result of THAN module and ∥ represents the concatenation operation.
3.3 Stock Trend Prediction
In this section, we transform the ultimate representation of each stock i at each time step t, represented as rt i , into a continuous value ranging from 0 to 1 by:
| NASDAQ | NYSE | ||||||||
|---|---|---|---|---|---|---|---|---|---|
| Method | Accuracy | Precision | Recall | F1-score | Accuracy | Precision | Recall | F1-score | |
| LSTM [Hochreiter and Schmidhuber, 1997] | 0.3722 | 0.3464 | 0.3656 | 0.3552 | 0.4573 | 0.3622 | 0.3804 | 0.3708 | |
| SFM [Zhang et al., 2017] | 0.3341 | 0.1113 | 0.3333 | 0.1668 | 0.4573 | 0.1524 | 0.3448 | 0.2113 | |
| TSDL | DARNN [Qin et al., 2017] | 0.4046 | 0.3705 | 0.3776 | 0.3740 | 0.4798 | 0.4141 | 0.3953 | 0.4040 |
| Adv-LSTM [Feng et al., 2019a] | 0.4219 | 0.4079 | 0.4299 | 0.4186 | 0.4735 | 0.4022 | 0.4268 | 0.4141 | |
| Transformer[Vaswani et al., 2017] | 0.4165 | 0.3931 | 0.4003 | 0.3967 | 0.4688 | 0.4224 | 0.4157 | 0.4190 | |
| GNN | GCN [Chen et al., 2018] | 0.3975 | 0.4082 | 0.3878 | 0.3976 | 0.4599 | 0.3589 | 0.3878 | 0.3976 |
| TGC [Feng et al., 2019b] | 0.3998 | 0.3824 | 0.3808 | 0.3816 | 0.4795 | 0.4194 | 0.3808 | 0.3816 | |
| HIST [Xu et al., 2021] | 0.4203 | 0.3922 | 0.3989 | 0.3955 | 0.4924 | 0.4273 | 0.4482 | 0.4375 | |
| LSR-IGRU[Zhu et al., 2024] | 0.4664 | 0.4632 | 0.4974 | 0.4797 | 0.5007 | 0.4831 | 0.5032 | 0.4929 | |
| STHGCN [Sawhney et al., 2020] | 0.4011 | 0.3984 | 0.3909 | 0.3946 | 0.4708 | 0.3948 | 0.3757 | 0.3847 | |
| HGTAN [Cui et al., 2023] | 0.4067 | 0.3811 | 0.3886 | 0.3848 | 0.4825 | 0.4102 | 0.3984 | 0.4042 | |
| HGNN | Sthan-sr [Sawhney et al., 2021] | 0.5187 | 0.5202 | 0.5102 | 0.5152 | 0.5104 | 0.5084 | 0.5136 | 0.5109 |
| ESTIMATE [Huynh et al., 2023] | 0.5102 | 0.5162 | 0.5812 | 0.5462 | 0.5058 | 0.5111 | 0.6303 | 0.5641 | |
| MSTNN(ours) | 0.5235 | 0.5211 | 0.7430 | 0.6126 | 0.5197 | 0.5172 | 0.7945 | 0.6265 | |
where ̂ yt i is the predicted up moving trend probability of the i-th stock at time step t, w ∈ R(Dl+Dh)×1 is the learnable weight vector and b is the bias. The parameters of our MSTNN are optimized by the following binary cross-entropy loss:
where yt i is the groundtruth for the moving trend of stock i at time step t, N is the number of stocks and T is the number of trading days.
4 Experiments
4.1 Datasets
To evaluate the performance of MSTNN, we conduct experiments using two real-world datasets from the American stock markets, NASDAQ [Feng et al., 2019c] and NYSE [Feng et al., 2019c]. Both datasets include stock sequence data over 1245 trading days, spanning from 01/02/2013 to 12/08/2017, i.e., the total length of the stock sequence data is 1245. The initial basic stock feature on each trading day is composed of normalized closing price, 5, 10, 20 and 30 day moving averages of closing price. We use 747 days (from 01/02/2013 to 12/17/2015) of the stock sequence data for training, 249 days ((from 12/18/2015 to 12/12/2016)) for validation and 249 days ((from 12/13/2016 to 12/08/2017)) for evaluation. In addition, we follow [Sawhney et al., 2021] to obtain the hypergraph data. Considering the importance of industry sector information in the real market, we collect the hyperedges in the hypergraphs based on industry information, where only a group of stocks belonging to the same industry contributes a hyperedge to the hypergraph. For NASDAQ, the hypergraph comprises 1026 stock nodes and 113 hyperedges, while for NYSE, it includes 1737 stock nodes and 130 hyperedges.
4.2 Experimental Setup
Training setups. MSTNN is implemented using pytorch and optimized by the Adam optimizer with an optimized learning rate of 5e-3 . Additionally, L2 regularization is employed with a lambda value of 1e-2 and a dropout rate of 0.2, training MSTNN for up to 100 epochs. Xavier is applied to initialize all the learnable weights. In the THAN module, we set the number of attention heads to 8 and the size of look back window to 20. In this research, all experiments are conducted using a NVIDIA A40 GPU.
Baselines andMetrics. Our proposed method is evaluated against a range of stock trend prediction techniques, categorized into three primary groups: i) Methods based on Time Series Deep Learning (TSDL), such as LSTM [Hochreiter and Schmidhuber, 1997], SFM [Zhang et al., 2017], DARNN [Qin et al., 2017], Adv-LSTM [Feng et al., 2019a] and Transformer[Vaswani et al., 2017], which focus solely on deriving stock representations from sequential stock data. ii) Methods based on Graph Neural Network (GNN), such as GCN [Chen et al., 2018], TGC [Feng et al., 2019b], HIST [Xu et al., 2021]and LSR-IGRU[Zhu et al., 2024], which integrate temporal features of individual stocks based on their pairwise relationships. iii) Methods based on HyperGraph Neural Networks (HGNN), specifically STHGCN [Sawhney et al., 2020], HGTAN [Cui et al., 2023], Sthan-sr [Sawhney et al., 2021], and ESTIMATE [Huynh et al., 2023], which incorporate high-order correlation information into the aggregation of temporal features for stocks. The effectiveness of STP methods is assessed using standard metrics including Accuracy, Recall, Precision and F1-score.
4.3 Predictive Performance
As indicated in Table1, MSTNN performs the best in all metrics evaluated on the NASDAQ and NYSE datasets. In particular, MSTNN outperforms previous top-performing approaches, such as the HGNN-based method (ESTIMATE) and the TSDL-based method (Adv-LSTM), achieving significant enhancements in the F1-scores of 6.64% and 19.4% on the NASDAQ dataset, respectively. The exceptional effectiveness of our MSTNN primarily stems from two key factors: 1) MSTNN takes into account the highe-order relationships between stocks, rather than just the price sequence relationships of individual stocks at different time steps as the TSDL methods do. This enables MSTNN to incorporate industry information into its stock trend predictions, a crucial aspect in making investment decisions. 2) MSTNN enhances the STP results by leveraging the temporal patterns of stock hyperedges that previous GNN or HGNN based methods have neglected, thus aiding in the learning of periodic price movement trends.
| NASDAQ | NYSE | ||||||||
|---|---|---|---|---|---|---|---|---|---|
| Model Component | Ablation Component | Accuracy | Precision | Recall | F1-score | Accuracy | Precision | Recall | F1-score |
| MSTNN(full model) | - | 0.5235 | 0.5211 | 0.7430 | 0.6126 | 0.5197 | 0.5172 | 0.7945 | 0.6265 |
| 3D-CNN | MSTNN w/o 3D-CNN | 0.4917 | 0.4976 | 0.2649 | 0.3458 | 0.4897 | 0.4959 | 0.1974 | 0.2824 |
| MSTNN w/o Filter A | 0.5227 | 0.5216 | 0.7060 | 0.6000 | 0.5139 | 0.5145 | 0.7845 | 0.6214 | |
| MSTNN w/o Filter B | 0.5167 | 0.5173 | 0.7001 | 0.5949 | 0.5185 | 0.5177 | 0.7798 | 0.6223 | |
| THAN | MSTNN w/o THAN | 0.5016 | 0.5078 | 0.5488 | 0.5275 | 0.5006 | 0.5083 | 0.5554 | 0.5308 |
| MSTNN w/o THFL | 0.5050 | 0.5094 | 0.6436 | 0.5687 | 0.5085 | 0.5145 | 0.5969 | 0.5527 | |
| MSTNN w/o PPE | 0.5199 | 0.5208 | 0.6624 | 0.5831 | 0.5136 | 0.5163 | 0.6437 | 0.5730 | |
| MSTNN with APE | 0.5200 | 0.5197 | 0.6998 | 0.5965 | 0.5145 | 0.5139 | 0.7863 | 0.6216 | |
4.4 Comparative Analysis of Profitability Against Baseline Models
To further evaluate the effectiveness of our MSTNN, we conduct a simulation of investments using the NASDAQ dataset's test set (from 12/13/2016 to 12/08/2017). In line with [Feng et al., 2019c], we apply a daily buy-hold-sell approach in which the investor buys the top-k stocks by evaluating their predicted return ratios using STP methods on trading day t, and then sells these stocks on the next trading day t + 1.
To measure the profitability of each STP method, on each trading day t, we calculate the Cumulative Investment Return Ratio (CIRR) by CIRRt = ∑i∈S t-1 (cti - ct-1 i )/ct-1 i + CIRRt-1 , where S t-1 denotes the top-k stocks selected by the STP methods, ct-1 i and cti denote the closing price on trading day t - 1 and trading day t, respectively. CIRRt-1 is the cumulative return ratio on trading day t - 1. Fig.5a shows the variation in cumulative return ratios for various STP methods, starting with an initial CIRR of 0 and selecting the top-10 stocks. As shown in Fig.5a, subsequent to March 2017, our MSTNN approach consistently stands out as a leading contender in cumulative return ratios throughout the investment simulation. As illustrated in Fig. 5b, at the last trading date, MSTNN secures the highest cumulative investment return at 37.12%, outperforming the runner-up, Sthan-sr, by 7.77%. This highlights MSTNN's strong profitability over the long term.
4.5 Ablation Study
In this section, we evaluate how various MSTNN variants perform on the NASDAQ and NYSE datasets to assess the effectiveness of different components. Specifically, 1) MSTNN w/o 3D-CNN: It is obtained by leaving out the 3D-MCNN module. 2) MSTNN w/o Filter A: It is created by excluding the convolutional filter 3 × 3 × 3 from the 3D-MCNN module. 3) MSTNN w/o Filter B: it is obtained by removing the convolutional filter 5 × 5 × 3 from the 3D-MCNN module. 4) MSTNN w/o THAN : It is obtained by removing the temporal hypergraph learning module, namely THAN module. 5) MSTNN w/o THFL: it is achieved by eliminating Temporal Hyperedge Feature Learning (THFL) from the THAN module. 6) MSTNN w/o PPE: it is achieved by removing the Periodic Position Encoding (PPE) from the THFL mechanism. 7) MSTNN with APE: it is achieved by substituting the PPE in the HTFA mechanism with Absolute Position Encoding (APE). That is, a unique positional encoding is used for the features of each hyperedge at each time step.
The experimental results of different variants of MSTNN on both datasets are presented in Table 2. Compared to the full model, the MSTNN w/o THAN variant shows a notable decline of 8.51% and 9.57% in F1-score on both datasets, respectively. This highlights the importance of exploring the trends of periodic variation of the stock price within an industry through the THAN module. The variants MSTNN w/o Filter A and MSTNN w/o Filter B show decreased performance at varying levels compared to the complete model, highlighting the significance of employing diverse filter sizes in the MSCNN module.
The performance of MSTNN w/o 3D-CNN shows a marked decline in the F1 score, dropping by 26.68% on the NASDAQ dataset and 34.41% on the NYSE dataset, highlighting the essential importance of the 3D-MCNN module in enhancing the STP results. The MSTNN w/o THFL variant, which omits the representation of hyperedge features as temporal sequences, shows a notable reduction in both recall and F1 scores across the data sets. This illustrates the efficacy of the proposed THFL, which captures the temporal variation patterns among stocks through high-order relationships, including industryspecific stock price trends.
Examining the experimental results of the variations MSTNN w/o PPE and MSTNN with APE reveals the essential
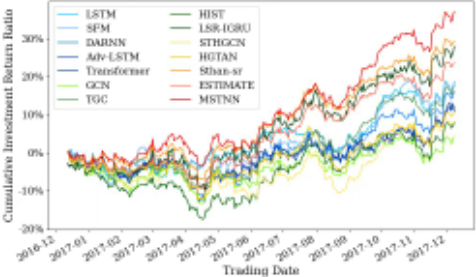
- (a) The curves of cumulative return ratio over time.
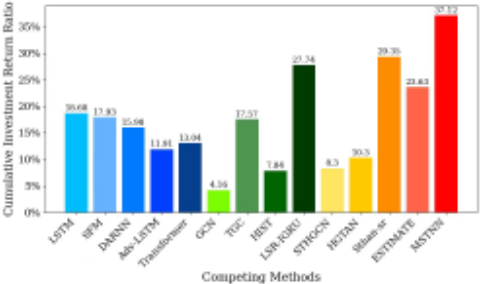
(b) Cumulative return ratio on the last trading date
Figure 5: Cumulative return ratio of competing methods.
function of periodic position encoding in the THFL module, as evidenced by the significant drops in performance. While the MSTNN with APE variant markedly outperforms MSTNN w/o PPE in terms of F1-score, it nonetheless exhibits lower performance than our full model. This is because MSTNN with APE uses conventional position encoding, which focuses only on the overall order of the input temporal sequence and fails to accurately capture the changes within periodic intervals.
5 RelatedWork
Time-Series DataModeling (TSDM) Methods. In recent years, many powerful TSDM STP methods, for instance, LSTM [Hochreiter and Schmidhuber, 1997] based methods such as SFM [Zhang et al., 2017], DARNN [Qin et al., 2017] and Adv-LSTM [Feng et al., 2019a] as well as Transformer [Vaswani et al., 2017] based methods, including HMG-TF [Ding et al., 2021] and TEANet [Zhang et al., 2022b], were proposed and could provide encouraging results. However, these methods make predictions based solely on a linear temporal sequence with a constrained receptive field, which overlooks the rich periodic patterns in the time series data of the stock. Furthermore, these techniques consider each stock in isolation and ignore the intricate interconnections between them, which hampers the achievement of superior STP results. In contrast, our model MSTNN is capable of effectively capturing the periodic patterns in the time series data of stocks using 3D convolution and takes into account the inter-stock correlation information through hypergraph learning.
Graph Learning (GL) Based Methods. Generally, this group of methods incorporate TSDM methods with graph learning methods, which considers the correlation information among stocks to improve STP performance. GL based methods utilizing graph neural networks, such as TGC [Feng et al., 2019b], Hats [Kim et al., 2019] and HIST [Xu et al., 2021], improve STP results by the pairwise correlations between stocks. However, the relations between stocks are much more intricate than mere pairwise relations in practical scenarios and simplify such complex correlation information into pairwise formats could result in the loss of significant information, thus diminishing effectiveness [Cui et al., 2023;
Song et al., 2024]. In order to model the intricate correlation information among stocks, GL based methods using hypergraph neural networks, such as STHGCN [Sawhney et al., 2020], Sthan-sr [Sawhney et al., 2021], ESTIMATE [Huynh et al., 2023] and HGTAN [Cui et al., 2023], which utilize the high-order correlation information among stocks, have been proposed. However, these methods discussed above ignore temporal information embedded in the hyperedge features, while our approach takes into account the sequences of hyperedge features under various time steps as time series data, effectively utilizing the temporal patterns of hyperedges to improve hypergraph learning on spatio-temporal datasets.
6 Conclusions and Discussions
In this work, we present a novel STP framework, namely MSTNN, which takes into account both the periodic variation patterns of each stock and the fluctuation trend of the corresponding industry. Specifically, given the stock sequence data, MSTNN first employs a new 3D Multi-scale Convolutional Neural Network (3D-MCNN) to learn periodic fluctuation patterns of individual stocks on different temporal scales. Then, MSTNN learns the time-varying trend of stock prices of one industry by a temporal hypergraph attention network, where each industry is represented by a hyperedge and the time series data of each industry is segmented into multiple temporal hyperedge sequence over periodic interval for capturing the industry trend. Our proposed method achieves the best STP results on all experimental datasets, and extensive ablation studies demonstrate the effectiveness of each component in our MSTNN.
Limitations. The proposed 3D-MCNN module is used to identify the periodic fluctuation pattern of each stock. However, this module requires gathering extensive stock price data over prolonged periods, resulting in a three-dimensional tensor structured by years,months, and days. Thus, 3D-MCNN may not be effective in dealing with brief spans of stock price data, thus restricting its practical use. In future work, we would like to address the above issue by exploring more adaptable techniques for detecting periodic fluctuation patterns that do not necessitate extensive data collection.
Acknowledgements
The research was supported in part by National Nature Science Foundation of China under Grant No. 62433016, Guangdong Basic and Applied Basic Research Foundation under Grant No. 2024A1515011715, 2025A1515012995, and CCFZhipu Large Model Innovation Fund under Grant No. CCFZhipu202413.
@inproceedings{ijcai2025p364,
  title     = {Multi-Scale Temporal Neural Network for Stock Trend Prediction Enhanced by Temporal Hyepredge Learning},
  author    = {Song, Lingyun and Li, Haodong and Chen, Siyu and Gan, Xinbiao and Shi, Binze and Ma, Jie and Pan, Yudai and Wang, Xiaoqi and Shang, Xuequn},
  booktitle = {Proceedings of the Thirty-Fourth International Joint Conference on
               Artificial Intelligence, {IJCAI-25}},
  publisher = {International Joint Conferences on Artificial Intelligence Organization},
  editor    = {James Kwok},
  pages     = {3272--3280},
  year      = {2025},
  month     = {8},
  note      = {Main Track},
  doi       = {10.24963/ijcai.2025/364},
  url       = {https://doi.org/10.24963/ijcai.2025/364},
}
TY - CPAPER TI - Multi-Scale Temporal Neural Network for Stock Trend Prediction Enhanced by Temporal Hyepredge Learning AU - Song, Lingyun AU - Li, Haodong AU - Chen, Siyu AU - Gan, Xinbiao AU - Shi, Binze AU - Ma, Jie AU - Pan, Yudai AU - Wang, Xiaoqi AU - Shang, Xuequn T2 - Proceedings of the Thirty-Fourth International Joint Conference on Artificial Intelligence, IJCAI-25 PB - International Joint Conferences on Artificial Intelligence Organization PY - 2025 SP - 3272 EP - 3280 DO - 10.24963/ijcai.2025/364 UR - https://doi.org/10.24963/ijcai.2025/364 ER -Copied
Machine-readable versions of this paper, for tools and AI agents:





