
GCTAM: Global and Contextual Truncated Affinity Combined Maximization Model For Unsupervised Graph Anomaly Detection
Proceedings of the Thirty-Fourth International Joint Conference on Artificial Intelligence. Main Track. Pages 3642-3650.
https://doi.org/10.24963/ijcai.2025/405
Keywords
- Machine Learning: ML: Sequence and graph learning
- Machine Learning: ML: Unsupervised learning
- Data Mining: DM: Anomaly/outlier detection
Abstract
Anomalies often occur in real-world information networks/graphs, such as malevolent users, malicious comments, banned users, and fake news in social graphs.
The latest graph anomaly detection methods use a novel mechanism called truncated affinity maximization (TAM) to detect anomaly nodes without using any label information and achieve impressive results.
TAM maximizes the affinities among the normal nodes while truncating the affinities of the anomalous nodes to identify the anomalies.
However, existing TAM-based methods truncate suspicious nodes according to a rigid threshold that ignores the specificity and high-order affinities of different nodes.
This inevitably causes inefficient truncations from both normal and anomalous nodes, limiting the effectiveness of anomaly detection.
To this end, this paper proposes a novel truncation model combining contextual and global affinity to truncate the anomalous nodes.
The core idea of the work is to use contextual truncation to decrease the affinity of anomalous nodes, while global truncation increases the affinity of normal nodes.
Extensive experiments on massive real-world datasets show that our method surpasses peer methods in most graph anomaly detection tasks.
In highlights, compared with previous state-of-the-art methods, the proposed method has +15% ~ +20% improvements in two famous real-world datasets, Amazon and YelpChi.
Notably, our method works well in large datasets, Amazin-all and YelpChi-all, and achieves the best results, while most previous models cannot complete the tasks.
- [Chai et al., 2022] Ziwei Chai, Siqi You, Yang Yang, Shil- iang Pu, Jiarong Xu, Haoyang Cai, and Weihao Jiang. Can abnormality be detected by graph neural networks? In Proceedings of the Twenty-Ninth International Joint Con- ference on Artificial Intelligence (IJCAI), Vienna, Austria, pages 23-29, 2022. IJCAI
- [Ding et al., 2019] Kaize Ding, Jundong Li, Rohit Bhanushali, and Huan Liu. Deep anomaly detection on attributed networks. In Proceedings of the 2019 SIAM international conference on data mining, pages 594-602.
- [Dou et al., 2020] Yingtong Dou, Zhiwei Liu, Li Sun, Yu- tong Deng, Hao Peng, and Philip S Yu. Enhancing graph neural network-based fraud detectors against camouflaged fraudsters. In Proceedings of the 29th ACM International Conference on Information & Knowledge Management, pages 315-324, 2020.
- [Duan et al., 2023] Jingcan Duan, Siwei Wang, Pei Zhang, En Zhu, Jingtao Hu, Hu Jin, Yue Liu, and Zhibin Dong. Graph anomaly detection via multi-scale contrastive learn- ing networks with augmented view. In Proceedings of the AAAI conference on artificial intelligence, volume 37, pages 7459-7467, 2023.
- [Fan et al., 2020] Haoyi Fan, Fengbin Zhang, and Zuoyong Li. Anomalydae: Dual autoencoder for anomaly detec- tion on attributed networks. In ICASSP 2020-2020 IEEE International Conference on Acoustics, Speech and Signal Processing (ICASSP), pages 5685-5689. IEEE, 2020.
- [Feng et al., 2022] Shangbin Feng, Zhaoxuan Tan, Herun Wan, Ningnan Wang, Zilong Chen, Binchi Zhang, Qinghua Zheng, Wenqian Zhang, Zhenyu Lei, Shujie Yang, et al. Twibot-22: Towards graph-based twitter bot detection. Advances in Neural Information Processing Systems, 35:35254-35269, 2022.
- [Huang et al., 2021] Tianjin Huang, Yulong Pei, Vlado Menkovski, and Mykola Pechenizkiy. Hop-count based self-supervised anomaly detection on attributed networks. arXiv preprint arXiv:2104.07917, 2021.
- [Kipf and Welling, 2016] Thomas N Kipf and Max Welling. Semi-supervised classification with graph convolutional networks. In ICLR, 2016.
- [Kumar et al., 2019] Srijan Kumar, Xikun Zhang, and Jure Leskovec. Predicting dynamic embedding trajectory in temporal interaction networks. In Proceedings of the 25th ACM SIGKDD international conference on knowl- edge discovery & data mining, pages 1269-1278, 2019.
- [Liu et al., 2012] Fei Tony Liu, Kai Ming Ting, and Zhi-Hua Zhou. Isolation-based anomaly detection. ACM Transac- tions on Knowledge Discovery from Data (TKDD), 6(1):1- 39, 2012.
- [Liu et al., 2021] Yixin Liu, Zhao Li, Shirui Pan, Chen Gong, Chuan Zhou, and George Karypis. Anomaly detec- tion on attributed networks via contrastive self-supervised learning. IEEE transactions on neural networks and learn- ing systems, 33(6):2378-2392, 2021.
- [Luo et al., 2022] Xuexiong Luo, Jia Wu, Amin Beheshti, Jian Yang, Xiankun Zhang, Yuan Wang, and Shan Xue. Comga: Community-aware attributed graph anomaly de- tection. In Proceedings of the Fifteenth ACM International Conference on Web Search and Data Mining, pages 657- 665, 2022.
- [Pang et al., 2021] Guansong Pang, Anton van den Hengel, Chunhua Shen, and Longbing Cao. Toward deep super- vised anomaly detection: Reinforcement learning from partially labeled anomaly data. In Proceedings of the 27th ACM SIGKDD conference on knowledge discovery & data mining, pages 1298-1308, 2021.
- [Peng et al., 2018] Zhen Peng, Minnan Luo, Jundong Li, Huan Liu, Qinghua Zheng, et al. Anomalous: A joint mod- eling approach for anomaly detection on attributed net- works. In IJCAI, volume 18, pages 3513-3519, 2018. IJCAI
- [Pourhabibi et al., 2020] Tahereh Pourhabibi, Kok-Leong Ong, Booi H Kam, and Yee Ling Boo. Fraud de- tection: A systematic literature review of graph-based anomaly detection approaches. Decision Support Systems, 133:113303, 2020.
- [Qiao and Pang, 2024] Hezhe Qiao and Guansong Pang. Truncated affinity maximization: One-class homophily modeling for graph anomaly detection. Advances in Neu- ral Information Processing Systems, 36, 2024.
- [Qiao et al., 2024] Hezhe Qiao, Qingsong Wen, Xiaoli Li, Ee-Peng Lim, and Guansong Pang. Generative semi- supervised graph anomaly detection. arXiv preprint arXiv:2402.11887, 2024.
- [Tang et al., 2008] Jie Tang, Jing Zhang, Limin Yao, Juanzi Li, Li Zhang, and Zhong Su. Arnetminer: extraction and mining of academic social networks. In Proceedings of the 14th ACM SIGKDD international conference on Knowl- edge discovery and data mining, pages 990-998, 2008.
- [Tang et al., 2022] Jianheng Tang, Jiajin Li, Ziqi Gao, and Jia Li. Rethinking graph neural networks for anomaly de- tection. In International Conference on Machine Learn- ing, pages 21076-21089. PMLR, 2022.
- [Wang et al., 2022] Qizhou Wang, Guansong Pang, Mahsa Salehi, Wray Buntine, and Christopher Leckie. Cross- domain graph anomaly detection via anomaly-aware con- trastive alignment. arXiv preprint arXiv:2212.01096, 2022.
- [Xu et al., 2022] Zhiming Xu, Xiao Huang, Yue Zhao, Yushun Dong, and Jundong Li. Contrastive attributed network anomaly detection with data augmentation. In Pacific-Asia Conference on Knowledge Discovery and Data Mining, pages 444-457. Springer, 2022.
- [Zhang et al., 2022] Jiaqiang Zhang, Senzhang Wang, and Songcan Chen. Reconstruction enhanced multi-view con- trastive learning for anomaly detection on attributed net- works. arXiv preprint arXiv:2205.04816, 2022. IJCAI
- [Zheng et al., 2021a] Yu Zheng, Ming Jin, Yixin Liu, Lian- hua Chi, Khoa T Phan, and Yi-Ping Phoebe Chen. Gen- erative and contrastive self-supervised learning for graph anomaly detection. IEEE Transactions on Knowledge and Data Engineering, 35(12):12220-12233, 2021.
- [Zheng et al., 2021b] Yu Zheng, Ming Jin, Yixin Liu, Lian- hua Chi, Khoa T Phan, and Yi-Ping Phoebe Chen. Gen- erative and contrastive self-supervised learning for graph anomaly detection. IEEE Transactions on Knowledge and Data Engineering, 2021.
- [Zheng et al., 2021c] Yu Zheng, Ming Jin, Yixin Liu, Lian- hua Chi, Khoa T Phan, and Yi-Ping Phoebe Chen. Gen- erative and contrastive self-supervised learning for graph anomaly detection. IEEE Transactions on Knowledge and Data Engineering, 35(12):12220-12233, 2021.
- [Zhou et al., 2022] Shuang Zhou, Xiao Huang, Ninghao Liu, Qiaoyu Tan, and Fu-Lai Chung. Unseen anomaly detec- tion on networks via multi-hypersphere learning. In Pro- ceedings of the 2022 SIAM International Conference on Data Mining (SDM), pages 262-270. SIAM, 2022.
References were extracted automatically from the PDF and may contain errors.
Full text extracted automatically from the PDF; figures, tables and equations may differ. The PDF is the version of record.
1 Introduction
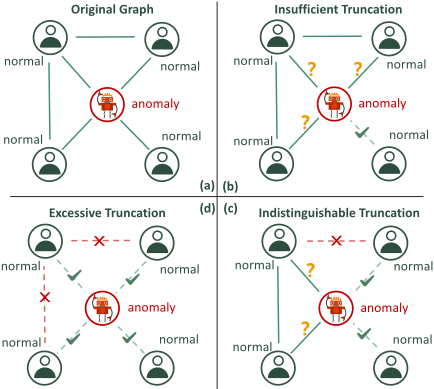
Graph anomaly detection (GAD) aims to identify patterns that significantly deviate from the majority within a graph. Depending on the detection task, it can be categorized into three levels: node-level (Fig.1(a)), edge-level, and subgraphlevel. With the widespread availability of information through anonymous accounts on commercial websites and telecommunications networks, these platforms have become prime targets for fraudsters and attackers seeking to spread
misinformation, cause disruptions, and engage in malicious activities [Pourhabibi et al., 2020]. Due to its broad practical applications, node-level graph anomaly detection has garnered significant research interest [Pourhabibi et al., 2020; Feng et al., 2022; Tang et al., 2022; Fan et al., 2020], particularly in areas such as financial transaction networks and social networks. For instance, detecting anomalous accounts is crucial as they may have fraudulent transactions [Tang et al., 2022]. Likewise, social networks often contain anomalous nodes, such as social bots that disseminate rumors and false information [Feng et al., 2022]. Therefore, effective nodelevel graph anomaly detection plays a crucial role in enhancing the security and reliability of complex networks by mitigating fraudulent activities and ensuring data integrity. For convenience, all references to graph anomaly detection in the following article will specifically refer to node-level GAD.
Graph neural networks (GNNs) have been widely used in graph anomaly detection (GAD) by leveraging their ability to capture complex graph structures. Due to the frequent updates and changes in real-world networks, it is generally difficult to provide complete label information for GNN models. As a result, traditional supervised learning algorithms are not well-suited for graph anomaly detection tasks. Existing self-supervised GNN-based approaches for GAD can be categorized into reconstruction-based and contrastive-based selfsupervised learning methods, such as DOMINANT [Ding et al., 2019] and ComGA [Luo et al., 2022], which detect anomalies by reconstructing adjacency and attribute matrices and identifying nodes with high reconstruction errors, assuming that anomalous nodes deviate significantly from normal patterns. On the other hand, self-supervised learning approaches, including Cola[Liu et al., 2021], utilize contrastive and generative learning objectives to extract meaningful node representations and identify irregularities based on relational inconsistencies. While reconstruction-based methods minimize the reconstruction error, resulting in numerous cases in which non-trivial nodes are misidentified, contrastive-based learning methods randomly generate the augmented graphs, which become unstable and do not achieve optimal performance in real-world data environments. In recent years, the truncated affinity maximization (TAM) method [Qiao and Pang, 2024], based on the homogeneity assumption, has achieved state-of-the-art results in anomaly detection. This approach learns node representations for anomaly identification by maximizing the truncation affinity between a node and its neighbors while truncating the affinities of the anomalous nodes to identify the anomalies.
Existing TAMmethods typically truncate suspicious nodes based on a rigid or predefined threshold, such as one computed using Euclidean distance. However, this approach overlooks the specificity and high-order affinities of different nodes, leading to suboptimal truncation performance. For instance, as illustrated in Fig.1(b), an insufficient truncation distance threshold may fail to remove all edges between normal and anomalous nodes, resulting in incomplete truncation. Moreover, as shown in Fig.1(c), an indistinguishable truncation threshold not only fails to effectively separate anomalous edges but may also mistakenly truncate normal edges between normal nodes, further complicating the detection process. Conversely, as depicted in Fig. 1(d), an excessively high truncation threshold leads to over-truncation, which removes most of the edges of nodes. This, in turn, results in the affinity of the node being calculated as zero, making it impossible to detect anomalies. In summary, the use of rigid truncation thresholds in existing methods significantly hampers the accurate calculation of node affinities, ultimately reducing the effectiveness of anomaly detection.
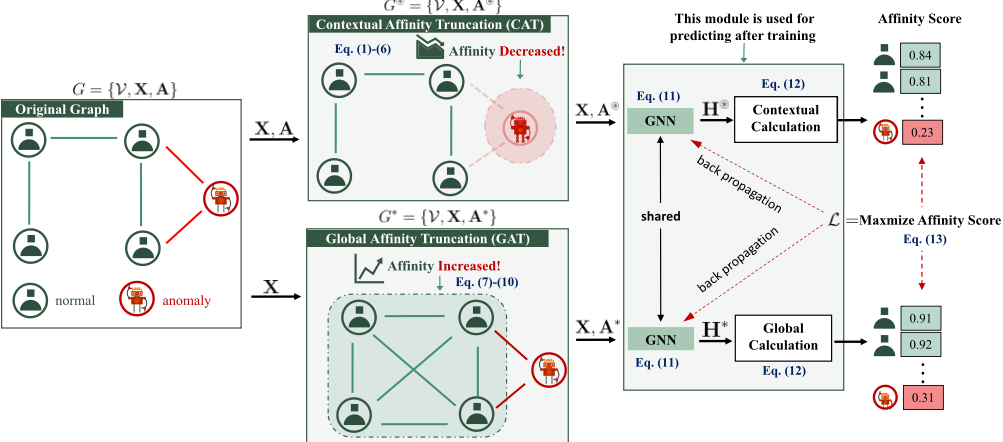
To this end, we propose GCTAM, a global and contextual truncation affinity combined maximization model for unsupervised graph anomaly detection. Specifically, we introduce a contextual affinity truncation module that truncates the edges between normal and anomalous nodes, effectively reducing anomaly affinity while preserving the affinity of normal node relationships, which enhances the discriminative capability of our framework, thereby ensuring robust performance in downstream anomaly detection tasks. Secondly, we design a global affinity truncation module based on the homogeneity assumption. This model constructs a global affinity truncation graph that enriches edge connectivity between normal nodes, aiming to increase the affinity of nodes. Doing so further enhances the performance of the contextual truncation affinity module. Finally, we introduce shared parameter graph convolution networks (GCNs) to integrate node representations from both the contextual and global affinity truncation graphs, and the unified representation is better equipped to distinguish the local affinities of normal nodes from those of anomalous nodes. Through extensive experimental comparisons on seven real-world GAD datasets, empirical results demonstrate that GCTAM outperforms eight competing models. Notably, on more challenging datasets, GCTAM achieves +15% ∼ +20% improvements in AUROC and AUPRC compared with the best-performing competitor. The code can be found at https://github.com/kgccc/GCTAM.
In summary, our contributions are as follows:
- Based on the homogeneity assumption, we introduce a contextual affinity truncation model to address the challenges of insufficient, indistinguishable, and excessive truncation.
- We further present a global affinity truncation model that improves node affinities within the global affinity truncation graph, facilitating the contextual affinity truncation model to learn more discriminative node representations for effective anomalous node detection.
- We propose the model GCTAM that effectively integrates the contextual affinity truncation (CAT) and global affinity truncation (GAT) modules, enhancing the overall performance through their complementary strengths. Empirical results on seven real-world GAD datasets demonstrate that our GCTAM model significantly outperforms eight competing models.
2 RelatedWork
In this section, we briefly introduce reconstruction-based selfsupervised learning, contrastive-based self-supervised learning, and affinity-based unsupervised learning methods.
2.1 Reconstruction-based Self-Supervised Learning
Reconstruction-based self-supervised methods usually use a graph auto-encoder (GAE) focusing on learning a node representation of a GAD by minimizing errors in reconstructing node attributes and graph structures. For example, DOMINANT[Ding et al., 2019] pioneered the first generative GAD method to learn node embeddings by minimizing the reconstruction error of attribute and adjacency matrices while exploiting attribute and topological features. AnomalyDAE[Fan et al., 2020] decouples attribute and structural encoders to efficiently model interactions. ComGA [Luo et al., 2022] incorporates community detection. ANOMALOUS [Peng et al., 2018] jointly considered CUR decomposition and residual analysis for anomaly detection in attribute networks. These methods ignore the anomaly-discriminative property of abnormal nodes in anomaly monitoring, thus limiting their anomaly detection capabilities.
2.2 Contrastive-based Self-Supervised Learning
For contrastive learning-based methods, CoLA [Liu et al., 2021] addresses challenges with a contrastive learning paradigm, using a discriminator to detect inconsistencies between the target node and the neighbor subgraph embeddings. ANEMONE [Zheng et al., 2021a] introduces a patch-level contrastive task for multi-scale anomaly detection. GRADATE [Duan et al., 2023] improves the framework through graph augmentation and multi-view contrast. SL-GAD [Zheng et al., 2021b] combines attribute reconstruction and node-subgraph contrast, while Sub-CR [Zhang et al., 2022] uses a masked autoencoder and graph diffusion to fuse attributes with local and global topological information. Although these methods build classification models on the relationship between nodes and context subgraphs, this group of methods is not designed for the task of anomaly detection, and their performance depends largely on the relationship between pre-tasks and anomaly detection.
2.3 Affinity-based Unsupervised Learning
Apart from the two main categories, an anomaly detection method based on the homogeneity assumption, TAM [Qiao and Pang, 2024], has achieved the best results by learning the node representations for our anomaly measurements by maximizing the local affinity between a node and its neighbors. Although TAM achieves the best results, it ignores the specificity of different nodes by truncating suspicious nodes based on the rigid Euclidean distance threshold.
3 Method
This section presents GCTAM, a model that integrates contextual and global truncated affinity maximization. As shown in Fig. 2, it consists of two key modules: contextual affinity truncation (CAT) and global affinity truncation (GAT). CAT iteratively removes anomalous edges to reduce anomaly affinity while retaining normal ones. GAT constructs a global affinity graph to enhance normal node affinities, further reinforcing CAT's effectiveness.
3.1 Preliminaries
We tackle unsupervised anomaly detection on an attributed graph. Supposing that G = (V,A,X) is an attributed graph with N nodes, where V = {v1, · · · , vN} denotes its node set. Then, we denote the matrix X ∈ RN×d as the attributes' feature of all nodes where xi ∈ Rd is the d-dimensional attribute vector of node vi. And A ∈ {0, 1}N×N is the adjacency matrix of graph G with Aij = 1 if vi and vj are connected. The proposed model aims to learn an affinity score, AS(·), such that AS(v) ≫ AS(v′ ) for any v ∈ Vn, v′ ∈ Va, where Vn and Va denotes the set of normal and abnormal nodes, respectively. According to the nature of GAD, it is typically assumed that |Vn| ≫ |Va|.
3.2 CAT: Contextual Affinity Truncation
In this paper, we propose a module, CAT, designed to preserve edges between normal nodes while effectively truncating edges connecting normal and anomalous nodes based on contextual affinity among their neighbors. By avoiding reliance on a fixed Euclidean distance, CAT reduces the risk of incorrect edge truncation. This approach keeps the affinity among normal nodes while effectively decreasing the affinity of anomalous nodes. In detail, it consists of two important processes: (1) selecting the normal edge to be preserved based on each node's cosine similarity with its neighbors, and (2) truncating the anomaly edges based on contextual affinity.
First, we calculate the cosine similarity between the attribute features X. Then, the result is combined with the original adjacent matrix A through the Hadamard Product (⊙) to establish a similarity-based graph adjacent matrix S.
Then, we select top-n nodes similar to each node as its contextual candidate nodes and set the edges to 1.0. Meanwhile, we set the rest of the edges in S to zero and create a contextual adjacent matrix ˆA, as Eq.(2).
where top-n(Si) refers to top-n largest similarity in Si and N(vi) is the neighbors of node vi. Thus, it is easy to observe that the contextual adjacency matrix ˆA consists of the relation between the nodes and their contextual neighbors.
After, similar to the similarity-based graph adjacent matrix S, we create an Euclidean Distance-based graph adjacent matrix E, as Eq.(3).
where xi,k represents the values of nodes vi in the k-th feature dimension, and d is the dimensionality of the feature space. The given formulation represents the matrix E is derived by the Hadamard Product of the distance matrices ̂E and the adjacency matrix A, and the elements of matrix ̂E are calculated using the Euclidean distance.
Then, we combine the distance matrix E with the similarity matrix S to compute the contextual affinity matrix C, which is formulated as follows:
where Normalize(·) is the normalization operation to transfer the value space of E the same as S. Next, we truncate the anomaly edges based on the contextual affinity matrix C and remove anomaly edges more accurately by considering both Euclidean distance and Cosine similarity.
Here, σ(·) is the binary step function where σ(x) = 1 if x > 0, and σ(x) = 0 if x ≤ 0. Besides, N(vi) denotes the neighbors of a node vi. Since the term ∑j Ci,j |N(vi)| calculates the average affinity of node vi, θij represents the truncation when the affinity between vi and vj is lower than the average affinity. Based on the above analysis, the Eq. (5) represents the further truncation if an edge is not selected in the contextual adjacent matrix ˆA. Meanwhile, the maximum truncation is limited to the ratio ≤ β of the total edges of the graph. Here, β is a hyperparameter that will be discussed in the experiment. The outcome, A⊛, is a final truncated adjacency matrix that effectively filters out edges failing to meet the specified contextual affinity threshold.
Finally, the proposed contextual affinity truncation mechanism, which integrates contextual affinity with Euclidean distance, enables more precise preservation of normal edges while effectively truncating anomalous edges to reduce the affinities of anomalous nodes. The resulting truncated graph G⊛ is defined as follows:
3.3 GAT: Global Affinity Truncation
Based on the assumption that similar nodes are more likely to have normal edge relationships, we designed the global affinity truncation graph. This graph further enhances the contextual truncation module by increasing the affinities of normal nodes. Two key processes are involved to synthesize this graph effectively: (1) node feature projection, which parametrically projects node features to a suitable space, and (2) global affinity adjacency matrix synthesis, which constructs adjacency matrices based on pairwise similarity.
First, we applied a multilayer perceptron (MLP) to project the features of nodes with different feature distributions X into a unified feature space Z, which is computed by:
To construct the global affinity adjacent matrix, we then calculate the node-to-node similarity based on the unified feature space Z. The equation (8) presents the process for calculating the node similarity:¯S = Z · ZT (8)
where ¯S ∈ RN×N is the global affinity matrix and N is the total number of graph nodes.
The global affinity adjacent matrix ¯S is usually dense and represents a fully connected graph, which is often not meaningful for most applications and can lead to expensive computational costs. Therefore, we apply the k-nearest neighbors (kNN)-based sparsification on ¯S. Specifically, we retain the edges with the top-k connection values for each node and set the rest to zero. Let A∗ represent the sparse global affinity matrix, which is defined as:
where top-k(Si) is the set of top-k values of row vector ¯Si.
At last, by combining the graph-independent node feature Z and the sparse adjacent matrix ¯A, we have the global affinity truncation graph G∗ which can be expressed as follows:
3.4 Affinity CombinedMaximization
So far, we have obtained the contextual truncation graph G⊛ and the global affinity truncation graph G∗ . GCTAM is designed to learn a GNN-based affinity combined maximization model that maximizes the affinity of normal nodes while decreasing the affinity of anomaly nodes. Specifically, the projection from the graph nodes onto new representations using GNN layers. In this work, we employ graph convolution networks (GCNs) [Kipf and Welling, 2016] due to their computational efficiency. The node representations are computed as follows:
where Θ denotes the shared learnable parameters. Thus, we can notice that H⊛ and H∗ represent the node representations obtained from the contextual truncation graph G⊛ and the global affinity truncation graph G∗ , respectively.
Affinity Score Calculation. We calculate the local affinity of each node to its neighbors to exploit this homophily property for unsupervised GAD. The local affinity can be defined as an averaged affinity to the neighboring nodes:
where N ⊛(vi) and N ∗ (vi) are the neighbor sets of node vi in the contextual affinity truncation graph G⊛ and the global affinity truncation graph G∗ , respectively. Similarly, AS ⊛(vi) and AS ∗ (vi) represent the affinity score of the node vi in the two types graphs. The larger the affinity, the more likely the node is normal, while a smaller affinity indicates a higher probability that the node is anomalous.
Learning Objective. Finally, our optimization objective is maximizing the node affinities based on the contextual affinity truncation graph G⊛ and global affinity truncation graph G∗ . Since we reduce the affinities of anomalous nodes in the contextual affinity truncation graph, we enhance the affinities of normal nodes in the global affinity truncation graph. By maximizing the node affinities, we can effectively distinguish between normal and anomalous nodes. The optimization objective function is formulated as follows:
By optimizing the above equation, the local affinity of each node can be maximized based on the learned node representations, H⊛ and H∗ , derived from the contextual affinity truncation graph G⊛ and the global affinity truncation graph G∗ .
4 Experiment
4.1 Experiment Settings
Datasets. We conduct the experiments on seven widely used publicly available real-world GAD datasets from diverse social networks, and citation networks, including Amazon [Dou et al., 2020], YelpChi [Kumar et al., 2019], ACM [Tang et al., 2008], Facebook [Xu et al., 2022], and Reddit. The ACM dataset contains two types of injected anomalies, contextual and structural anomalies [Liu et al., 2021; Ding et al., 2019], that are nodes with significantly deviated graph structure and node attributes, respectively. The other six datasets contain real anomalies. The statistics of all datasets are shown in Table 1.
| Dataset | Type | R/I | Nodes | Edges | Attributes | Anomalies(Rate) |
|---|---|---|---|---|---|---|
| Amazon | Co-review | R | 10244 | 175,608 | 25 | 693(6.66%) |
| YelpChi | Co-review | R | 24,741 | 49,315 | 32 | 1,217(4.91%) |
| ACM | Citation Networks | I | 16,484 | 71,980 | 8,337 | 597(3.63%) |
| Social Networks | R | 1,081 | 55,104 | 576 | 27(2.49%) | |
| Social Networks | R | 10,984 | 168,016 | 64 | 366(3.33%) | |
| Amazon-all | Co-review | R | 11,944 | 4,398,392 | 25 | 821(6.87%) |
| YelpChi-all | Co-review | R | 45,941 | 3,846,979 | 32 | 6,674(14.52%) |
Baselines. GCTAM is compared with a total of eight stateof-the-art (SOTA) methods. The three contrastive-based self-supervised methods are CoLA [Liu et al., 2021], SLGAD [Zheng et al., 2021c], and HCM-A [Huang et al., 2021], while four are reconstruction-based self-supervised methods, namely DOMINANT [Ding et al., 2019], iForest [Liu et al., 2012], ANOMALOUS [Peng et al., 2018] and ComGA [Luo et al., 2022]. One semi-supervised model, GGAD [Qiao et al., 2024]. Additionally, GCTAM is compared with the affinity-based SOTA method, TAM [Qiao and Pang, 2024]. Evaluation Settings. Following [Qiao and Pang, 2024; Chai et al., 2022; Pang et al., 2021; Wang et al., 2022; Zhou et al., 2022], two popular and complementary evaluation metrics for anomaly detection, Area Under the Receiver Operating Characteristic Curve (AUROC) and Area Under the precision-recall curve (AUPRC), are used. Higher AUROC/AUPRC indicates better performance. The reported average and standard deviation of AUROC and AUPRC results are averaged over 5 runs with different random seeds.
4.2 Main Results
The AUROC and AUPRC results for the seven real-world GAD datasets are reported in Table 2. For most of the datasets, GCTAM consistently outperforms all competing methods in both AUROC and AUPRC. However, it achieved weaker performance than CoLA and TAM, which may be caused by the low homophily distribution of normal nodes and anomaly nodes in the Reddit dataset. Moreover, we observe that the TAM model achieves the second-best performance among all compared methods, highlighting that the truncated affinity maximization approach is better suited for node-level graph anomaly detection than other methods. Notably, on the challenging Amazon dataset, GCTAM achieves a substantial improvement of +11.26 in AUROC and +24.35 in AUPRC over GGAD, the best-performing competitor. Similarly, on the Yelp dataset, GCTAM demonstrates a remarkable enhancement of +16.20 in AUROC and +3.64 in AUPRC over GGAD. Moreover, for the large-scale Amazonall dataset, GCTAM outperforms TAM by +4.13 in AUROC
| Metric | Method | Amazon | YelpChi | ACM | Amazon-all | YelpChi-all | ||
|---|---|---|---|---|---|---|---|---|
| iForest (2012) | 56.21±0.8 | 41.20±4.0 | 51.18±1.8 | 53.82±1.5 | 43.63±2.0 | - | - | |
| ANOMALOUS (2018) | 44.57±0.3 | 49.56±0.3 | 68.56±6.3 | 90.21±0.5 | 53.87±1.2 | - | - | |
| DOMINANT (2019) | 59.96±0.4 | 41.33±1.0 | 85.69±2.0 | 56.77±0.2 | 55.55±1.1 | - | - | |
| CoLA (2021) | 58.98±0.8 | 46.36±0.1 | 82.33±0.1 | 84.34±1.1 | 60.28±0.7 | 74.36±1.2 | 50.77±0.9 | |
| AUROC | SL-GAD (2021) | 59.37±1.1 | 33.12±3.5 | 84.79±0.5 | 79.36±0.5 | 56.77±0.5 | - | - |
| HCM-A (2022) | 39.56±1.4 | 45.93±0.5 | 80.60±0.4 | 73.87±3.2 | 45.93±1.1 | - | - | |
| ComGA (2022) | 58.95±0.8 | 43.91±0.0 | 82.21±2.5 | 60.55±0.0 | 54.53±0.3 | - | - | |
| TAM (2023) | 70.64±1.0 | 56.43±0.7 | 88.78±2.4 | 91.44±0.8 | 60.23±0.4 | 84.76±0.7 | 58.18±0.5 | |
| GGAD (2024)* | 73.12±0.8 | 62.80±0.9 | 36.91±2.1 | 70.66±3.6 | 60.07±0.8 | 82.30±1.1 | 55.34±1.2 | |
| GCTAM(ours) | 84.38±1.4 | 79.00±0.5 | 90.77±1.5 | 92.38±0.3 | 59.21±0.6 | 88.89±0.6 | 59.57±0.4 | |
| ∆ | ↑11.26 | ↑16.20 | ↑1.99 | ↑0.94 | ↓ 1.07 | ↑4.13 | ↑1.39 | |
| iForest (2012) | 13.71±0.2 | 4.09±0.0 | 3.72±0.1 | 3.16±0.3 | 2.69±0.1 | - | - | |
| ANOMALOUS (2018) | 5.58±0.1 | 5.19±0.2 | 6.35±0.6 | 18.98±0.4 | 3.75±0.4 | - | - | |
| DOMINANT (2019) | 14.24±0.2 | 3.95±2.0 | 44.02±3.6 | 3.14±4.1 | 3.56±0.2 | - | - | |
| CoLA (2021) | 6.77±0.1 | 4.48±0.2 | 32.35±1.7 | 21.06±1.7 | 4.49±0.2 | 20.12±0.4 | 8.48 ± 0.7 | |
| AUPRC | SL-GAD (2021) | 6.34±0.5 | 3.50±0.0 | 37.84±1.1 | 13.16±2.0 | 4.06±0.4 | - | - |
| HCM-A (2022) | 5.27±1.5 | 2.87±1.2 | 34.13±0.4 | 7.13±0.4 | 2.87±0.5 | - | - | |
| ComGA (2022) | 11.53±0.5 | 4.23±0.0 | 28.73±1.2 | 3.54±0.1 | 3.74±0.1 | - | - | |
| TAM (2023) | 26.34±0.8 | 7.78±0.9 | 51.24±1.8 | 22.33±1.6 | 4.46±0.1 | 43.46±0.9 | 18.86±0.6 | |
| GGAD (2024)* | 19.10±0.8 | 12.40±1.5 | 3.00±0.7 | 6.47±1.1 | 4.05±0.7 | 42.19±0.8 | 17.79±1.5 | |
| GCTAM(ours) | 50.69±8.1 | 16.04±1.0 | 52.10±0.7 | 22.81±0.6 | 4.17±0.1 | 67.18±4.8 | 20.13±0.7 | |
| ∆ | ↑24.35 | ↑3.64 | ↑0.86 | ↑0.48 | ↓ 0.32 | ↑23.72 | ↑1.27 |
Table 2: AUROC and AUPRC results on seven real-world GAD datasets with injected/real anomalies. The best performance per row is boldfaced, with the second-best underlined. - indicates that the result is not available in the TAM. ∆ represents the improvement (↑) or degradation (↓) compared to the current best baseline method.
and +23.72 in AUPRC. This result indicates the superior capabilities of integrating global and contextual information of graphs, particularly on challenging and large-scale datasets, underscoring its potential as a robust solution for Affinitybased anomaly detection tasks.
| Datasets | w/o G⊛&G∗ | w/G⊛ | w/G∗ | GCTAM |
|---|---|---|---|---|
| Amazon | 83.86 | 83.90 | 84.07 | 84.38 |
| YelpChi | 69.73 | 73.07 | 77.43 | 79.00 |
| ACM | 84.30 | 89.06 | 88.70 | 90.77 |
| 89.03 | 91.55 | 89.67 | 92.38 | |
| 57.09 | 58.95 | 57.21 | 59.21 | |
| Amazon-all | 87.32 | 88.14 | 88.41 | 88.89 |
| YelpChi-all | 58.10 | 58.42 | 59.02 | 59.57 |
Table 3: The evaluation of CAT G⊛ and GAT G∗ module over the metric AUROC.
4.3 Ablation Study
In ablation experiments, we evaluate the effectiveness of GCTAM with metric AUROC by excluding the CAT and GAT modules, respectively. For clarity, the GCTAMwith or without two modules, which is represented by G⊛ and G∗ , is denoted as w and w/o. As shown in Table 3, GCTAM with two modules achieves the best performance across all datasets. It is worth mentioning that removing either the CAT or GAT
module reduces the performance of the model to varying degrees. Specifically, on the ACM, Facebook, and Reddit datasets, the use of the contextual truncation graph results in a significant improvement in AUROC. This demonstrates that the proposed contextual affinity truncation effectively reduces anomaly affinity by successfully truncating anomalous edges. Meanwhile, on the Amazon and YelpChi datasets, a significant improvement in AUROC is observed after applying the global affinity truncation. The main reason is that our global affinity truncation enhances the connections between normal nodes, thereby increasing their affinity scores. In summary, these findings demonstrate that the combination of CAT and GAT modules significantly enhances the performance of affinity-based anomaly detection, further boosting the overall performance of the GCTAM.
4.4 Parameter Analysis
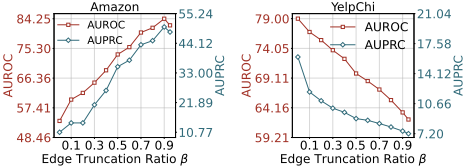
In this subsection, we explore the sensitivity of two important hyper-parameters in GCTAM: edge truncation ratio β and the number of global affinity truncation graph neighbors k. The parameter β determines the max number of truncated edges ratio from the original graph, and the parameter k determines the number of neighbor nodes to be used in global affinity adjacent matrix A∗ based on k-nearest-neighbor topk(·) (kNN).
Edge truncation ratio β analysis. As shown in the Fig 3, all datasets were searched for the edge truncation ratio β, in the range of 0-0.95. From the figure, we can find that different datasets have different sensitivities to the edge truncation ratio β. Specifically, for the Amazon dataset, the number of anomalous edges is high, and a larger truncation ratio β is needed to ensure that the characterization obtained by the model from the truncated graph G⊛ is more conducive to distinguishing anomalous nodes. For the YelpChi dataset, the number of anomalous edges is small, and a better characterization to distinguish anomalous nodes can be obtained based on a smaller edge truncation ratio β. Therefore, choosing the appropriate edge truncation ratio β for different datasets is crucial for affinity-based anomaly node detection.
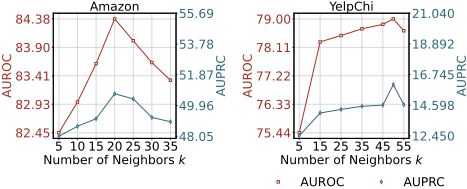
The number of neighbors k analysis. As shown in Fig.4, we explore the sensitivity of the hyper-parameter number of neighbors k in GCTAM. The results indicate that selecting an appropriate k value can significantly enhance the AUROC and AUPRC of GCTAM across various datasets. As is demonstrated in Fig.4, the best selection for each dataset is different, i.e., k = 20 for Amazon and k = 50 for YelpChi. It is commonly observed that selecting a value of k that is either too large or too small can lead to suboptimal performance. We hypothesize that an excessively small k may restrict the inclusion of beneficial neighbors, while an overly large k might introduce redundant connections, thereby degrading the overall performance.
4.5 Affinity Truncation Score Analysis
To quantitatively assess the quality of node affinity distributions generated by TAM and GCTAM methods, we introduce a novel evaluation metric termed affinity truncation score (Struncation). This metric quantifies the discriminative capability of the model by measuring the percentage of normal nodes that maintain higher affinity values compared to anomalous nodes in the learned affinity space. The affinity truncation score is formally defined as follows:
where AS(·) represent the affinity score as defined in Eq. (12), |Vn| and |Va| denote the total number of normal and anomalous nodes.
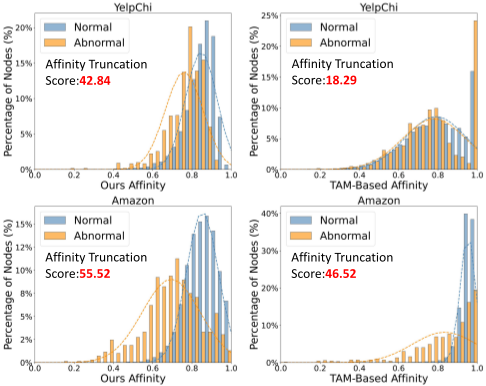
As illustrated in Fig. 5, we conduct a comprehensive comparison of node affinity distributions between normal and anomalous nodes in both TAM and GCTAM representation spaces. The experimental results demonstrate that GCTAM significantly outperforms TAM in achieving separable node affinity distributions between normal and abnormal nodes. Specifically, on the YelpChi dataset, GCTAM achieves a high-affinity truncation score of 42.84, which is much higher than that of TAM of 18.29. Furthermore, on the Amazon dataset, GCTAM attains an affinity truncation score of 55.52, outperforming TAM's score of 46.52 by a margin of 9 points. These findings highlight the effectiveness of GCTAM in constructing a more discriminative affinity space, particularly in scenarios with challenging anomaly detection tasks. This further demonstrates the superiority of the proposed global and contextual truncated affinity combined maximization model.
5 Conclusion
In this paper, we propose a novel framework, Global and Contextual Truncated Affinity Maximization (GCTAM), for unsupervised graph anomaly detection, leveraging the homogeneity assumption to optimize node affinity. GCTAM jointly optimizes the proposed affinity score in an end-toend manner on both the contextual affinity truncation and the global affinity truncation modules. This approach effectively eliminates anomalous edges to reduce anomaly affinity while simultaneously enhancing normal edges to increase the affinity of normal nodes. Extensive experimental evaluations on seven real-world GAD datasets demonstrate that GCTAM outperforms eight competing models. Notably, on challenging datasets Amazon and YelpChi, GCTAM achieves AUROC and AUPRC improvements of +15% ∼ +20% compared with the previous state-of-the-art methods. The code can be found at https://github.com/kgccc/GCTAM.
In the future, we will study some adaptations that will work well in some strong heterophily datasets.
Acknowledgments
This paper is the result of the research project funded by the National Natural Foundation of China (Grant No. 62106216 and 62162064) and the Open Foundation of Yunnan Key Laboratory of Software Engineering under Grant No.2023SE104.
Contribution Statement
Xiong Zhang† and Hong Peng† contributed equally to this work. They were responsible for the conceptualization, methodology, and original draft writing of this study. Cheng Xie∗ contributed to the conceptualization, review, and editing of the manuscript and project supervision. The remaining authors provided writing guidance throughout the research.
@inproceedings{ijcai2025p405,
  title     = {GCTAM: Global and Contextual Truncated Affinity Combined Maximization Model For Unsupervised Graph Anomaly Detection},
  author    = {Zhang, Xiong and Peng, Hong and He, Zhenli and Xie, Cheng and Jin, Xin and Jiang, Hua},
  booktitle = {Proceedings of the Thirty-Fourth International Joint Conference on
               Artificial Intelligence, {IJCAI-25}},
  publisher = {International Joint Conferences on Artificial Intelligence Organization},
  editor    = {James Kwok},
  pages     = {3642--3650},
  year      = {2025},
  month     = {8},
  note      = {Main Track},
  doi       = {10.24963/ijcai.2025/405},
  url       = {https://doi.org/10.24963/ijcai.2025/405},
}
TY - CPAPER TI - GCTAM: Global and Contextual Truncated Affinity Combined Maximization Model For Unsupervised Graph Anomaly Detection AU - Zhang, Xiong AU - Peng, Hong AU - He, Zhenli AU - Xie, Cheng AU - Jin, Xin AU - Jiang, Hua T2 - Proceedings of the Thirty-Fourth International Joint Conference on Artificial Intelligence, IJCAI-25 PB - International Joint Conferences on Artificial Intelligence Organization PY - 2025 SP - 3642 EP - 3650 DO - 10.24963/ijcai.2025/405 UR - https://doi.org/10.24963/ijcai.2025/405 ER -Copied
Machine-readable versions of this paper, for tools and AI agents:





