
Generate or Re-Weight? A Mutual-Guidance Method for Class-Imbalanced Graphs
Proceedings of the Thirty-Fourth International Joint Conference on Artificial Intelligence. Main Track. Pages 3680-3688.
https://doi.org/10.24963/ijcai.2025/409
Keywords
- Data Mining: DM: Mining graphs
- Data Mining: DM: Class imbalance and unequal cost
Abstract
Class imbalance is a widespread problem in graph-structured data. The existing studies tailored for class-imbalanced graphs are typically categorized into generative and re-weighting methods. However, the former merely focuses on quantity balance rather than learning balance. The latter performs the fine-tuning in a majority-minority paradigm, overlooking the authentic-generative one. In fact, the collaboration of them is capable of relieving their respective limitations. To this end, we propose a Mutual-Guidance method for class-imbalanced graphs, namely GraphMuGu. Specifically, we first design an uncertainty-aware method to quantify the number of synthesized samples for each category. Furthermore, we devise a similarity-aware method to re-weight the importance of the authentic and generative samples. To the best our knowledge, the proposed GraphMuGu is the first try to incorporate the generative and re-weighting methods into a unified framework. The experimental results on five class-imbalanced datasets demonstrate the superiority of the proposed method. The source codes are available at https://github.com/ZZY-GraphMiningLab/GraphMuGu.
- [Bruna et al., 2014] Joan Bruna, Wojciech Zaremba, Arthur Szlam, and Yann LeCun. Spectral Networks and Deep Locally Connected Networks on Graphs. In Interna- tional Conference on Learning Representations, pages 1- 14, 2014.
- [Chen et al., 2021] Deli Chen, Yankai Lin, Guangxiang Zhao, Xuancheng Ren, Peng Li, Jie Zhou, and Xu Sun. Topology-Imbalance Learning for Semi-Supervised Node Classification. Advances in Neural Information Process- ing Systems, 34:29885-29897, 2021.
- [Cui et al., 2019] Yin Cui, Menglin Jia, Tsung-Yi Lin, Yang Song, and Serge Belongie. Class-Balanced Loss Based on Effective Number of Samples. In Proceedings of the IEEE/CVF Conference on Computer Vision and Pattern Recognition, pages 9268-9277, 2019.
- [Defferrard et al., 2016] Michaël Defferrard, Xavier Bres- son, and Pierre Vandergheynst. Convolutional Neural Networks on Graphs with Fast Localized Spectral Filter- ing. Advances in Neural Information Processing Systems, 29:1-9, 2016.
- [Dou et al., 2020] Yingtong Dou, Zhiwei Liu, Li Sun, Yu- tong Deng, Hao Peng, and Philip S Yu. Enhancing Graph Neural Network-Based Fraud Detectors against Camou- flaged fraudsters. In Proceedings of the 29th ACM Inter- national Conference on Information and Knowledge Man- agement, pages 315-324, 2020.
- [Gilmer et al., 2017] Justin Gilmer, Samuel S Schoenholz, Patrick F Riley, Oriol Vinyals, and George E Dahl. Neu- ral message passing for quantum chemistry. In Inter- national Conference on Machine Learning, pages 1263- 1272, 2017.
- [Hamilton et al., 2017] Will Hamilton, Zhitao Ying, and Jure Leskovec. Inductive Representation Learning on Large Graphs. Advances in Neural Information Processing Sys- tems, 30:1-11, 2017.
- [Hong et al., 2021] Youngkyu Hong, Seungju Han, Kwanghee Choi, Seokjun Seo, Beomsu Kim, and Buru Chang. Disentangling Label Distribution for Long-Tailed Visual Recognition. In Proceedings of The IEEE/CVF Conference on Computer Vision and Pattern Recognition, pages 6626-6636, 2021.
- [Japkowicz and Stephen, 2002] Nathalie Japkowicz and Shaju Stephen. The Class Imbalance Problem: A Sys- tematic Study. Intelligent Data Analysis, 6(5):429-449, 2002.
- [Ju et al., 2024] Wei Ju, Siyu Yi, Yifan Wang, Zhiping Xiao, Zhengyang Mao, Hourun Li, Yiyang Gu, Yifang Qin, Nan Yin, Senzhang Wang, et al. A Survey of Graph Neural Networks in Real World: Imbalance, Noise, Privacy and OOD Challenges. CoRR, pages 1-20, 2024.
- [Kipf and Welling, 2017] Thomas N Kipf and Max Welling. Semi-Supervised Classification with Graph Convolutional Networks. In International Conference on Learning Rep- resentations, pages 1-14, 2017.
- [Li et al., 2023] Wenzhi Li, Changdong Wang, Hui Xiong, and Jianhuang Lai. GraphSHA: Synthesizing Harder Sam- ples for Class-Imbalanced Node Classification. In Pro- ceedings of the 29th ACM SIGKDD Conference on Knowl- edge Discovery and Data Mining, pages 1328-1340, 2023.
- [Li et al., 2024] Yibo Li, Xiao Wang, Hongrui Liu, and Chuan Shi. A Generalized Neural Diffusion Framework on Graphs. In Proceedings of the AAAI Conference on Ar- tificial Intelligence, volume 38, pages 8707-8715, 2024.
- [Lin et al., 2017] Tsung-Yi Lin, Priya Goyal, Ross Girshick, Kaiming He, and Piotr Dollár. Focal Loss for Dense Ob- ject Detection. In Proceedings of The IEEE/CVF Confer- ence on Computer Vision and Pattern Recognition, pages 2980-2988, 2017.
- [Liu et al., 2021] Yang Liu, Xiang Ao, Zidi Qin, Jianfeng Chi, Jinghua Feng, Hao Yang, and Qing He. Pick and Choose: A GNN-Based Imbalanced Learning Approach for Fraud Detection. In Proceedings of the Web Confer- ence, pages 3168-3177, 2021.
- [Liu et al., 2023] Zemin Liu, Yuan Li, Nan Chen, Qian Wang, Bryan Hooi, and Bingsheng He. A Survey of Im- balanced Learning on Graphs: Problems, Techniques, and Future Directions. CoRR, pages 1-27, 2023.
- [Mao et al., 2024] Haitao Mao, Zhikai Chen, Wenzhuo Tang, Jianan Zhao, Yao Ma, Tong Zhao, Neil Shah, Mikhail Galkin, and Jiliang Tang. Position: Graph Foun- dation Models Are Already Here. In International Confer- ence on Machine Learning, pages 1-23, 2024.
- [Park et al., 2021] Joonhyung Park, Jaeyun Song, and Eunho Yang. GraphENS: Neighbor-Aware Ego Network Synthe- sis for Class-Imbalanced Node Classification. In Interna- tional Conference on Learning Representations, 2021.
- [Rahmani et al., 2023] Saeed Rahmani, Asiye Baghbani, Nizar Bouguila, and Zachary Patterson. Graph Neural Net- works for Intelligent Transportation Systems: A Survey. IEEE Transactions on Intelligent Transportation Systems, 24(8):8846-8885, 2023.
- [Song et al., 2022] Jaeyun Song, Joonhyung Park, and Eunho Yang. TAM: Topology-Aware Margin Loss for Class-Imbalanced Node Classification. In International Conference on Machine Learning, pages 20369-20383, 2022.
- [Sun et al., 2020] Zhenchao Sun, Hongzhi Yin, Hongxu Chen, Tong Chen, Lizhen Cui, and Fan Yang. Disease Prediction via Graph Neural Networks. IEEE Journal of Biomedical and Health Informatics, 25(3):818-826, 2020.
- [Veličković et al., 2018] Petar Veličković, Guillem Cucurull, Arantxa Casanova, Adriana Romero, Pietro Liò, and Yoshua Bengio. Graph Attention Networks. In Interna- tional Conference on Learning Representations, pages 1- 12, 2018.
- [Wang et al., 2022] Yu Wang, Charu Aggarwal, and Tyler Derr. Distance-Wise Prototypical Graph Neural Network for Imbalanced Node Classification. In Proceedings of the International Workshop on Mining and Learning with Graphs, pages 1-10, 2022.
- [Wu et al., 2020] Zonghan Wu, Shirui Pan, Fengwen Chen, Guodong Long, Chengqi Zhang, and S Yu Philip. A Comprehensive Survey on Graph Neural Networks. IEEE Transactions on Neural Networks and Learning Systems, 32(1):4-24, 2020.
- [Yun et al., 2019] Seongjun Yun, Minbyul Jeong, Raehyun Kim, Jaewoo Kang, and Hyunwoo J Kim. Graph Trans- former Networks. Advances in Neural Information Pro- cessing Systems, 32:1-11, 2019.
- [Zeng et al., 2023] Liang Zeng, Lanqing Li, Ziqi Gao, Peilin Zhao, and Jian Li. ImGCL: Revisiting Graph Contrastive Learning on Imbalanced Node Classification. In Proceed- ings of the AAAI Conference on Artificial Intelligence, vol- ume 37, pages 11138-11146, 2023.
- [Zhang et al., 2024] Jinghui Zhang, Zhengjia Xu, Dingyang Lv, Zhan Shi, Dian Shen, Jiahui Jin, and Fang Dong. DiG-In-GNN: Discriminative Feature Guided GNN-Based Fraud Detector against Inconsistencies in Multi-Relation Fraud Graph. In Proceedings of the AAAI Conference on Artificial Intelligence, volume 38, pages 9323-9331, 2024.
- [Zhao et al., 2021] Tianxiang Zhao, Xiang Zhang, and Suhang Wang. GraphSMOTE: Imbalanced Node Classi- fication on Graphs with Graph Neural Networks. In Pro- ceedings of the 14th ACM International Conference on Web Search and Data Mining, pages 833-841, 2021.
References were extracted automatically from the PDF and may contain errors.
Full text extracted automatically from the PDF; figures, tables and equations may differ. The PDF is the version of record.
1 Introduction
Graph Neural Networks (GNNs) have demonstrated impressive success across a range of graph analyzing tasks, including fraud detection, transportation analysis, disease diagnosis, and so on [Zhang et al., 2024; Rahmani et al., 2023; Sun et al., 2020]. Their remarkable performance is typically under the assumption of class balance, i.e., samples across various categories are unbiased in quantity [Ju et al., 2024]. However, the above assumption barely holds, as the class imbalance exists inherently in real-world scenarios [Dou et al., 2020; Liu et al., 2021]. It refers to a few classes holding enormous labeled nodes (i.e., majority class), while most classes contain limited labeled nodes (i.e., minority class). For instance, in fake account detection, the majority of users are benign, while only a few of them are bots. Analogously, in financial fraud detection, the quantity of compliant users far exceeds that of fraudsters. Once trapped in the problem of class imbalance, the GNN-based models over-fit the majority classes and under-represent the minority ones.
∗Corresponding Authors.
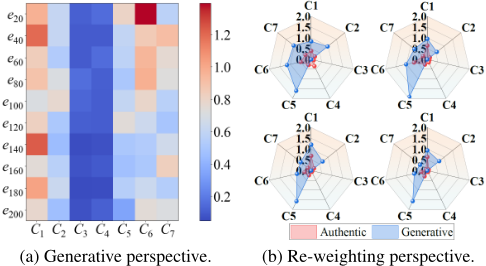
The studies tailored for the class-imbalanced graphs are categorized into generative and re-weighting methods. The former intends to synthesize new samples for minority classes, thereby balancing the distribution of samples across various categories. For example, GraphSMOTE first extends the existing over-sampling methods to graph-structured data [Zhao et al., 2021]. GraphSHA explores the subspace squeeze issue of minority classes and enlarges the decision boundaries of minority classes by synthesizing harder minority samples [Li et al., 2023]. The latter aims to fine-tune the weight of each sample, thus compelling the model to focus on minority ones. For instance, ReNode provides a unified perspective on analyzing the quantity and topology imbalance jointly by taking into account the node influence shift [Chen et al., 2021]. TAM adjusts margins node-wisely according to the extent of deviation from connectivity patterns [Song et al., 2022]. However, both generative and re-weighting methods only adhere to their standpoints and ignore potential collaboration. To this end, we revisit the generative and re-weighting methods to explore the underlying problems with an empirical study in Figure 1. It tells us two inspiring observations.
(1) Generative Perspective. The generative methods focus on synthesizing samples for each category until matching the majority. Thus, a question arises: Does the generated equal quantity balance the learning ability of the model for each category? To answer this question, we plot the mean loss of each category in Figure 1 (a). It can be observed that even if the number of samples in each category is balanced, the model still exhibits differences in its learning ability. This observation demonstrates that generative methods still lack the supervision to quantify the number of synthesized samples for each category.
(2) Re-weighting Perspective. The re-weighting methods are designed to increase the significance of minority samples, thereby compelling the model to allocate greater attention to these instances. In general, the authentic and generative samples are treated equally. Nevertheless, can the model learn them impartially? Analogously, we visualize the mean loss of authentic and generative samples for each category, respectively. The results are shown in Figure 1 (b). It can be seen that the model generalizes well on the authentic samples but struggles with the generative ones. This phenomenon indicates that it is essential to re-weight the authentic and generative samples to balance the concern of the model.
To this end, we propose a Mutual-Guidance method for the class-imbalanced graphs. To the best of our knowledge, it is the first try to incorporate the generative and re-weighting method into a unified framework. Specifically, we present an uncertainty-aware method to quantify the number of synthesized samples for each category. It first measures the mean loss of samples for each category to identify the uncertainty of the model. Then, it leverages the uncertainty to quantify the number of synthesized samples for each category adaptively. Furthermore, we devise a similarity-aware method to re-weight the importance of the authentic and generative samples. It summarizes the pacesetter feature by averaging the features of labeled samples belonging to the same category. Subsequently, it re-weights the generative samples by evaluating the similarity of their features and the corresponding pacesetter features. We conduct experiments under two imbalanced settings on five datasets. The experimental results demonstrate that our method outperforms ten competitive methods.
The main contributions of this work are as follows.
- We propose a mutual-guidance method for classimbalanced graphs. It is the first try to incorporate the generative and re-weighting method into a unified framework.
- We design an uncertainty-aware method to quantify the number of synthesized samples for each category.
- We devise a similarity-aware method to re-weight the importance of the authentic and generative samples.
- We conduct extensive experiments on five classimbalance datasets to verify the effectiveness of the proposed method.
2 RelatedWork
2.1 Graph Neural Networks
Graph Neural Networks are deep learning models designed to learn and reason directly on graph-structured data [Wu et al., 2020]. They can be categorized into Spectral Graph Neural Networks and Spatial Graph Neural Networks based on their implementation manners. Spectral Graph Neural Networks aim to define the graph convolution through spectral graph theory and the convolution operation. Bruna et al. first formalized the definition of spectral graph convolution and emphasized its high computational complexity [Bruna et al., 2014]. To this end, Defferard et al. introduced the k-order Chebyshev polynomial to approximate the graph convolution kernel [Defferrard et al., 2016]. Kipf et al. advanced it by leveraging the limited 1-order Chebyshev polynomial and renormalization technique, giving rise to Graph Convolutional Networks (GCN) [Kipf and Welling, 2017]. Spatial Graph Neural Networks incorporate structural and node feature information by defining neighborhood aggregation functions. Gilmer et al. proposed the Message Passing Neural Network (MPNN), a general framework for spatial graph convolution [Gilmer et al., 2017]. Veliˇckovi´c et al. presented the Graph Attention Network (GAT), which defines the aggregation function using a learnable attention mechanism [Veliˇckovi´c et al., 2018]. Hamilton et al. introduced GraphSAGE, a model that leverages neighbor sampling and a variety of aggregation functions to explore the fusion of neighboring information [Hamilton et al., 2017]. Furthermore, researchers also investigated some interesting techniques for GNNs, such as graph transformer [Yun et al., 2019], graph diffusion [Li et al., 2024], graph foundation model [Mao et al., 2024], etc.
2.2 Class-Imbalance Problem
Class imbalance is a ubiquitous challenge in graph representation learning [Liu et al., 2023]. The existing countermeasures can be classified into generative and re-weighting methods. The former is devoted to synthesizing minority samples to balance the training set. For example, Zhao et al. extended the over-sampling methods for i.i.d data to the graph [Zhao et al., 2021]. They utilized the feature extractor to construct an intermediate embedding space, then proceeded to train an edge estimator and the GNN-based classifier on top of that. Park et al. proposed GraphENS to relieve the neighbor memorization problem encountered by existing generative methods [Park et al., 2021]. It synthesizes an ego network for minor classes with neighbor sampling and saliency-based node mixing. Li et al. explored the problem of squeezed minority [Li et al., 2023]. Hence, they presented GraphSHA, which synthesizes harder samples to avoid invading the spaces of neighbor classes. The re-weighting methods intend to tilt the training focus towards minority samples. For instance, Cui et al. leveraged the number of effective samples among each class to re-weight the classes[Cui et al., 2019]. Wang et al. introduced a class prototype-driven training paradigm to balance the loss between majority and minority classes [Wang et al., 2022]. Park et al. explored the decision boundary in classimbalance scenarios and presented a novel influence-balance loss to solve the overfitting problem of majority classes. Song et al. proposed a topology-aware loss to re-weight margins node-wisely according to the extent of deviation from connectivity patterns [Song et al., 2022]. In addition, researchers also explored contrastive-based methods to mitigate the class imbalance on graphs [Zeng et al., 2023].
3.2 Framework
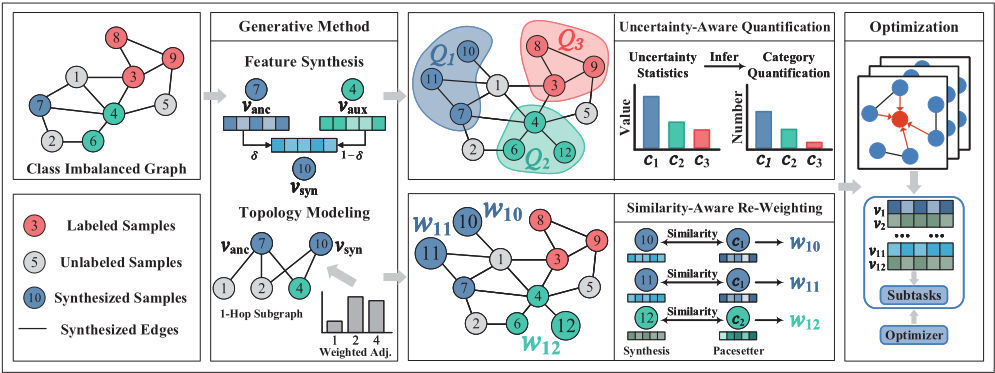
In this section, we propose a mutual-guidance method for class-imbalanced graphs, as illustrated in Figure 2. It mainly consists of two modules: (i) Uncertainty-Aware Quantification and (ii) Similarity-Aware Re-Weighting. In particular, it first schemes the synthetic paradigm of generated samples. Then, it focuses on their quantitative and weighting problems. Specifically, it evaluates the loss distribution to assess the uncertainty of the model across various classes and adjusts the number of samples generated for each class accordingly. Furthermore, it summarizes the pacesetter features by averaging the features of labeled samples in the same category. Subsequently, it measures the similarity of synthesized sample features and their corresponding class-wise pacesetter features. Afterward, it fine-tunes the weights of each synthesized sample. Finally, the GNN-based models are trained on the graph balanced from the perspectives of generative and re-weighting. The implementation details are elaborated in the subsequent sections.
3.3 Synthetic Paradigm of Generative Sample
To synthesize a minority node, it first identifies an anchor node (i.e., vanc) and an auxiliary node (i.e., vaux). The anchor node is sampled from the minority class. Note that, to enlarge the decision boundary of the minority, it refers to the hardness-aware sampling strategy [Li et al., 2023]. Specifically, the hardness is measured in Eqn. (4).
where Hi is the hardness of node vi, Zi is the logits of vi, and τ is the temperature.
Then, it samples the minority anchor node vanc from the hardness-based multinomial distribution. In identifying the auxiliary node vaux, the category of vaux is sampled from the classification probability of the anchor node. Afterward,
3 ProposedMethod
3.1 Preliminaries
In this section, we first define the attributed graph and imbalance ratio. Then, we formulate the Graph Neural Networks. Finally, we clarify the task of node classification.
Definition 1. Attributed Graph. Suppose G = (V, E, X) is an attributed graph, where V = {v1, v2, ..., vn} is the set of nodes and E = {e1, e2, ..., em} is the set of edges. X ∈ R|V|×d is the feature matrix, where d represents the dimension of node features. A ∈ R|V|×|V| is the adjacency matrix, where Aij = 1 indicates that there is an edge between vi and vj , otherwise, Aij = 0.
Definition 2. Imbalance Ratio. Suppose the potential categories are in C = {c1, c2, ..., cl}, where the class with the most samples is denoted as cmax and the class with the least samples is abbreviated as cmin. Then, the imbalance ratio ρ is defined in Eqn. (1).
Definition 3. Graph Neural Networks. The messagepassing paradigm of GNNs can be summarized as aggregateupdate, which are specified in Eqn. (2) and Eqn. (3).
where ali is the aggregation of neighboring features at the l-th layer, Ni is the set of neighbors of vi, and hli is the embedding of vi at the l-th layer which is updated on hl-1 i and ali .
Problem. Node Classification. An attributed graph is denoted as G = (V, E,X). V L is the set of labeled nodes and V U is the set of unlabeled nodes, where |V L|<<|V U |. The goal of node classification is to train a model that takes feature matrix X and adjacency matrix A as input and predicts the labels of unlabeled nodes by learning and optimizing the function f (X, A) → ˆY.
within the nodes belonging to caux, the auxiliary node is sampled from the multinomial with their confidence in canc as the probability.
Let the feature of vanc and vaux be abbreviated as Xanc and Xaux, respectively. The feature of the synthesized node is mixed up according to Eqn (5).
where Xsyn is the feature of synthesized node and δ ∈ [0, 1] is the hyper-parameter that controls the relative importance of Xanc andXaux.
In modeling the topology of the synthesized node, it first identifies the degree of the synthesized node by sampling from the degree distribution of the entire graph as formulated in Eqn. (6) and Eqn. (7).
where PDg(k) is the probability of a node occupying degree k, I{·} is an indicator function, and ksyn is the degree of vsyn.
Then, it connects vsyn to the nodes within the 1-hop subgraph of vanc, as they tend to share the same label with vanc according to graph homophily. However, the 1-hop subgraph of vanc may contain fewer nodes than the sampled degree of vsyn. Furthermore, neighbor sampling from the unweighted graph ignores the topological information. Thus, it leverages graph diffusion to construct a normalized weighted graph as specified in Eqn. (8).
where ¯S ∈ R|V|×|V| is the normalized diffusion matrix, θr = α(1 - α)r , α is a hyper-parameter, T = AD-1 , and D is the diagonal matrix.
To reduce the computational cost, it only retains the top-K elements in each column of ¯S and sets the remaining elements to 0, sparsifying the normalized diffusion matrix. The sparsified diffusion matrix is denoted as ˜S. Finally, it leverages ˜Sanc to sample the neighbors of vsyn.
In summary, the synthesized node is defined in Eqn. (9).
where Xsyn, Nsyn, and Ysyn represent the feature, neighbor distribution, and class label of the synthesized sample, respectively.
3.4 Uncertainty-Aware Sample Quantification
The existing generative methods typically synthesize samples for each category until matching the majority. However, empirical studies have revealed that an equal number of training samples across various categories does not ensure balanced model learning. Hence, we propose an uncertaintyaware sample method to adaptively quantify the numbers of the synthesized samples for each category.
As we all know, the uncertainty of the model can be naturally reflected by training loss. Thus, it first measures the uncertainty for each category as specified in Eqn. (10) and Eqn. (11).
where V L is the set of labeled nodes, V S indicates the set of synthesized nodes, y is the ground truth label, ˆ y is the prediction, Lci represents the total loss of category ci, and Uci indicates the uncertainty of model for category ci.
Then, it schemes a flexible sample generation strategy. In contrast to existing methods that synthesize samples for each category until matching the majority, it exclusively focuses on synthesizing samples for categories whose sample count is less than the average one across all categories.
Specifically, it evaluates the class-wise average sample quantity by Eqn. (12).
where ¯Q is the class-wise average sample quantity and |C| indicates the number of categories.
Afterward, it quantifies the numbers of synthesized samples for each category by Eqn. (13) and Eqn. (14).
where U ′ci is the normalized uncertainty, Qci is the number of synthesized samples for category ci, β is the scale factor.
In summary, the uncertainty-aware quantification method adaptively identifies the numbers of the synthesized samples for each category from the perspective of the model, realizing the transition from "quantity balance" to "learning balance". Furthermore, it reduces the computational cost and avoids the noise introduced by excessive synthesized samples.
3.5 Similarity-Aware Sample Re-Weighting
The existing re-weighting methods aim to fine-tune the focus of the model on majority and minority. Nevertheless, the difference in learning difficulty between authentic and synthesized samples still troubles the model. Thus, we devise a similarity-aware method to re-weight the importance of synthesized samples.
As empirical studies have proven, the model generalizes well on the authentic samples but struggles with the synthesized ones. Therefore, it measures the difference between authentic and synthesized samples by similarity and emphasizes the focus of the model on the latter accordingly.
Specifically, it first evaluates the average feature of the labeled samples within the same class and denotes it as "pacesetter" in Eqn. (15).
where Xci pac is the pacesetter of class ci.
Subsequently, it identifies the weights by calculating the cosine similarity of the synthesized sample and its corresponding pacesetter as formulated in Eqn. (16).
where V S is the set of synthesized samples, Xci pac is the pacesetter for category ci, || · || is the Euclidean norm, γ is the gain factor, σ(·) is the sigmod function, and R(·) is the reciprocal operation.
To sum up, the similarity-aware re-weighting method finetunes the importance of each synthesized sample, achieving the switch of the re-weighting paradigm from "majorityminority" to "authentic-generative". Moreover, it improves the generalization ability of the model and relieves the risk of overfitting.
3.6 Optimization
The synthesized samples are inserted into the classimbalanced graph, steering the graph towards class balance. Finally, the GNNs are trained on the class-balance graph by optimizing the objective as formulated in Eqn. (17).
where L is the final optimization objective.
3.7 Algorithm and Complexity Analysis
The main procedures of our proposed GraphMuGu are summarized in Algorithm 1. The complexity of identifying the anchor and auxiliary nodes is O(|V L|2 ). For feature synthesis, the complexity is O(|V L|d). For topology modeling, the corresponding complexity is O( |V L | |V| |E|). For our proposed uncertainty-ware sample quantification, the time complexity of measuring the uncertainty is O(|V L| + |V S |). For our proposed similarity-aware sample re-weighting, the time complexity of evaluating the pacesetter is O(|V L|), and that of measuring weights is O(|V S |). In general, the additional complexity introduced by our method is O(2(|V L| + |V S |)), which enables its generalization to the large-scale graph.
4 Experiments
In this section, we conduct experiments to verify the effectiveness of our proposed method. We first introduce the datasets and baselines used in the experiments. Then, we elaborate on the implementation details. Finally, we conduct a comprehensive and in-depth analysis of the experimental results. We aim to answer the following four Research Questions.
Algorithm 1 The Proposed GraphMuGu Method
Input: Graph G = (V, E,X), adjacency matrix A, labeled node set V L with their labels Y L, unlabeled node set V U , potential categories C, GNN-based model fθ.
Output: fθ trained on the class-balance graph.
- 1: Calculate ˜S via graph diffusion and sparsification;
- 2: Calculate degree distribution PDg via Eqn. (6);
- 3: Calculate pacesetter Xpac according to Eqn. (15);
- 4: while not converge do
- 5: Calculate uncertainty Uci according to Eqn. (11);
- 6: Calculate uncertainty-aware synthesized sample quantification Qci via Eqn. (14);
- 7: Calculate node hardness according to Eqn. (4);
- 8: Sample anchor node vanc based on hardness;
- 9: Identify auxiliary node vaux based on classification probability of anchor node;
- 10: Mix feature of the synthesized node by Eqn. (5);
- 11: Model topology of synthesized node Nsyn ∼ ˜Sanc;
- 12: Calculate theweight of the synthesized node according to Eqn. (16);
- 13: Insert the synthesized nodes to G and train fθ on the class-balanced graph by optimizing Eqn. (17);
- 14: end while
- 15: return Optimized GNNmodel fθ.
- RQ1: How does the proposed method perform on longtailed and step imbalance issues?
- RQ2: How does each proposed module contribute to the performance?
- RQ3: How do the hyper-parameters take effect on the performance?
- RQ4: How does each proposed module work to benefit the model?
4.1 Datasets and Baselines
We evaluate the effectiveness of our proposed GraphMuGu on five widely-used datasets, including three citation datasets (Cora, Citeseer, and Pubmed) and two co-purchase datasets (Amazon-Photo and Amazon-Computers). The details of datasets are summarized in Table 1.
We compare the proposed GraphMuGu with ten competitive methods for class imbalance. They are classified into two categories, including loss modifying methods (Re-weight [Japkowicz and Stephen, 2002], PC Softmax [Hong et al., 2021], CB Loss [Cui et al., 2019], Focal Loss [Lin et al.,
| Datasets | Nodes | Features | Edges | Classes |
|---|---|---|---|---|
| Cora | 2,708 | 1,433 | 5,429 | 7 |
| Citeseer | 3,327 | 3,703 | 4,732 | 6 |
| Pubmed | 19,717 | 500 | 44,338 | 3 |
| Amazon-Photo | 7,650 | 745 | 238,126 | 8 |
| Amazon-Computers | 13,752 | 767 | 245,861 | 10 |
| Dataset | Cora-LT | Citeseer-LT | Pubmed-LT | ||||||
|---|---|---|---|---|---|---|---|---|---|
| ρ=100 | Acc. | bAcc. | F1 | Acc. | bAcc. | F1 | Acc. | bAcc. | F1 |
| Vanilla | 72.32±0.48 | 59.63±0.72 | 59.23±0.86 | 51.47±0.45 | 44.57±0.51 | 37.91±0.60 | 51.53±0.86 | 42.13±0.45 | 34.63±0.77 |
| Re-weight | 78.38±0.13 77.39±0.17 | 72.69±0.35 72.02±0.32 | 71.57±0.33 71.54±0.38 | 63.52±0.23 62.19±0.43 | 56.83±0.25 59.17±0.32 | 55.17±0.13 58.38±0.31 | 77.15±0.18 74.40±0.66 | 72.41±0.12 72.67±0.47 | 72.03±0.17 71.85±0.57 |
| PC Softmax | |||||||||
| CB Loss | 77.92±0.23 | 72.65±0.28 | 73.23±0.28 | 61.49±0.55 | 55.27±0.58 | 53.53±0.69 | 76.82±0.27 | 72.17±0.25 | 72.95±0.24 |
| Focal Loss | 78.47±0.21 | 73.15±0.27 | 73.42±0.20 | 59.76±0.32 | 53.45±0.39 | 51.82±0.43 | 76.32±0.21 | 71.57±0.38 | 71.87±0.39 |
| GCN ReNode | 78.72±0.19 | 72.97±0.17 | 74.03±0.18 | 62.33±0.30 | 55.53±0.29 | 53.78±0.25 | 75.97±0.11 | 70.75±0.15 | 71.44±0.19 |
| TAM | 77.33±0.25 | 72.19±0.27 | 72.37±0.29 | 63.45±0.36 | 56.82±0.31 | 55.87±0.41 | 78.02±0.18 | 72.65±0.22 | 72.81±0.33 |
| Upsample | 75.55±0.12 | 66.88±0.14 | 68.39±0.31 | 55.14±0.11 | 48.47±0.15 | 45.23±0.21 | 71.31±0.09 | 64.01±0.11 | 64.51±0.10 |
| GraphSMOTE | 75.46±0.41 | 68.93±0.52 | 70.47±0.53 | 56.34±0.25 | 50.10±0.28 | 47.86±0.33 | 74.51±0.11 | 69.51±0.13 | 71.07±0.15 |
| GraphENS | 76.12±0.27 | 71.26±0.38 | 70.87±0.48 | 63.11±0.32 | 56.75±0.32 | 55.52±0.47 | 77.27±0.15 | 71.82±0.23 | 72.77±0.18 |
| GraphSHA | 79.54±0.29 | 74.21±0.42 | 75.09±0.31 | 64.39±0.45 | 58.88±0.36 | 59.02±0.30 | 79.58±0.17 | 74.47±0.15 | 75.08±0.20 |
| GraphMuGu | 80.88±0.42 | 75.59±0.39 | 75.79±0.36 | 65.79±0.35 | 59.83±0.41 | 59.78±0.37 | 79.05±0.23 | 74.52±0.17 | 75.12±0.22 |
| Vanilla | 67.72±0.55 | 54.25±0.86 | 55.32±0.77 | 49.25±0.21 | 42.47±0.19 | 35.85±0.28 | 47.65±1.15 | 40.01±1.08 | 29.75±1.68 |
| Re-weight | 77.62±0.25 | 72.15±0.47 | 72.81±0.52 | 61.87±0.49 | 55.45±0.66 | 53.79±0.74 | 74.12±0.37 | 69.45±0.89 | 69.35±0.66 |
| PC Softmax | 68.72±0.71 | 64.25±0.76 | 64.15±0.76 | 56.74±1.45 | 56.37±1.22 | 55.38±1.52 | 76.76±0.38 | 73.29±0.17 | 73.18±0.28 |
| CB Loss | 77.32±0.30 | 72.02±0.66 | 72.89±0.45 | 61.64±0.55 | 55.19±0.57 | 53.66±0.58 | 74.64±0.30 | 69.76±0.58 | 70.57±0.53 |
| Focal Loss | 77.85±0.13 | 72.57±0.22 | 73.12±0.29 | 59.73±0.38 | 53.48±0.30 | 52.26±0.36 | 74.12±0.21 | 70.32±0.35 | 70.69±0.25 |
| GAT ReNode | 78.02±0.22 | 71.77±0.35 | 73.49±0.38 | 60.82±0.37 | 54.02±0.34 | 51.92±0.43 | 74.14±0.27 | 69.08±0.38 | 69.53±0.47 |
| TAM | 77.74±0.23 | 72.88±0.32 | 73.07±0.39 | 64.04±0.33 | 57.49±0.51 | 56.31±0.37 | 78.13±0.19 | 71.83±0.27 | 73.14±0.20 |
| Upsample | 72.66±0.31 | 62.37±0.35 | 64.99±0.29 | 53.46±0.28 | 46.98±0.21 | 43.15±0.47 | 67.69±0.87 | 57.37±0.61 | 54.87±0.92 |
| 74.61±0.27 | 67.73±0.35 | 72.15±0.43 | 57.42±0.28 | 51.35±0.33 | 49.46±0.55 | 74.08±0.31 | 69.13±0.40 | 70.53±0.45 | |
| GraphSMOTE GraphENS | 77.18±0.26 | 72.05±0.37 | 69.12±0.38 | 61.95±0.38 | 55.89±0.31 | 54.32±0.43 | 76.67±0.18 | 70.29±0.23 | 71.38±0.29 |
| GraphSHA | 78.86±0.24 | 74.18±0.28 | 75.19±0.23 | 63.87±0.46 | 58.15±0.37 | 57.52±0.40 | 78.36±0.24 | 73.75±0.25 | 74.46±0.23 |
| GraphMuGu | 80.69±0.46 | 74.85±0.38 | 75.81±0.29 | 65.17±0.36 | 60.47±0.29 | 60.08±0.36 | 78.62±0.32 | 73.49±0.26 | 73.87±0.33 |
| Vanilla | 73.33±0.12 | 61.85±0.15 | 63.29±0.14 | 47.85±0.23 | 41.88±0.29 | 36.86±0.35 | 58.76±0.11 | 47.86±0.08 | 42.56±0.15 |
| Re-weight | 76.85±0.14 | 68.65±0.38 | 70.29±0.33 | 57.32±0.56 58.37±0.24 | 50.82±0.48 56.14±0.13 | 49.23±0.52 | 65.87±0.46 | 59.64±0.86 73.85±0.20 | 58.72±0.94 70.35±0.18 |
| PC Softmax | 76.85±0.29 | 70.37±0.39 | 71.29±0.32 | 57.65±0.38 | 48.76±0.42 | 71.86±0.17 | 61.76±0.53 | ||
| CB Loss | 77.15±0.30 | 73.55±0.34 | 73.38±0.19 | 51.27±0.37 | 56.52±0.22 | 67.75±0.33 | 60.62±0.49 | ||
| Focal Loss | 77.19±0.19 | 69.82±0.25 | 70.73±0.28 | 57.09±0.65 | 50.65±0.69 | 48.48±0.73 | 70.52±0.39 | 65.56±0.37 | 66.28±0.46 |
| GraphSAGE ReNode | 77.15±0.26 | 69.28±0.27 | 71.18±0.23 | 57.75±0.54 | 51.36±0.49 | 49.08±0.45 | 67.37±0.53 | 60.54±0.76 | 60.72±0.65 |
| TAM | 77.18±0.31 | 71.22±0.36 | 71.19±0.49 | 62.88±0.23 | 56.41±0.35 | 54.57±0.25 | 78.22±0.33 | 72.81±0.73 | 73.68±0.69 |
| Upsample | 73.76±0.18 | 63.39±0.27 | 65.65±0.19 | 50.38±0.18 | 44.29±0.15 | 64.27±0.09 | 54.67±0.15 | 53.42±0.17 | |
| 66.18±0.38 | 67.82±0.45 | 41.49±0.24 | 56.88±0.59 | ||||||
| GraphSMOTE | 74.29±0.22 76.71±0.25 | 70.16±0.24 | 70.39±0.37 | 52.75±0.66 62.65±0.39 | 47.05±0.63 56.18±0.36 | 44.27±0.62 54.19±0.38 | 65.19±0.37 77.68±0.17 | 56.89±0.52 72.67±0.24 | 73.29±0.19 |
| GraphENS GraphSHA | 78.75±0.22 | 73.15±0.38 | 74.29±0.35 | 63.78±0.35 | 58.37±0.36 | 58.09±0.45 | 78.27±0.27 | 74.25±0.39 | 74.81±0.23 |
| GraphMuGu | 79.77±0.23 | 74.24±0.18 | 74.66±0.27 | 65.20±0.33 | 59.66±0.28 | 58.86±0.23 | 78.62±0.33 | 74.53±0.36 | 75.02±0.31 |
2017], ReNode [Chen et al., 2021], and TAM [Song et al., 2022]) and generative methods (Upsample, GraphSMOTE [Zhao et al., 2021], GraphENS [Park et al., 2021], and GraphSHA [Li et al., 2023]).
4.2 Experimental Setup and Configurations
We leverage various GNNs (i.e., GCN [Kipf and Welling, 2017], GAT [Veliˇckovi´c et al., 2018], and GraphSAGE [Hamilton et al., 2017]) as the backbones. All of them are set to a 2-layer pattern. The number of multi-head is set to 8 for GAT. The dimension of the hidden layer is set to 64. Specifically, for our proposed GraphMuGu, α is set to 0.05 to measure the diffusion matrix, K is set to 128 to sparsify the diffusion matrix, and δ is sampled from β(1, 100). We perform the long-tailed class-imbalance experiments on the citation datasets and set the imbalance ratio ρ = 100. The step class-imbalance experiments are implemented on the copurchase datasets with an imbalance ratio ρ = 20. We refer to the reference [Li et al., 2023] to construct the class-imbalance datasets. For evaluation, we adopt Accuracy (Acc.), balanced Accuracy (bAcc.), and macro F1 score (F1) as the metrics.
| Dataset | Amazon-Photot-ST | Amazon-Computers-ST | ||||
|---|---|---|---|---|---|---|
| ρ=20 | Acc. | bAcc. | F1 | Acc. | bAcc. | F1 |
| Vanilla | 59.26±1.38 | 59.93±1.27 | 47.12±1.95 | 63.72±0.09 | 46.98±0.08 | 30.12±0.18 |
| Re-weight PC Softmax CB Loss Focal Loss ReNode TAM | 84.82±0.25 | 87.56±0.27 86.97±0.18 | 82.86±0.18 | 83.55±0.37 81.39±0.19 | 87.96±0.29 | 77.76±0.42 |
| 86.19±0.15 | 83.52±0.11 | 80.55±0.54 | 72.35±0.51 | |||
| 83.12±0.22 | 85.65±0.27 | 80.53±0.33 | 83.76±0.21 | 87.34±0.17 | 77.18±0.20 | |
| 82.53±0.47 | 85.55±0.39 | 79.10±0.56 | 82.56±0.45 | 86.98±0.28 | 76.54±0.20 | |
| GraphSAGE | 84.76±0.17 | 86.49±0.29 | 81.96±0.23 | 81.27±0.35 | 87.49±0.27 | 76.79±0.54 |
| 87.69±0.11 | 89.24±0.18 | 85.75±0.22 | 80.37±0.53 | 86.84±0.27 | 77.09±0.43 | |
| Upsample | 82.56±0.39 | 84.57±0.17 | 79.56±0.27 | 83.16±0.35 | 87.13±0.17 | 77.23±0.38 |
| GraphSMOTE | 80.26±0.24 | 84.59±0.32 | 79.14±0.39 | 83.52±0.27 | 88.26±0.23 | 76.13±0.33 |
| GraphENS | 88.12±0.18 | 90.32±0.12 | 86.43±0.22 | 83.27±0.31 | 88.47±0.16 | 76.71±0.40 |
| GraphSHA | 88.93±0.27 | 90.22±0.21 | 87.01±0.19 | 84.03±0.35 | 89.27±0.26 | 77.55±0.66 |
| GraphMuGu | 89.77±0.23 | 90.99±0.18 | 88.72±0.15 | 85.12±0.22 | 89.96±0.20 | 78.88±0.37 |
4.3 Experimental Results and Analyses (RQ1)
The experimental results of long-tailed class-imbalance and step class-imbalance settings are shown in Table 2 and Table 3, respectively. The key observations are summarized as follows. 1) The proposed method achieves superior performance compared to the competitive methods (i.e., loss modifying methods and generative methods), demonstrating its effectiveness in addressing the class-imbalance issues among graph data. 2) The proposed GraphMuGu performs well on both the long-tailed and step class-imbalance settings, exhibiting the outstanding versatility of our method. 3) The proposed method yields a consistent improvement of performance across various datasets, proving the generalization ability of our proposed GraphMuGu.
4.4 Ablation Studies (RQ2)
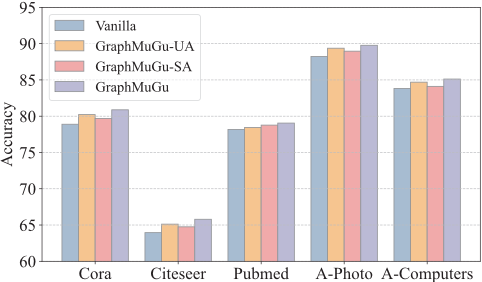
In this section, we conduct ablation studies to verify the contribution of each component in the proposed GraphMuGu. We remove similarity-aware re-weighting and abbreviate the variant as GraphMuGu-UA. Analogously, we remove uncertainty-aware quantification and denote the variant as GraphMuGu-SA. We leverage GCN as the backbone and show the results in Figure 3. It can be observed that both uncertainty-aware quantification and similarity-aware re-weighting lead to significant improvement in performance. Furthermore, uncertainty-aware quantification performs well on datasets with more categories, and similarity-aware reweighting exhibits significant performance on datasets with more samples.
4.5 Hyper-Parameter Sensitivity Analysis (RQ3)
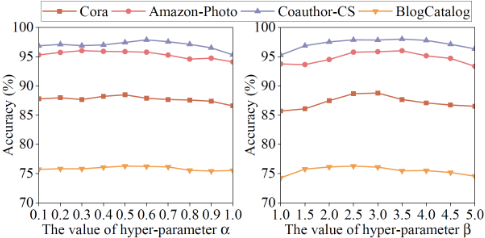
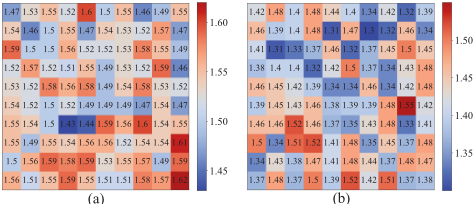
In this section, we investigate the performance of the method under various hyper-parameter settings. β controls total number of generated samples and γ controls the gain of weights. We leverage GCN as the backbone and exhibit the results in Figure 4. It can be seen that the model achieves the optimal results when β approximates the number of minority classes. The excessive value of β leads to the risk of noise, decreasing the performance of the model. In addition, the excessive value of γ results in insufficient learning of authentic samples, impairing the effectiveness of the model.
4.6 Visualization (RQ4)
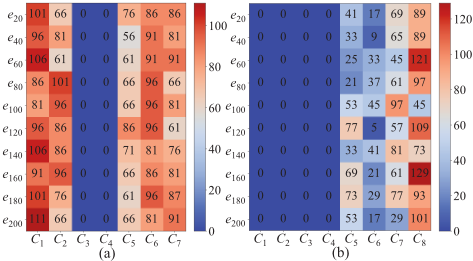
In this section, we visualize the quantity of synthesized samples for each category and the weights of synthesized samples. We leverage GCN as the backbone and perform the experiments on Cora and Amazon-Photo datasets. The results are shown in Figure 5 and Figure 6. It can be seen that uncertainty-aware quantification and similarity-aware reweighting balance the model training by adaptively finetuning the number and importance of synthesized samples.
5 Conclusion
In this paper, we incorporate the generative and re-weighting methods into a unified framework to relieve the classimbalance problem on the graphs. It quantifies the uncertainty to identify the number of synthesized samples for each category. Furthermore, it measures similarity to re-weight the importance of the generative samples. Experimental results on five datasets demonstrate the effectiveness of our proposed method.
Acknowledgments
This research is supported by the National Key R&D Program of China (Grant No. 2022ZD0119501), the National Natural Science Foundation of China (Grant No. 62472263, 62072288, 52374221), the Taishan Scholar Program of Shandong Province, Shandong Youth Innovation Team, the Natural Science Foundation of Shandong Province (Grant No. ZR2024MF034, ZR2022MF268).
@inproceedings{ijcai2025p409,
  title     = {Generate or Re-Weight? A Mutual-Guidance Method for Class-Imbalanced Graphs},
  author    = {Zhao, Zhongying and Liu, Gen and Meng, Qi and Li, Chao and Zeng, Qingtian},
  booktitle = {Proceedings of the Thirty-Fourth International Joint Conference on
               Artificial Intelligence, {IJCAI-25}},
  publisher = {International Joint Conferences on Artificial Intelligence Organization},
  editor    = {James Kwok},
  pages     = {3680--3688},
  year      = {2025},
  month     = {8},
  note      = {Main Track},
  doi       = {10.24963/ijcai.2025/409},
  url       = {https://doi.org/10.24963/ijcai.2025/409},
}
TY - CPAPER TI - Generate or Re-Weight? A Mutual-Guidance Method for Class-Imbalanced Graphs AU - Zhao, Zhongying AU - Liu, Gen AU - Meng, Qi AU - Li, Chao AU - Zeng, Qingtian T2 - Proceedings of the Thirty-Fourth International Joint Conference on Artificial Intelligence, IJCAI-25 PB - International Joint Conferences on Artificial Intelligence Organization PY - 2025 SP - 3680 EP - 3688 DO - 10.24963/ijcai.2025/409 UR - https://doi.org/10.24963/ijcai.2025/409 ER -Copied
Machine-readable versions of this paper, for tools and AI agents:





