
Priority Guided Explanation for Knowledge Tracing with Dual Ranking and Similarity Consistency
Proceedings of the Thirty-Fourth International Joint Conference on Artificial Intelligence. Main Track. Pages 430-438.
https://doi.org/10.24963/ijcai.2025/49
Keywords
- Machine Learning: ML: Explainable/Interpretable machine learning
- Multidisciplinary Topics and Applications: MTA: Education
- AI Ethics, Trust, Fairness: ETF: Explainability and interpretability
Abstract
Knowledge tracing plays a pivotal role in enabling personalized learning on online platforms. While deep learning-based approaches have achieved impressive predictive performance, their limited interpretability poses a significant barrier to practical adoption. Existing explanation methods primarily focus on specific model architectures and fall short in 1) explicitly prioritizing critical interactions to generate fine-grained explanations, and 2) maintaining similarity consistency across interaction importance. These limitations hinder actionable insights for improving student outcomes. To bridge the gap, we propose a model-agnostic approach that provides enhanced explanations applicable to diverse knowledge tracing methods. Specifically, we propose a novel ranking loss designed to explicitly optimize the importance ranking of past interactions by comparing their corresponding perturbed outputs. Furthermore, we introduce a similarity loss to capture temporal dependencies, ensuring consistency in the assigned importance scores for conceptually similar interactions. Extensive experiments conducted on various knowledge tracing models and benchmark datasets demonstrate substantial enhancements in explanation quality.
- [Abdelrahman et al., 2023] Ghodai Abdelrahman, Qing Wang, and Bernardo Pereira Nunes. Knowledge tracing: A survey. ACM Comput. Surv., 55(11):224:1-224:37, 2023.
- [Bastings and Filippova, 2020] Jasmijn Bastings and Katja Filippova. The elephant in the interpretability room: Why use attention as explanation when we have saliency meth- ods? In BlackboxNLP@EMNLP, pages 149-155. Associ- ation for Computational Linguistics, 2020.
- [Bento et al., 2021] João Bento, Pedro Saleiro, André Fer- reira Cruz, Mário A. T. Figueiredo, and Pedro Bizarro. Timeshap: Explaining recurrent models through sequence perturbations. In KDD, pages 2565-2573, 2021.
- [Bhalla et al., 2023] Usha Bhalla, Suraj Srinivas, and Himabindu Lakkaraju. Discriminative feature attribu- tions: Bridging post hoc explainability and inherent inter- pretability. In NeurIPS, 2023.
- [Chen et al., 2023] Jiahao Chen, Zitao Liu, Shuyan Huang, Qiongqiong Liu, and Weiqi Luo. Improving interpretabil- ity of deep sequential knowledge tracing models with question-centric cognitive representations. In AAAI, pages 14196-14204, 2023.
- [Crabbé and van der Schaar, 2021] Jonathan Crabbé and Mi- haela van der Schaar. Explaining time series predictions with dynamic masks. In ICML, pages 2166-2177, 2021.
- [Dabkowski and Gal, 2017] Piotr Dabkowski and Yarin Gal. Real time image saliency for black box classifiers. In NIPS, pages 6967-6976, 2017.
- [Enguehard, 2023] Joseph Enguehard. Learning perturba- tions to explain time series predictions. In ICML, pages 9329-9342, 2023.
- [Fong and Vedaldi, 2017] Ruth C. Fong and Andrea Vedaldi. Interpretable explanations of black boxes by meaningful perturbation. In ICCV, pages 3449-3457, 2017.
- [Ghosh et al., 2020] Aritra Ghosh, Neil T. Heffernan, and Andrew S. Lan. Context-aware attentive knowledge trac- ing. In KDD, pages 2330-2339, 2020.
- [Graves et al., 2014] Alex Graves, Greg Wayne, and Ivo Danihelka. Neural turing machines. CoRR, abs/1410.5401, 2014.
- [Hochreiter and Schmidhuber, 1997] Sepp Hochreiter and Jürgen Schmidhuber. Long short-term memory. Neural Comput., 9(8):1735-1780, 1997.
- [Huang et al., 2024] Chang-Qin Huang, Qionghao Huang, Xiaodi Huang, Hua Wang, Ming Li, Kwei-Jay Lin, and Yi Chang. XKT: toward explainable knowledge tracing model with cognitive learning theories for questions of multiple knowledge concepts. IEEE Trans. Knowl. Data Eng., 36(11):7308-7325, 2024.
- [Ismail et al., 2020] Aya Abdelsalam Ismail, Mohamed K. Gunady, Héctor Corrada Bravo, and Soheil Feizi. Bench- marking deep learning interpretability in time series pre- dictions. In NeurIPS, 2020.
- [Jalwana et al., 2020] Mohammad A. A. K. Jalwana, Naveed Akhtar, Mohammed Bennamoun, and Ajmal Mian. At- tack to explain deep representation. In CVPR, pages 9540- 9549, 2020.
- [Jang et al., 2017] Eric Jang, Shixiang Gu, and Ben Poole. Categorical reparameterization with gumbel-softmax. In ICLR (Poster), 2017.
- [Kim et al., 2020] Siwon Kim, Jihun Yi, Eunji Kim, and Sungroh Yoon. Interpretation of NLP models through in- put marginalization. In EMNLP, pages 3154-3167, 2020.
- [Lee et al., 2022] Wonsung Lee, Jaeyoon Chun, Youngmin Lee, Kyoungsoo Park, and Sungrae Park. Contrastive learning for knowledge tracing. In WWW, pages 2330- 2338, 2022.
- [Leung et al., 2023] Kin Kwan Leung, Clayton Rooke, Jonathan Smith, Saba Zuberi, and Maksims Volkovs. Tem- poral dependencies in feature importance for time series prediction. In ICLR, 2023.
- [Li et al., 2022] Xiao-Hui Li, Caleb Chen Cao, Yuhan Shi, Wei Bai, Han Gao, Luyu Qiu, Cong Wang, Yuanyuan Gao, Shenjia Zhang, Xun Xue, and Lei Chen. A survey of data- driven and knowledge-aware explainable AI. IEEE Trans. Knowl. Data Eng., 34(1):29-49, 2022.
- [Li et al., 2024] Xueyi Li, Youheng Bai, Teng Guo, Zitao Liu, Yaying Huang, Xiangyu Zhao, Feng Xia, Weiqi Luo, and Jian Weng. Enhancing length generalization for atten- tion based knowledge tracing models with linear biases. In IJCAI, pages 5918-5926, 2024. IJCAI
- [Liu et al., 2023] Zitao Liu, Qiongqiong Liu, Jiahao Chen, Shuyan Huang, Boyu Gao, Weiqi Luo, and Jian Weng. Enhancing deep knowledge tracing with auxiliary tasks. In WWW, pages 4178-4187, 2023.
- [Long et al., 2021] Ting Long, Yunfei Liu, Jian Shen, Weinan Zhang, and Yong Yu. Tracing knowledge state with individual cognition and acquisition estimation. In SIGIR, pages 173-182, 2021.
- [Lopardo et al., 2024] Gianluigi Lopardo, Frédéric Precioso, and Damien Garreau. Attention meets post-hoc inter- pretability: A mathematical perspective. In ICML, 2024.
- [Lundberg and Lee, 2017] Scott M. Lundberg and Su-In Lee. A unified approach to interpreting model predictions. In NIPS, pages 4765-4774, 2017.
- [McDonald, 2000] Roderick P McDonald. A basis for multi- dimensional item response theory. Applied Psychological Measurement, 24(2):99-114, 2000.
- [Minn et al., 2022] Sein Minn, Jill-Jênn Vie, Koh Takeuchi, Hisashi Kashima, and Feida Zhu. Interpretable knowledge tracing: Simple and efficient student modeling with causal relations. In AAAI, pages 12810-12818, 2022.
- [Pandey and Karypis, 2019] Shalini Pandey and George Karypis. A self attentive model for knowledge tracing. In EDM, 2019.
- [Pandey and Srivastava, 2020] Shalini Pandey and Jaideep Srivastava. RKT: relation-aware self-attention for knowl- edge tracing. In CIKM, pages 1205-1214, 2020.
- [Piech et al., 2015] Chris Piech, Jonathan Bassen, Jonathan Huang, Surya Ganguli, Mehran Sahami, Leonidas J. Guibas, and Jascha Sohl-Dickstein. Deep knowledge trac- ing. In NeurIPS, pages 505-513, 2015.
- [Ren et al., 2023] Jie Ren, Zhanpeng Zhou, Qirui Chen, and Quanshi Zhang. Can we faithfully represent absence states to compute shapley values on a dnn? In ICLR, 2023.
- [Ribeiro et al., 2016] Marco Túlio Ribeiro, Sameer Singh, and Carlos Guestrin. "Why should I trust you?": Explain- ing the predictions of any classifier. In KDD, pages 1135- 1144, 2016.
- [Simon, 1978] Herbert A Simon. Information-processing theory of human problem solving. Handbook of learning and cognitive processes, 5:271-295, 1978.
- [Simonyan et al., 2014] Karen Simonyan, Andrea Vedaldi, and Andrew Zisserman. Deep inside convolutional networks: Visualising image classification models and saliency maps. In ICLR (Workshop Poster), 2014.
- [Su et al., 2021] Yu Su, Zeyu Cheng, Pengfei Luo, Jinze Wu, Lei Zhang, Qi Liu, and Shijin Wang. Time-and- concept enhanced deep multidimensional item response theory for interpretable knowledge tracing. Knowl. Based Syst., 218:106819, 2021.
- [Sundararajan et al., 2017] Mukund Sundararajan, Ankur Taly, and Qiqi Yan. Axiomatic attribution for deep net- works. In ICML, pages 3319-3328, 2017.
- [Tonekaboni et al., 2020] Sana Tonekaboni, Shalmali Joshi, Kieran Campbell, David Duvenaud, and Anna Golden- berg. What went wrong and when? instance-wise feature importance for time-series black-box models. In NeurIPS, 2020.
- [Vaswani et al., 2017] Ashish Vaswani, Noam Shazeer, Niki Parmar, Jakob Uszkoreit, Llion Jones, Aidan N. Gomez, Lukasz Kaiser, and Illia Polosukhin. Attention is all you need. In NeurIPS, pages 5998-6008, 2017.
- [Wang and Sahebi, 2023] Chunpai Wang and Shaghayegh Sahebi. Continuous personalized knowledge tracing: Modeling long-term learning in online environments. In CIKM, pages 2616-2625, 2023.
- [Wang et al., 2023] Xinping Wang, Liangyu Chen, and Min Zhang. Deep attentive model for knowledge tracing. In AAAI, pages 10192-10199, 2023.
- [Yeung, 2019] Chun-Kit Yeung. Deep-irt: Make deep learn- ing based knowledge tracing explainable using item re- sponse theory. In EDM, 2019.
- [Zeiler and Fergus, 2014] Matthew D. Zeiler and Rob Fer- gus. Visualizing and understanding convolutional net- works. In ECCV, pages 818-833, 2014.
- [Zhang et al., 2017] Jiani Zhang, Xingjian Shi, Irwin King, and Dit-Yan Yeung. Dynamic key-value memory networks for knowledge tracing. In WWW, pages 765-774, 2017.
References were extracted automatically from the PDF and may contain errors.
Full text extracted automatically from the PDF; figures, tables and equations may differ. The PDF is the version of record.
1 Introduction
Knowledge Tracing (KT) aims to predict learners' future performance based on their past learning records. Deep learningbased knowledge tracing (DLKT) has achieved remarkable performance. However, the lack of interpretability in DLKT models hinders their broader adoption in real-world online education systems. Consequently, developing effective methods to explain DLKT predictions is crucial for the practical application of knowledge tracing.
Current explanation methods for knowledge tracing can be broadly categorized into two types: intrinsic explanations and feature attribution explanations, as illustrated in Figure 1. Intrinsic explanation approaches [Yeung, 2019; Su et al., 2021;
∗ corresponding author
Minn et al., 2022; Chen et al., 2023; Huang et al., 2024] utilize interpretable prediction structures based on educational theories, such as item response theory [McDonald, 2000] or selective perception [Simon, 1978], to provide explanations through educational concepts, such as exercise difficulty. This is illustrated in Figure 1(a). Although such explanations assist researchers in verifying the reasonableness of knowledge tracing model structures, they often constrain model flexibility, leading to a trade-off with performance [Li et al., 2022]. Moreover, these methods cannot be directly utilized to improve learning plans. Instead of explaining model structures, feature attribution methods highlight significant past interactions that contribute to DLKT's prediction, as shown in Figure 1(b). Here feature refers to an interaction, representing a student's completion of an exercise along with the associated score. In knowledge tracing, attention-based methods [Pandey and Karypis, 2019; Ghosh et al., 2020] are the primary approach for assessing the impact of each past interaction. However, within the explainable artificial intelligence research community, attention-based explanations remain controversial due to their potential to generate misleading explanations for humans [Bastings and Filippova, 2020; Lopardo et al., 2024].
While only a few feature attribution methods are specifically tailored for knowledge tracing, they have been extensively developed in other research fields, such as time series prediction [Sundararajan et al., 2017; Crabb´e and van der Schaar, 2021; Bhalla et al., 2023]. A promising direction of research has focused on learning a mask to perturb the input, where the mask encodes the feature importance at each time step for prediction [Fong and Vedaldi, 2017; Crabb´e and van der Schaar, 2021; Bhalla et al., 2023]. We refer to these methods as mask optimization methods, which serve as the foundation of our proposed approach. Our empirical observations reveal that applying these methods to knowledge tracing leads to suboptimal performance, primarily due to two key challenges. Firstly, existing methods fail to account for the unique temporal dependencies in knowledge tracing compared to other domains. For example, in time series prediction, temporal dependencies are largely determined by the positional relationships within a sequence. Contrastively, knowledge tracing considers temporal dependencies influenced by both the positions within the sequence and the similarity between interactions. Secondly, these methods often reduce interactions to a binary classification of important or unimportant, failing to provide precise rankings of their importance scores. In knowledge tracing, however, finegrained explanations that identify and prioritize important interactions are preferred, as they allow students to develop personalized learning plans based on these rankings, thereby improving learning outcomes. As shown in Figure 1(c), if a student learns that xi is a more important interaction than xj for their performance on xT based on the explanation, they can devise an efficient learning plan, which first reviews xi and then xj to improve their performance on xT .
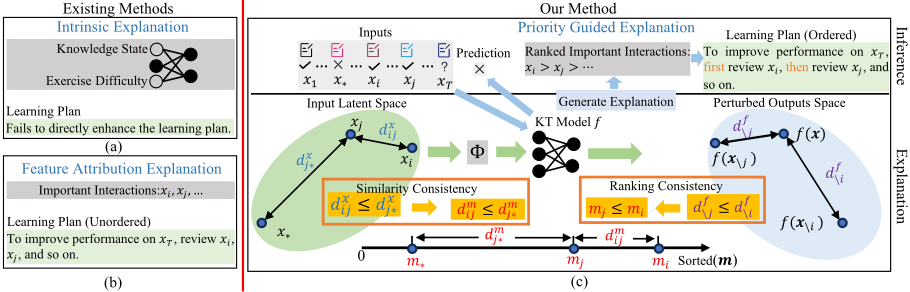
Motivated by the above observations, we propose two novel consistency assumptions, namely similarity consistency and ranking consistency, to enhance feature attribution explanation methods and address the aforementioned challenges. We formulate the problem as a mask optimization task, where the method optimizes a mask to represent the importance of each interaction in the prediction process. To capture temporal dependencies, we introduce a similarity consistency loss, ensuring that the distances between interaction importance scores align with the distances of the interactions in the latent feature space. For instance, if an interaction xi is more similar to xj than x∗, the discrepancy in their corresponding importance scores dmij should also be smaller than dmj∗ . To achieve a fine-grained ranking of the importance scores, we propose a ranking consistency loss, which ensures that the importance ranking of interactions is accurately reflected in the perturbed output space. Specifically, if the perturbed output f(x\j), which excludes feature j, is closer to the original output than f(x\i), it suggests that feature i is more important than feature j and should therefore be assigned a higher mi. Our method is model-agnostic and produces improved explanations that are valuable for enhancing learning plans. Here we summarize the main contributions of this paper as follows:
- To the best of our knowledge, we present the first model-agnostic and priority-guided explanation method for knowledge tracing, which is able to provide highquality and fine-grained explanation for various knowledge tracing methods.
- We propose two novel consistency assumptions to explicitly capture the relationships between interactions and their importance scores, in the input latent space and the perturbed output space, respectively.
- We conduct extensive experiments to compare to 7 explanation methods across 4 knowledge tracing models and 2 benchmark datasets, with results showcasing its superior performance and generalization capability.
2 RelatedWork
Knowledge Tracing. We present the development of knowledge tracing methods based on their underlying deep learning architectures. Long short-term memory networks [Hochreiter and Schmidhuber, 1997] have been employed in numerous studies to model students' knowledge states [Piech et al., 2015; Long et al., 2021; Liu et al., 2023; Abdelrahman et al., 2023]. Memory-augmented neural networks with two external memory matrices [Graves et al., 2014], designed to store knowledge concept representations and mastery levels separately, have also been adopted in various studies [Zhang et al., 2017; Wang and Sahebi, 2023]. Additionally, attention mechanisms [Vaswani et al., 2017] have been widely applied to model the relevance between interactions and predict student performance [Pandey and Karypis, 2019; Ghosh et al., 2020; Pandey and Srivastava, 2020; Lee et al., 2022; Wang et al., 2023; Li et al., 2024].
Model Interpretability. Based on the application domains of explanation methods, we categorize existing approaches into static and temporal methods. Static methods are typically applied in domains without time dependencies, such as image classification. Gradient-based methods have been employed to measure the influence of each feature by calculating the gradient of features with respect to the model's output [Simonyan et al., 2014; Sundararajan et al., 2017]. Other approaches assess the contribution of each feature by examining how perturbations to input features affect the model's output [Ribeiro et al., 2016; Jalwana et al., 2020; Ren et al., 2023]. However, these methods often overlook time dependencies inherent in temporal models, which leads to explanations of suboptimal quality [Ismail et al., 2020]. To address these limitations, recent methods have focused on measuring the contribution of features by introducing the temporal relevance between features [Fong and Vedaldi, 2017; Tonekaboni et al., 2020; Crabb´e and van der Schaar, 2021; Bento et al., 2021; Leung et al., 2023; Bhalla et al., 2023]. However, these methods typically only distinguish between important and unimportant features and fail to provide finegrained explanations suitable for knowledge tracing, ignoring the differences in temporal dependencies between knowledge tracing and other temporal domains.
3 ProblemFormulation
A student's learning record consists of a sequence of interactions. Each interaction at time step t is denoted as xt = (qt, ct, at), where qt represents the exercise, ct corresponds to the knowledge concept, and at indicates the score. Typically, at takes a value of 0 or 1, with 0 indicating an incorrect response to the exercise and 1 indicating a correct response. Given a student's past learning record x = {x1, · · · , xt, · · · , xT}, the goal of knowledge tracing is to predict the learner's score aT+1 for exercise qT+1 associated with knowledge concept cT+1 at the next time step T + 1. Formally, we define knowledge tracing as ˆaT+1 = f(x, qT+1, cT+1), where f represents the knowledge tracing function we aim to learn from large-scale historical data and ˆaT+1 is the prediction for time step T + 1 generated by f.
In addition to predicting ˆaT+1, we further analyze the impact of each past interaction xt on ˆaT+1. Specifically, the explanation of f is defined as a vector m ∈ [0, 1]T , where each mt quantifies the importance of interaction xt to prediction ˆaT+1. For example, mt > mt′ indicates that the interaction xt has a greater influence on the prediction ˆaT+1 compared to xt′ . In this paper, our goal is to propose a novel and modelagnostic explanation method, which can effectively derive m for any knowledge tracing function f.
4 Method
Our explanation method consists of two components: 1) priority-guided explanation and 2) similarity-aware attribution consistency. Each component will be introduced in detail in the following sections.
4.1 Priority Guided Explanation
Assumptions Behind the Mask Optimization Method
We first investigate the underlying assumptions of current mask optimization methods. Based on these insights, we propose enhanced assumptions and leverage them to design our method. Current mask optimization methods can be categorized into the deletion game and preservation game [Dabkowski and Gal, 2017; Enguehard, 2023]. These methods typically adopt one of the two approaches [Crabb´e and van der Schaar, 2021] or simply combine them [Dabkowski and Gal, 2017].
In the deletion game, the goal is to use the perturbation function Φ(x,m) to obscure the data as minimally as possible while maximizing the change in the model's predictions. There are two ways to maximize this change: 1) making f(Φ(x,m)) farther from f(x), or 2) making f(Φ(x,m)) close to f(0). It has been found that the latter performs better, as it provides a clearer optimization objective. In contrast, the former is challenging to define clearly because there are multiple ways to achieve distance from f(x) [Enguehard, 2023]. In the following sections, we refer to the latter as the definition of the deletion game:
where the perturbation function is typically defined as:
where ⊙ denotes element-wise multiplication, and b is a reference vector used to replace the original features in x. In our experiment, we set b to the zero embedding 0, and define L as the Jensen-Shannon divergence.
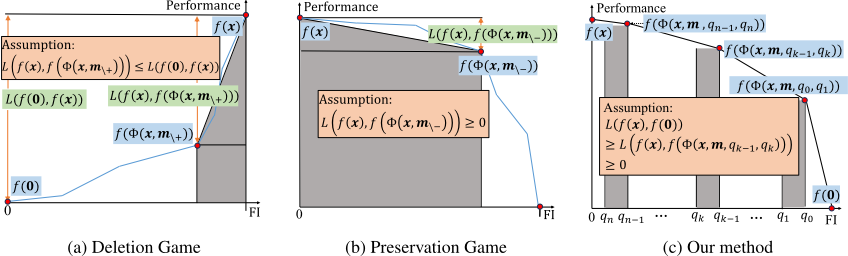
Furthermore, the deletion game is based on the following underlying assumption: a good explanation m satisfies the condition that removing the important features, based on the mask m, will significantly reduce the performance of f . This assumption is illustrated in Figure 2a. Based on this assumption, we have:
where Φ(x, m\+) denotes the perturbed input obtained by excluding the most important features from the original input.
In the preservation game, the goal is to obscure as much data as possible while keeping the predictions as close as possible to the original predictions. It is defined as follows:
The preservation game is based on the following underlying assumption: a good explanation m satisfies the condition that removing the unimportant features, based on m, will slightly reduce the performance of f. This assumption is illustrated in Figure 2b. Based on this assumption, we have:
where Φ(x, m\-) denotes the perturbed input obtained by excluding the least important features from the original input.
Based on the assumptions in deletion game and preservation game, we have:
The above equation reflects an ranking assumption regarding the removal of two feature intervals: those containing the least important features and those containing the most important features. We extend this assumption and propose an enhanced version, termed the ranking consistency assumption (Figure 2c). By partitioning features into intervals based on their importance scores (from most to least important) and progressively removing one interval at a time, the model's performance is expected to improve monotonically.
Priority-Guided Explanation Using Ranking Loss
We propose a ranking-based method to provide priorityguided explanation. To achieve this goal, we first define a list of values Q to separate the mask m:
where qk can be quantiles of m or even any values holds the following constraint:
Subsequently, we define the following binary operation for input perturbation:
where si refers to the i-th feature in S(m, qk-1, qk). For notation simplicity, we define
Recall that, based on deletion game and preservation game, we have the following conclusion:
We generalize the order assumption in Equation (1) and obtain the following enhanced assumption:
We implement the order assumption in Equation (3) using ranking loss to provide priority enhanced explanation.
where γ is a hyperparameter that determines the margin.
When a student has a long learning history, the computational cost of this loss function can become substantial. To mitigate this, we apply the ranking loss only to the top-K important features by setting q0 = max(m), where K is smaller than the length of the original input. This strategy reduces computational overhead and improves the accuracy of prioritizing the top-K features in the most critical explanations.
Directional Ranking Loss for Knowledge Tracing
The above method represents a general formulation designed for multi-class classification tasks. Knowledge tracing, however, is a binary classification task, where the direction of the perturbed prediction's deviation from the original prediction can be further specified.
In knowledge tracing, we aim to identify which features encourage the model to predict a correct response and which lead to an incorrect one. We use c and w to denote the labels for correct and incorrect responses, respectively. Since there are only two classes, the prediction is typically a single value with 1 indicating c and 0 indicating w. When the label is c, the perturbation should shift the prediction away from c and toward w. This will lead to a decrease in f(x) after the perturbation is applied. Let fk = f(Φ(x, S(m, qk-1, qk))), f = [f1, ..., fk, ..., fn, fn+1] and fn+1 = f(x) 1 , we reformulate Equation (3) as
and subsequently obtain the directional loss function for class c based on Equation (4) as
On the other hand, if the label is w, the perturbation should shift the prediction away from w and toward c, which will lead to an increase in f(x) after the perturbation is applied. Again, we reformulate Equation (3) as
and subsequently obtain the directional loss function for class w based on Equation (4) as
1 Through experiments, We observe that adding an additional item fn+1 = f (x) to f without perturbation improves performance.
By combining the above two cases, we define the Directional Ranking Loss for Priority-Guided Explanation (DRLPE) as:
One last important point is that the binary mask operation in Equation (2) is not differentiable. To solve this issue, we adopt the straight-through trick from Gumbel-Softmax [Jang et al., 2017]:
where sg[·] represents the stop-gradient operator, which acts as the identity operator during the forward pass and has a zero partial derivative during the backward pass.
4.2 Similarity-Aware Attribution Consistency
Since a student's performance on a specific exercise is influenced by their performance on other exercises involving similar knowledge concepts [Piech et al., 2015; Pandey and Karypis, 2019], we introduce the similarity-aware attribution consistency regularization. This regularization ensures that interactions with similar knowledge concepts have comparable importance scores for the model's predictions. Inspired by previous work [Ghosh et al., 2020], the similarity between interactions is defined as follows:
where e(x) is a fixed, non-trainable embedding of x, extracted from the pretrained target model, d is the dimension of e(x), and wt,t′ is the cumulative similarity between interactions at t and t′ . We enforce consistency in the importance scores of different interactions based on their similarity. This is defined as follows:
where mt is importance score of interaction at t.
4.3 Loss Function
We formally define the overall loss function as follows:
where λ1, λ2 are hyperparameters balancing the loss terms and L1(m) represents the Lasso regularization applied to m.
5 Experiment
5.1 Experimental Setup
Dataset. We evaluate the explanation methods on two public datasets, ASSISTment 2009 2 and ASSISTment 2017 3 . These datasets, collected from an online tutoring platform, are used to train the knowledge tracing models to be explained. For the ASSISTment 2009 dataset, we remove records without corresponding knowledge concepts, resulting in a dataset containing 4,151 students, 16,891 exercises, and 110 associated concepts, with a total of 325,637 records. The ASSISTment 2017 dataset includes 1,709 students, 3,162 exercises, and 102 associated concepts, comprising 942,816 interaction records.
2 https://sites.google.com/site/assistmentsdata/home/2009-2010assistment-data/skill-builder-data-2009-2010
3 https://sites.google.com/view/assistmentsdatamining/dataset
Knowledge tracing models. To comprehensively evaluate our proposed method, we select representative knowledge tracing models from various deep learning frameworks as explanation targets. The selected models include DKT [Piech et al., 2015], DKVMN [Zhang et al., 2017], SAKT [Pandey and Karypis, 2019], and AKT [Ghosh et al., 2020].
Metrics. Due to the absence of ground-truth explanations for knowledge tracing, we adopt the following two metrics in our experiments, inspired by the evaluation methods proposed in previous studies [Kim et al., 2020; Tonekaboni et al., 2020; Leung et al., 2023].
Comprehensiveness (Comp). We remove the most important features and compute the average change of Area Under the ROC Curve (AUC) compared with the original inputs. Higher is better with this metric, as it indicates that the explanation methods have identified the important features that significantly impact model performance.
where x\+ represents the perturbed input obtained by removing the important features from the original input.
Sufficiency (Suff). Instead of removing the important features, we remove the unimportant features and compute the change in the AUC compared to the original input. A lower score indicates better performance, as it signifies that the explanation methods have identified unimportant features with little or no impact on model performance.
where x\- represents the perturbed input obtained by removing the unimportant features from the original input.
5.2 Experiment Result
Comparison to Existing Methods
We compare our method against three static methods, including FO [Zeiler and Fergus, 2014], LIME [Ribeiro et al., 2016], and KernelSHAP [Lundberg and Lee, 2017], as well as four temporal methods, including FIT [Tonekaboni et al., 2020], TimeSHAP [Bento et al., 2021], DynaMask [Crabb´e and van der Schaar, 2021], and WinIT [Leung et al., 2023]. The results are presented in Table 1. Ours method outperforms others across all four models and both datasets. We also found that temporal explanation methods, such as DynaMask and FIT, generally outperform static explanation methods, likely due to their incorporation of temporal dependencies. For the AKT model, attention-based explanations show better performance compared to other baseline methods. However, this advantage is not observed in SAKT, suggesting that attention-based explanations do not always provide superior performance, despite the success of attention-based methods in various domains.
| Type | Methods | ASSISTment 2009 | ASSISTment 2017 | ASSISTment 2009 | ASSISTment 2017 | ||||
|---|---|---|---|---|---|---|---|---|---|
| Comp ↑ | Suff ↓ | Comp ↑ | Suff ↓ | Comp ↑ | Suff ↓ | Comp ↑ | Suff ↓ | ||
| DKT | DKVMN | ||||||||
| Random | 0.0192 | 0.0183 | 0.0044 | 0.0025 | 0.0184 | 0.0160 | 0.0041 | 0.0079 | |
| FO | 0.0682 | 0.0138 | 0.0889 | 0.0012 | 0.0740 | 0.0188 | 0.0994 | 0.0013 | |
| Static | LIME | 0.0792 | 0.0118 | 0.0845 | 0.0014 | 0.0787 | 0.0132 | 0.0981 | 0.0010 |
| KernelSHAP | 0.0745 | 0.0127 | 0.0745 | 0.0011 | 0.0785 | 0.0148 | 0.0973 | 0.0013 | |
| TimeSHAP | 0.0344 | 0.0402 | 0.0624 | 0.0158 | 0.0513 | 0.0507 | 0.0807 | 0.0445 | |
| Temporal | FIT | 0.0465 | 0.0155 | 0.0425 | -0.0019 | 0.0538 | 0.0123 | 0.0287 | 0.0024 |
| WinIT | 0.0305 | 0.0271 | 0.0357 | 0.0008 | 0.0376 | 0.0217 | 0.0540 | 0.0014 | |
| DynaMask | 0.0915 | 0.0103 | 0.0999 | 0.0006 | 0.0507 | 0.0231 | 0.0899 | 0.0014 | |
| Ours | 0.1470 | -0.0980 | 0.2379 | -0.0499 | 0.1498 | -0.0886 | 0.1088 | -0.1058 | |
| SAKT | AKT | ||||||||
| Random | 0.0574 | 0.0347 | 0.0007 | 0.0047 | 0.0261 | 0.0317 | 0.0040 | 0.0019 | |
| Attention | 0.0790 | 0.0282 | 0.0243 | 0.0001 | 0.0719 | 0.0426 | 0.0636 | 0.0082 | |
| FO | 0.1147 | 0.0186 | 0.0009 | -0.0012 | 0.0417 | 0.0294 | 0.0630 | 0.0004 | |
| Static | LIME | 0.1046 | 0.0184 | -0.0002 | -0.0005 | 0.0535 | 0.0210 | 0.0588 | -0.0003 |
| KernelSHAP | 0.1065 | 0.0226 | 0.0022 | -0.0014 | 0.0590 | 0.0211 | 0.0608 | -0.0017 | |
| TimeSHAP | 0.0893 | 0.1005 | 0.0396 | -0.0060 | 0.0419 | 0.0597 | 0.0504 | 0.0160 | |
| Temporal | FIT | 0.0249 | 0.0656 | 0.0019 | 0.0075 | 0.0467 | 0.0265 | 0.0315 | 0.0022 |
| WinIT | 0.0695 | 0.0426 | 0.0226 | -0.0026 | 0.0476 | 0.0258 | 0.0139 | -0.0001 | |
| DynaMask | 0.1294 | 0.0241 | 0.0222 | -0.0016 | 0.0374 | 0.0355 | 0.0540 | 0.0019 | |
| Ours | 0.3228 | -0.0666 | 0.2777 | -0.0609 | 0.0886 | -0.0323 | 0.1304 | -0.0188 | |
Ablation Experiment for Different Components
To evaluate the contribution of each component in our method, we conducted ablation studies on two datasets and four knowledge tracing models. Specifically, we tested three variants of our method:
- w/o Ranking. We eliminate the ranking loss to examine its impact on the explanation. Formally, we redefine the ranking loss in Equation (5) and Equation (6) as follows:
∀k ∈ [1, n], fk ≥ fn+1, if the true label is w.
- w/o AC. We remove the attribution consistency regularization on the mask.
- w/o Direction. We replace the directional ranking loss defined in Equation (7) with the ranking loss defined in Equation (4).
As shown in Table 2, removing the ranking loss component significantly degrades performance in most models and datasets, highlighting its importance. We also observe that removing the directional ranking loss component has a greater impact on performance than removing the attribution consistency component. These results indicate that both components are crucial for the performance of our method and for providing fine-grained explanations. Additionally, we found that the attribution consistency component has a significantly greater influence on performance than other components, but only in specific cases, such as the DKVMN model on the ASSISTment 2017 dataset. We believe this is because this regularization imposes a strong assumption on the model's internal decision process, which may not be suitable for all models. Nevertheless, the regularization still positively impacts the explanation quality, as demonstrated by the results.
| ASSISTment 2009 | ASSISTment 2017 | ASSISTment 2009 | ASSISTment 2017 | |||||
|---|---|---|---|---|---|---|---|---|
| Methods | Comp (-%) | Suff (+%) | Comp (-%) | Suff (+%) | Comp (-%) | Suff (+%) | Comp (-%) | Suff(+%) |
| DKT | DKVMN | |||||||
| Ours w/o Ranking w/o AC w/o Direction | 0.1470 (0%) 0.0186 (87%) 0.1264 (14%) 0.0575 (61%) | -0.0980 (0%) 0.0191 (120%) -0.0710 (27%) -0.0028 (97%) | 0.2379 (0%) 0.0257 (89%) 0.2346 (1%) 0.0560 (76%) | -0.0499 (0%) -0.0051 (90%) -0.0482 (3%) 0.0123 (125%) | 0.1498 (0%) 0.0186 (88%) 0.0724 (52%) 0.0449 (70%) | -0.0886 (0%) 0.0500 (156%) -0.0560 (37%) 0.0295 (133%) | 0.1088 (0%) 0.0209 (81%) 0.0074 (93%) 0.0618 (43%) | -0.1058 (0%) 0.0389 (137%) -0.0573 (46%) 0.0568 (154%) |
| SAKT | AKT | |||||||
| Ours w/o Ranking w/o AC w/o | 0.3228 (0%) 0.0355 (89%) 0.2458 (24%) 0.1069 (67%) | -0.0666 (0%) 0.0508 (176%) -0.0152 (77%) 0.0189 (128%) | 0.2777(0%) 0.0129 (95%) 0.1814 (35%) 0.0036 (99%) | -0.0609 (0%) -0.0074 (88%) (113%) (104%) | 0.0886 (0%) 0.0116 (87%) 0.0836 (6%) 0.0159 | -0.0323 (0%) 0.0242 (175%) -0.0169 (48%) 0.0126 (139%) | 0.1304 (0%) 0.0232 (82%) 0.0619 (53%) 0.0060 (95%) | -0.0188 (0%) 0.0181 (196%) -0.0103 (45%) 0.0033 (117%) |
| 0.0078 | ||||||||
| 0.0023 | ||||||||
| Direction | ||||||||
| (82%) | ||||||||
| Methods | ASSISTment 2009 | ASSISTment 2017 | ||
|---|---|---|---|---|
| ∆Comp ↑ | ∆Suff ↓ | ∆Comp ↑ | ∆Suff ↓ | |
| Attention | 0.0489 | 0.0075 | 0.0273 | 0.0012 |
| FO | 0.0077 | 0.0005 | 0.0233 | -0.0001 |
| LIME | 0.0166 | 0.0016 | 0.0278 | 0.0005 |
| KernelShap | 0.0186 | -0.0006 | 0.0263 | -0.0015 |
| TimeShap | 0.0141 | 0.0141 | 0.0229 | 0.0104 |
| FIT | 0.0152 | 0.0031 | 0.0101 | -0.0007 |
| WinIT | 0.0173 | 0.0022 | 0.0040 | -0.0046 |
| DynaMask | 0.0086 | 0.0019 | 0.0252 | -0.0006 |
| Ours | 0.0408 | -0.0094 | 0.0308 | -0.0025 |
Ranking Sensitivity in Explanation Methods
To evaluate different methods from this perspective, we propose an intuitive method to assess whether explanations from different methods preserve the ranking of important features.
The process is as follows: first, we permutate the ranking of explanations for the top-K important features so that mi does not match with xi for i ≤ K. Then, we evaluate the performance of the explanation on the top-⌊K/2⌋ features. In other words, the permutation operation will replace some features with importance rankings in the range [1, ⌊K/2⌋] with features having importance rankings in the range [⌊K/2⌋+1, K] or shuffle the features ranking in [1, ⌊K/2⌋]. We define the ranking sensitivity of explanations as the expected change in explanation performance after a single permutation.
where H(·) represents a metric for evaluating an explanation, such as Comp. E(D) represents the explanations for the dataset D, and PK(m) is the permutation set of mwith the top-K features permuted. Direct computation of ∆H is computationally expensive. Therefore, in practice, we use some sampled instances from PK(m) to approximate it. A higher ∆Comp or lower ∆Suff indicates that the explanation is more sensitive to the ranking of important features within [1, ⌊K/2⌋] and effectively differentiates features ranked in [1, ⌊K/2⌋] from those in [⌊K/2⌋ + 1, K].
The results are presented in Table 3, where we evaluate ∆H for all methods on the AKT model across two datasets. Our method consistently outperforms others in almost all metrics, except for a slight disadvantage compared to WinIT on ASSISTment 2017 and Attention on ASSISTment 2009, though it still surpasses the remaining methods. In most cases, we observe that ∆Comp > 0 and ∆Suff < 0, indicating that the shuffled explanations are inferior to the original ones and that these explanations successfully capture the priority among important features. However, we also notice that, in the ASSISTment 2009 dataset, ∆Suff > 0 for most baseline methods, which suggests that these explanations fail to capture the priority among important features.
Impact Study on the Number of Removed Interactions
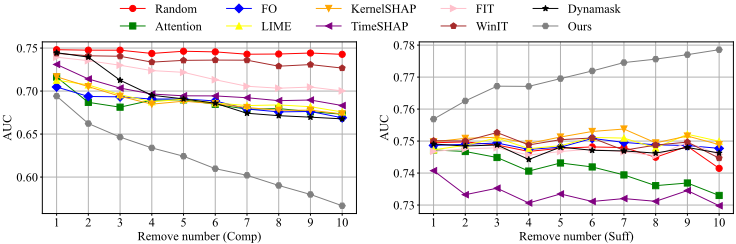
We evaluate our methods by removing different numbers of interactions and observing performance changes in the AKT model on ASSISTment 2017, as shown in Figure 3. To study whether the explanation methods can provide fine-grained explanations, we evaluate the performance on the top 10 features. The figure demonstrates that our method consistently outperforms others by a considerable margin. Additionally, the performance of our methods continuously decreases in Comp and increases in Suff as the number of masked interactions increases, while the performance of other methods fluctuates. This suggests that our method not only excels in identifying the most important interactions but also outperforms in ranking the top 10 interaction importance, while other methods exhibit mediocre performance when assigning importance scores to a small number of interactions.
6 Conclusion
In this work, we introduce a fine-grained feature-attribution method tailored to knowledge tracing that supports improved learning outcomes. Our approach outperforms existing techniques in uncovering key interactions across diverse models and real-world datasets, underscoring the value of task-specific explanations. While current evaluation relies on model performance, future work will explore more objective and comprehensive metrics to assess explanation quality and their educational value.
Acknowledgments
This research was funded by National Natural Science Foundation under Grant (62137001, 62272093, 62372097).
@inproceedings{ijcai2025p49,
  title     = {Priority Guided Explanation for Knowledge Tracing with Dual Ranking and Similarity Consistency},
  author    = {Li, Fan and Zhang, Tiancheng and Yin, Yifang and Yu, Minghe and Wang, Mengxiang and Yu, Ge},
  booktitle = {Proceedings of the Thirty-Fourth International Joint Conference on
               Artificial Intelligence, {IJCAI-25}},
  publisher = {International Joint Conferences on Artificial Intelligence Organization},
  editor    = {James Kwok},
  pages     = {430--438},
  year      = {2025},
  month     = {8},
  note      = {Main Track},
  doi       = {10.24963/ijcai.2025/49},
  url       = {https://doi.org/10.24963/ijcai.2025/49},
}
TY - CPAPER TI - Priority Guided Explanation for Knowledge Tracing with Dual Ranking and Similarity Consistency AU - Li, Fan AU - Zhang, Tiancheng AU - Yin, Yifang AU - Yu, Minghe AU - Wang, Mengxiang AU - Yu, Ge T2 - Proceedings of the Thirty-Fourth International Joint Conference on Artificial Intelligence, IJCAI-25 PB - International Joint Conferences on Artificial Intelligence Organization PY - 2025 SP - 430 EP - 438 DO - 10.24963/ijcai.2025/49 UR - https://doi.org/10.24963/ijcai.2025/49 ER -Copied
Machine-readable versions of this paper, for tools and AI agents:





