
Dirichlet Process-Based Robust Clustering Using the Median-of-Means Estimator
Proceedings of the Thirty-Fourth International Joint Conference on Artificial Intelligence. Main Track. Pages 4770-4778.
https://doi.org/10.24963/ijcai.2025/531
Keywords
- Machine Learning: ML: Unsupervised learning
- Machine Learning: ML: Robustness
- Machine Learning: ML: Learning theory
- Machine Learning: ML: Clustering
Abstract
Clustering stands as one of the most prominent challenges in unsupervised machine learning. Among centroid-based methods, the classic $k$-means algorithm, based on Lloyd's heuristic, is widely used. Nonetheless, it is a well-known fact that $k$-means and its variants face several challenges, including heavy reliance on initial cluster centroids, susceptibility to converging into local minima of the objective function, and sensitivity to outliers and noise in the data. When data contains noise or outliers, the Median-of-Means (MoM) estimator offers a robust alternative for stabilizing centroid-based methods. On a different note, another limitation in many commonly used clustering methods is the need to specify the number of clusters beforehand. Model-based approaches, such as Bayesian nonparametric models, address this issue by incorporating infinite mixture models, eliminating the predefined cluster count requirement. Motivated by these facts, we propose an efficient and automatic clustering technique in this article by integrating the strengths of model-based and centroid-based methodologies. Our method mitigates the effect of noise on the quality of clustering while simultaneously estimating the number of clusters. Statistical guarantees on an upper bound of clustering error and rigorous assessment through simulated and real datasets suggest the advantages of our proposed method over existing state-of-the-art clustering algorithms.
- [Arora et al., 2000] Sanjeev Arora, Prabhakar Raghavan, and Satish Rao. Approximation schemes for euclidean k- medians and related problems. Conference Proceedings of the Annual ACM Symposium on Theory of Computing, 12 2000.
- [Arthur and Vassilvitskii, 2007] David Arthur and Sergei Vas- silvitskii. k-means++: the advantages of careful seeding. In ACM-SIAM Symposium on Discrete Algorithms, 2007.
- [Bachem et al., 2017] Olivier Bachem, Mario Lucic, and An- dreas Krause. Distributed and provably good seedings for k-means in constant rounds. In Doina Precup and Yee Whye Teh, editors, Proceedings of the 34th International Con- ference on Machine Learning, volume 70 of Proceedings of Machine Learning Research, pages 292-300. PMLR, 06-11 Aug 2017.
- [Bishop and Nasrabadi, 2006] Christopher M Bishop and Nasser M Nasrabadi. Pattern recognition and machine learning, volume 4. Springer, 2006.
- [Bradley et al., 1996] Paul Bradley, Olvi Mangasarian, and W. Street. Clustering via concave minimization. In M.C. Mozer, M. Jordan, and T. Petsche, editors, Advances in Neural Information Processing Systems, volume 9. MIT Press, 1996.
- [Bregman, 1967] L.M. Bregman. The relaxation method of finding the common point of convex sets and its application to the solution of problems in convex programming. USSR Computational Mathematics and Mathematical Physics, 7(3):200-217, 1967.
- [Brunet-Saumard et al., 2022] Camille Brunet-Saumard, Edouard Genetay, and Adrien Saumard. K-bmom: A robust lloyd-type clustering algorithm based on bootstrap median-of-means. Computational Statistics & Data Analysis, 167:107370, 2022.
- [Chakraborty et al., 2020] Saptarshi Chakraborty, Debolina Paul, Swagatam Das, and Jason Xu. Entropy weighted power k-means clustering. In International conference on artificial intelligence and statistics, pages 691-701. PMLR, 2020.
- [Chakraborty et al., 2023] Chandramauli Chakraborty, Sayan Paul, Saptarshi Chakraborty, and Swagatam Das. Cluster- ing high-dimensional data with ordered weighted ℓ 1 regu- larization. In Francisco Ruiz, Jennifer Dy, and Jan-Willem van de Meent, editors, Proceedings of The 26th Interna- tional Conference on Artificial Intelligence and Statistics, volume 206 of Proceedings of Machine Learning Research, pages 7176-7189. PMLR, 25-27 Apr 2023.
- [Chaturvedi et al., 2001] Anil Chaturvedi, Paul E. Green, and J. Douglas Caroll. K-modes clustering. Journal of Classifi- cation, 18(1):35-55, Jan 2001.
- [der Laan et al., 2003] Mark Van der Laan, Katherine Pollard, and Jennifer Bryan. A new partitioning around medoids algorithm. Journal of Statistical Computation and Simula- tion, 73(8):575-584, 2003.
- [Devroye et al., 2016] Luc Devroye, Matthieu Lerasle, Ga- bor Lugosi, and Roberto I. Oliveira. Sub-Gaussian mean estimators. The Annals of Statistics, 44(6):2695 -2725, 2016.
- [Duchi et al., 2011] John Duchi, Elad Hazan, and Yoram Singer. Adaptive subgradient methods for online learning and stochastic optimization. Journal of machine learning research, 12(7), 2011.
- [Friedman, 1937] Milton Friedman. The use of ranks to avoid the assumption of normality implicit in the analysis of variance. Journal of the American Statistical Association, 32(200):675-701, 1937.
- [Hjort et al., 2010] N. L. Hjort, C. Holmes, P. Müller, and S. G. Walker. Bayesian Nonparametrics. Cambridge Series in Statistical and Probabilistic Mathematics. Cambridge University Press, 2010.
- [Hubert and Arabie, 1985] Lawrence Hubert and Phipps Ara- bie. Comparing partitions. Journal of Classification, 2(1):193-218, Dec 1985.
- [Jain and Law, 2005] Anil K. Jain and Martin H. C. Law. Data clustering: A user's dilemma. In Sankar K. Pal, Sang- hamitra Bandyopadhyay, and Sambhunath Biswas, editors, Pattern Recognition and Machine Intelligence, pages 1-10, Berlin, Heidelberg, 2005. Springer Berlin Heidelberg.
- [Klochkov et al., 2021] Yegor Klochkov, Alexey Kroshnin, and Nikita Zhivotovskiy. Robust k-means clustering for distributions with two moments. The Annals of Statistics, 49(4):2206 -2230, 2021.
- [Kulis and Jordan, 2012] Brian Kulis and Michael Jordan. Revisiting k-means: New algorithms via bayesian non- parametrics. In John Langford and Joelle Pineau, editors, Proceedings of the 29th International Conference on Ma- chine Learning (ICML-12), ICML '12, pages 513-520, New York, NY, USA, July 2012. Omnipress.
- [Lecué et al., 2020] Guillaume Lecué, Matthieu Lerasle, and Timlothée Mathieu. Robust classification via mom mini- mization. Machine learning, 109:1635-1665, 2020.
- [Lloyd, 1982] S. Lloyd. Least squares quantization in pcm. IEEE Transactions on Information Theory, 28(2):129-137, 1982.
- [Murphy, 2018] Kevin P Murphy. Machine learning: A prob- abilistic perspective (adaptive computation and machine learning series). The MIT Press: London, UK, 2018.
- [Nemirovsky and Yudin, 1983] Arkadi S. Nemirovsky and David B. Yudin. Problem Complexity and Method Effi- ciency in Optimization. John Wiley & Sons, Inc New York, 1983.
- [Ng et al., 2001] Andrew Ng, Michael Jordan, and Yair Weiss. On spectral clustering: Analysis and an algorithm. In T. Di- etterich, S. Becker, and Z. Ghahramani, editors, Advances in Neural Information Processing Systems, volume 14. MIT Press, 2001.
- [Paul et al., 2021] Debolina Paul, Saptarshi Chakraborty, Swagatam Das, and Jason Xu. Uniform concentration bounds toward a unified framework for robust clustering. In M. Ranzato, A. Beygelzimer, Y. Dauphin, P.S. Liang, and J. Wortman Vaughan, editors, Advances in Neural Infor- mation Processing Systems, volume 34, pages 8307-8319.
- Curran Associates, Inc., 2021.
- [Pollard, 1981] David Pollard. Strong consistency of k-means clustering. The Annals of Statistics, pages 135-140, 1981.
- [R Core Team, 2022] R Core Team. R: A Language and En- vironment for Statistical Computing. R Foundation for Statistical Computing, Vienna, Austria, 2022.
- [Raykov et al., 2016] Yordan P Raykov, Alexis Boukouvalas, Fahd Baig, and Max A Little. What to do when K-Means clustering fails: A simple yet principled alternative algo- rithm. PLoS One, 11(9):e0162259, September 2016.
- [Shah and Koltun, 2017] Sohil Atul Shah and Vladlen Koltun. Robust continuous clustering. Proc Natl Acad Sci U S A, 114(37):9814-9819, August 2017.
- [Terada, 2014] Yoshikazu Terada. Strong consistency of re- duced k-means clustering. Scandinavian Journal of Statis- tics, 41(4):913-931, 2014.
- [Tzortzis and Likas, 2014] Grigorios Tzortzis and Aristidis Likas. The minmax k-means clustering algorithm. Pattern Recognition, 47(7):2505-2516, 2014.
- [van der Maaten and Hinton, 2008] Laurens van der Maaten and Geoffrey Hinton. Visualizing data using t-sne. Journal of Machine Learning Research, 9(86):2579-2605, 2008.
- [Witten and Tibshirani, 2010] Daniela M Witten and Robert Tibshirani. A framework for feature selection in clustering. J. Am. Stat. Assoc., 105(490):713-726, June 2010.
- [Xu and Lange, 2019] Jason Xu and Kenneth Lange. Power k-means clustering. In Kamalika Chaudhuri and Ruslan Salakhutdinov, editors, Proceedings of the 36th Interna- tional Conference on Machine Learning, volume 97 of Pro- ceedings of Machine Learning Research, pages 6921-6931. PMLR, 09-15 Jun 2019.
- [Xu and Tian, 2015] Dongkuan Xu and Yingjie Tian. A com- prehensive survey of clustering algorithms. Annals of Data Science, 2(2):165-193, Jun 2015.
- [Zhang et al., 1999] Bin Zhang, Meichun Hsu, and Umesh- war Dayal. K-harmonic means -a data clustering algorithm. Hewlett-Packard Labs Technical Report HPL-1999-124, 55, 1999.
- [Zhang et al., 2021] Zhen Zhang, Qilong Feng, Junyu Huang, Yutian Guo, Jinhui Xu, and Jianxin Wang. A local search algorithm for k-means with outliers. Neurocomputing, 450:230-241, 2021.
References were extracted automatically from the PDF and may contain errors.
Full text extracted automatically from the PDF; figures, tables and equations may differ. The PDF is the version of record.
1 Introduction
Within the fields of machine learning, data mining, and statistics, clustering stands out as a very prominent challenge in the domain of unsupervised learning. Its focus lies in employing methodologies to reveal underlying patterns, called clusters, within datasets. These clusters are defined so that data points grouped within the same cluster demonstrate a degree of internal similarity [Xu and Tian, 2015]. Conversely, data points originating from separate clusters are expected to exhibit notable dissimilarity. Typically, data points are portrayed as vectors encompassing variables, referred to as features, in the machine learning community.
The k-means algorithm [Lloyd, 1982] stands as a classic and extensively used clustering technique. Given a specific number of clusters, say K, the k-means algorithm iterates through two key steps: cluster assignment, where each data point is assigned to the cluster with the nearest centroid based on Euclidean or ℓ2 distance, and computing the cluster centroids, which involves placing each cluster's centroid at the sample mean of the points assigned to that cluster over the course of the current iteration. Given a dataset X = {X1, . . . ,Xn}, the k-means algorithm attempts to partition X into K mutually exclusive classes by optimizing the objective function:
where Θ = {θ1, θ2, . . . , θK} is the set of centroids corresponding to each of the K clusters, and ∥ · ∥2 is the usual ℓ2 norm. This optimization seeks to minimize the withincluster variability. Unfortunately, k-means and its variants suffer from several well-documented limitations, such as significant reliance on the initial selection of cluster centroids [Bachem et al., 2017], tendency to converge to suboptimal local minima rather than the global minimum of the objective function [Xu and Lange, 2019], and importantly, high sensitivity to outliers [Zhang et al., 2021]. Moreover, kmeans performs poorly when the clusters are non-spherical [Ng et al., 2001], and even when the clusters are spherical but with unequal cluster radii and densities [Raykov et al., 2016]. Apart from k-means, some popular clustering methods include its improved version k-means++ [Arthur and Vassilvitskii, 2007], as well as k-medians [Bradley et al., 1996; Arora et al., 2000], k-modes [Chaturvedi et al., 2001], kHarmonic Means [Zhang et al., 1999], etc.
Another major shortcoming of these algorithms used in practice is that most of them explicitly presuppose the number of clusters. The most commonly recognized algorithms such as k-means clustering, spectral clustering [Ng et al., 2001], MinMax k-means clustering [Tzortzis and Likas, 2014], Gaussian mixture models suffer from this issue.
It is well-established in the machine learning community that Bayesian approaches generally offer room for more flexible models in various settings. For instance, the Dirichlet process mixture model [Hjort et al., 2010], which is notably a Bayesian nonparametric model, gives rise to infinite mixture models that do not require the number of clusters in the dataset to be supplied beforehand. [Kulis and Jordan, 2012] considered such an approach that bridges the concepts of k-means and Gaussian mixture models [Bishop and Nasrabadi, 2006; Murphy, 2018]. Nevertheless, their method, called DP means, exhibits flexibility in guessing an optimal number of clusters; the algorithm utilizes the cluster average, i.e., the arithmetic mean of the data points within the cluster, for centroid updation, compromising its performance specifically on noisy or outlier-laden datasets.
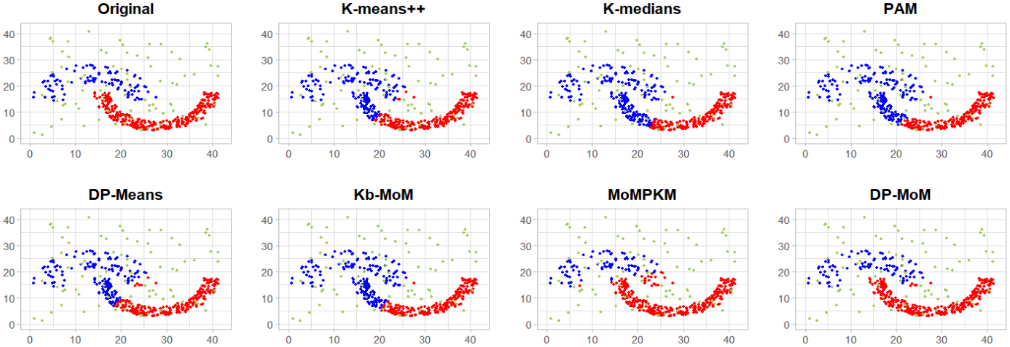
In this article, we address these challenges by fusing two prominent clustering methodologies: centroid-based and model-based. Our proposed algorithm, DP-MoM, is designed to excel in scenarios involving noisy or outlier-affected data, thanks to its use of the median of means estimator (MoM) [Nemirovsky and Yudin, 1983; Devroye et al., 2016]. Additionally, DP-MoM offers the advantage of not necessitating a predefined number of clusters. To demonstrate the efficacy of our approach, we present a compelling example. We introduce randomly generated noisy observations into the Jain dataset [Jain and Law, 2005] (refer to the Experiments section for detailed information) and subsequently apply various cuttingedge algorithms, including our proposed DP-MoM, to evaluate their respective performances on the original dataset. As illustrated in Figure 1, DP-MoM showcases notably superior clustering accuracy compared to existing algorithms.
All details of simulation studies and real data analysis, and proofs of theoretical results can be found at https://arxiv.org/ abs/2311.15384. Codes can be found at https://github.com/ jyotishkarc/DP-MoM.
2 Background
2.1 Clustering based on Dirichlet Process
[Kulis and Jordan, 2012] introduced a method that uses Gibbs sampling, serving as a Bayesian counterpart to representing kmeans with a mixture of Gaussians. We assume the following model to capture the cluster structure of the dataset and whose limiting case reduces to the Dirichlet Process Mixture models:
where θj 's are the cluster centroids, G0 is taken to be a N(0, ρI) prior where I denotes the identity matrix of appropriate order. Dir (k, π0) denotes the Dirichlet distribution, where π is the mixture probability with π0 = αk 1. Here, 1 denotes the vector (of appropriate order) of all 1's. For i = 1, 2, . . . , n, zi denotes the label assigned to the data points Xi, and Discrete(π) indicates that zi takes the value j with probability πj , for j = 1, . . . , k.
The hard clustering algorithm, called DP-means, proposed by [Kulis and Jordan, 2012] is essentially the case when σ → 0. This limiting case boils down to minimizing the objective:
The minimization of the function in (2) with respect to k is performed iteratively. At each step of the algorithm, the distance from each data point to its closest cluster centroid is determined. Subsequently, each point is assigned to the cluster with the closest centroid, unless this distance exceeds λ. In such an instance, a new cluster is initialized with the data point serving as the centroid of the newly created cluster. This algorithm determines the number of clusters in a dataset without necessitating prior knowledge of k. It maintains the simplicity inherent in Lloyd's approach while ensuring effectiveness even in situations where the true number of clusters is unknown.
2.2 Median-of-Means (MoM)
Let us first consider a simple scenario in which we observe X1,X2, . . . ,Xn ∼ F with the goal of estimating the mean of the distribution F , ie µ0 = E[X1] = ∫ x dF(x).
We employ the median-of-means (MoM) estimator to estimate µ0 as follows: Assume that the sample size n = bL where L is the number of buckets (disjoint subsamples) and b is the size of each bucket. We first randomly split the data into L partitions (or buckets) and calculate the mean of the data points belonging to each partition. This gives rise to estimators ̂ µ1, ̂ µ2, . . . , ̂ µL. The MoM estimator defined to be the median of these b many mean estimators, namely,
Unlike the sample mean, which has a finite sample breakdown point of 0, the MoM estimator is much more robust, showing a breakdown point of [(L- 1)/2]/n, thus guaranteeing stability when the number of buckets is of the order of the number of data points, i.e. L = O(n). Another reason why this estimator is of such interest (apart from being a robust estimator) is that given var(X1) = σ2 < ∞ in the finite sample case, it satisfies concentration inequalities that aid in proving consistency results, thereby leading to stable and consistent MoM-based estimators.
In case of centroid-based clustering, the median-of-means estimator is used as follows: We first partition the dataset into L subparts. In each iteration, we calculate the mean objective function value for each bucket Bl, 1b ∑i∈Bl fΘ(Xi) (where Θ is the collection of centroids from the previous iteration) and choose the bucket Lt in such a way that
The centroids Θ are recalculated based on the observations in the bucket BLt and all the observations are clustered using these centroids.
3 Dirichlet Process Clustering withMoM
3.1 ProblemFormulation
The problem posed to us is that of partitioning a given dataset X = {X1,X2, . . . ,Xn} ⊂ Rp into natural, disjoint clusters such that the variance within each cluster is minimized at the same time maximizing the inter-partition variability.
In the context of centroid-based clustering, the j th cluster is represented by its centroid θj . The concept of "closeness" is quantified by utilization of a Bregman divergence [Bregman, 1967] as a dissimilarity measure. Let us denote the set of all non-negative real numbers by R+0 . Any function ϕ : Rp → R that is convex and differentiable, gives rise to the Bregman divergence dϕ : Rp ×Rp →R+0 defined as
The Bregman divergence that we shall be using in our framework is the Euclidean distance, generated by ϕ(u) = ∥u∥22 ; although it can be generalized to any valid Bregman divergence. Prior knowledge of the number of centroids k enables us to perform clustering by minimizing the objective function
Here, Ψ : R+0 k →R+0 is the functionmin1≤j≤k dϕ(X, θj). In our case, we will seek to minimize the objective function
with respect to both {θj}1≤j≤k and k.
3.2 Optimization
Optimizing the above objective is achieved using gradientbased methods. In our case, we employ the AdaGrad algorithm [Duchi et al., 2011] for the said purpose. The centroids are updated as follows:
with
where I{Xi∈Cj} = 1 if Xi ∈ Cj , and 0 otherwise.
3.3 Algorithm
Algorithm 1 Dirichlet Process Clustering using Median-ofMeans (DP-MoM)
Input: Data matrix X , Penalty parameter λ, ϵ, Learning Rate η, Tolerance δ.
Output: Number of clusters k, Cluster assignments U,
Cluster centroids Θ.
Initialization: Randomly divide {1, . . . , n} into L buckets of equal size. Set θ1 = 1n ∑ni=1 Xi, k = 1, b = nL , and U = 1.
14: end while
Algorithm 1 summarizes the pseudocode for the above procedure. The tuning parameter ε is set to 1. The learning rate η is typically chosen to be the power of 10 which is of the order of the squared maximum pairwise distance in the dataset, or one lower than that i.e. if the maximum squared separation between any two observations in the data is D, then we set η = 10⌈log10 D/2⌉ or 10⌈log10 D/2⌉-1 depending on which of these values aids efficient clustering using our proposed method, where ⌈·⌉ represents the ceiling function. Our proposed framework enables us to automatically detect the appropriate number of clusters based on the value of the penalty parameter λ which is optimized by grid-searching.
3.4 Parameter Selection
The first step in our proposed algorithm is partitioning the dataset randomly. This is achieved by choosing a permutation of the data points and then placing them in different buckets in the order of the permutation. Though this technique achieves randomness in terms of partitioning the data, arbitrary partitioning may lead to undesirable results, which is why the partitioning (or permutation for that matter) needs to be carefully chosen. It is pretty obvious that the buckets need to be fairly good representatives of the clusters for us to obtain accurate clustering. For this purpose, in each bucket of size b, we choose b data points using a k-means++ type initialization to choose b centers i.e., each data point has a probability proportional to its distance from the nearest centroid of being chosen. Once they are chosen for the next bucket, we repeat this process, leaving out the data points in all the previous buckets. This indexing scheme gives us a measure of control over the clustering and the subsequent grid-searching to determine the optimal value of the penalty parameter λ and the number of buckets L. As discussed in Section 2.2, in order for the centroid estimates to be stable and not break down in the presence of a little contamination, it is reasonable to assume that we should restrict the value of L such that L = O(n).
In order to tune λ, we determine λmin and λmax, the minimum and maximum pairwise squared distance between the data points, respectively. 11 equally-spaced points λmin = λ11 < λ12 < · · · < λ110 < λ111 = λmax are picked, and the algorithm is run for these values. We select λ1i∗ corresponding to the most accurate clustering and divide its neighborhood [λ1i∗-1 , λ1i∗+1 ] (or[λ11 , λ12 ] or[λ110 , λ111 ]) into 20 divisions and re-run the algorithm as we did in the interval [λmin, λmax]. We repeat this one more time, so that the feasible range for the penalty parameter λ has been segmented to the order of 103 .
We then choose the λ value for which the best clustering accuracy is attained. We call it λopt. Since our proposed algorithm is a randomized one, we cannot readily conclude that λopt is the only value corresponding to which we will obtain high clustering accuracy. In fact, for another repetition of the above experiment, we may not obtain an identical favorable permutation or the same optimal λ value. So, we repeat the aforementioned grid-searching experiment a number of times (say about 35 times) so that we may obtain a range of λ that will be suitable to work with in order to derive the best results out of the proposed framework. We choose the median of the clustering accuracies, measured with the Adjusted Rand Index (ARI) [Hubert and Arabie, 1985] so obtained, as a representative of the clustering accuracy of the algorithm. When the ground truth is unavailable, we may use the t-SNE [van der Maaten and Hinton, 2008] plot of the data to form an idea of the ground truth.
3.5 Computational Complexity
In each iteration, our algorithm first ascertains whether an increase in the number of clusters is needed. The centroids are recalculated thereafter, and the cluster assignments are made accordingly. This phase typically takes O(nCp) time steps to complete, where C represents the number of clusters in that iteration. The calculations presented in the following section assume that the number of clusters is upper bounded by some finite K < n. Consequently, the worst case runtime of the DP-MoM algorithm remains O(nKp) for every iteration.
The computational complexity of the DP-means algorithm is comparable to that of DP-MoM, as each iteration requires O(nCp) steps to complete, with C denoting the number of clusters in that specific iteration. On the contrary, k-means demands O(nkp) steps per iteration, with k representing the predefined cluster count. This is typically slated to be lower than that of DP-means or DP-MoM. In the case where we set k = K however, k-means will perform no more efficiently than DP-MoM in terms of runtime.
4 Theoretical Analysis
Let M denote the set of probability measures P on Rp with bounded ℓ2 norm, i.e., for any random vector X ∼ P, we have E∥X∥2 ≤ γ 2 < ∞ where ∥ · ∥ denotes the ℓ2 norm. We shall assume that all the data points are independent and identically distributed (i.i.d.) with finite squared ℓ2 norm. This is a standard assumption considered in [Klochkov et al., 2021] which is a much milder assumption as compared to the bounded support assumption in [Paul et al., 2021].
We denote the empirical distribution derived from X1,X2, . . . ,Xn, by Pn, that is, Pn(A) = 1n ∑ni=1 I{Xi ∈ A} for any Borel set A. For the sake of notational simplicity, we write µf := ∫ f dµ. The quantities PnfΘ and PfΘ are defined as follows:
Further let Θ∗ be the global minimizer of PfΘ, and ̂Θ(MoM) n be the minimizer of (4).
A2. The number of clusters k is bounded above by some finite K ∈ N, where K < n.
The inherent dependency of the number of centroids on the cluster penalty parameter λ makes it possible for us to choose λ appropriately so that the cluster count doesn't exceed K. Moreover, we deduce from A2 that, at a certain juncture, the number of centroids reaches a state of stability. In this state, it is only the cluster centroids themselves that undergo updates during each iteration, while the number of centroids remains constant. This will make our analysis independent of the penalty parameter λ as the term kλ is not subject to change after a finite number of iterations. Thus, beyond a finite number of steps, the objective function effectively reduces to
Since we have chosen an infinite support for P , following [Klochkov et al., 2021], we can say that for Θ∗ , there must exist a positive real number M = M(p, k) such that ∥θj∥2 ≤ M for every θj ∈ Θ∗ where j = 1, 2, . . . , k.
4.1 Analysis under the Median-of-Means (MoM) Paradigm
We represent the set of all inliers as {Xi}i∈I and the outliers as {Xi}i∈O. We make the following assumptions to determine the rate at which |Pf̂Θ(MoM) n -PfΘ∗| approaches 0.
Assumption A3 ensures that the inliers arise independently from some distribution P . A4 guarantees that at least half of the L partitions are devoid of outliers. Such an assumption involving an upper bound on the number of outliers is essential as a high degree of contamination would imply that these so called 'outliers' need to be treated as the data. This is, in fact, a milder requirement compared to the condition L > 4|O| imposed in the recent work [Lecu´e et al., 2020]. Crucially, we highlight that no distributional assumptions are imposed on the outliers, permitting them to be unbounded, originate from heavy-tailed distributions, or exhibit any dependence structure among themselves.
Since ∥θ∥2 ≤ M for all θ ∈ Θ∗ , the search space for ̂Θ(MoM) n may be constrained to G . Subsequently, we establish a high probability bound on supΘ∈G |MoMnL(fΘ) - PfΘ|, and further use it to bound |Pf̂Θ(MoM) n -PfΘ∗|. We use "≲" to denote the fact that a quantity is lesser than a constant multiple of the other.
Theorem 4.1. Under A3-A4, with probability at least 1 - 2e-2Lδ2 ,
We present below a corollary that aids us in controlling the absolute difference |Pf̂Θ(MoM) n -PfΘ∗|.
Corollary 4.1. Under A3-A4, with probability at least 1 - 2e-2Lδ2 ,
4.2 Asymptotic Properties: Consistency and Rate of Convergence
We now consider the classical setting where p is held constant, and demonstrate that the previously presented results imply strong consistency, with rate of convergence of the order of O(n-1/2 ). We first follow the same idea of convergence of ̂Θ(MoM) n to Θ∗ that is outlined in [Pollard, 1981]. Since the centroids are unique up to rearrangement of labels, our measure of dissimilarity
is considered over PK the set of all real permutation matrices of order K, where ∥ · ∥F represents the Frobenius norm.
The sequence Θn → Θ if limn→∞ D(Θn, Θ) = 0. Following [Terada, 2014; Chakraborty et al., 2020], we assume the identifiablity condition:
We now examine the consistency of ̂Θ(MoM) n . In addition, we analyze the rate at which |Pf̂Θ(MoM) n -PfΘ∗| approaches 0. Theorem 4.2 affirms that consistency holds, with O(n-1/2 ) rate of convergence. Before delving further, recall that Xn = OP (an) if the sequence Xn/an is bounded in probability.
A6. The number of buckets L→∞as n→∞.
Theorem 4.2. Under A1-A5,
and consequently P f ̂Θ(MoM) n p -→ PfΘ∗. Furthermore, under A6, we have ̂Θ(MoM) n p -→ Θ∗ .
5 Experiments
We now empirically compare our proposed framework with existing clustering approaches to thoroughly validate and evaluate its effectiveness. The accuracy of cluster assignments has been rigorously assessed using the Adjusted Rand Index (ARI), a robust measure of clustering performance. Our evaluation encompasses an extensive array of competing centroid-based clustering methods, including renowned techniques such as k-means++, Sparse k-means (SKM) [Witten and Tibshirani, 2010], k-medians, Partition around Medoids (PAM) [der Laan et al., 2003], Robust Continuous Clustering (RCC) [Shah and Koltun, 2017], DP-means [Kulis and Jordan, 2012], k-bootstrap Median-of-Means (kb-MoM) [BrunetSaumard et al., 2022], Median-of-Means with Power k-means (MoMPKM), and Ordered Weighted l1 k-means (OWL kmeans) [Chakraborty et al., 2023]. These state-of-the-art algorithms are benchmarked against the proposed DP-MoM algorithm across various experimental scenarios. The simulation experiments were conducted using a computer equipped with Intel(R) Core(TM) i3-7020U 2.30GHz processor, 4GB RAM, 64-bit Windows 10 operating system in the R programming language [R Core Team, 2022].
Our first experiment involves implementing the aforementioned techniques on several datasets from the UCI Machine Learning Repository 1 and the Compcancer database 2 . Owing to the fact that our clustering technique relies on randomization while partitioning the data into buckets, the accuracy measure has been computed as the median value of the obtained ARI over 35 test runs. It was observed, for most of the datasets, that DP-MoM performed considerably better than its competitors in terms of ARI. Apart from this, two other experiments were conducted to assess the strength of the algorithm in terms of robustness and ability to detect clusters of various shapes that were in proximity to one another in terms of their pairwise Euclidean distances.
1 https://archive.ics.uci.edu/
2 https://schlieplab.org/Static/Supplements/CompCancer/
5.1 Simulation Studies
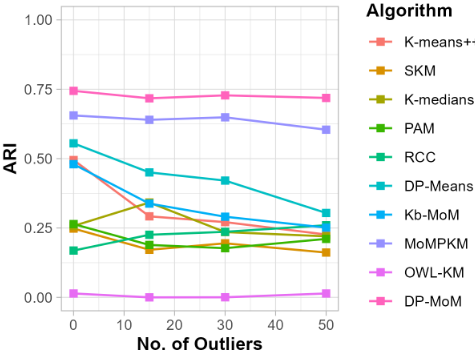
Study of Robustness on SimulatedData: 30 data points are generated from each of the 4 quadrants in the 2-dimensional Euclidean plane using a special generation scheme. For the first quadrant, we generate Ri ∼ U(0, 1) and θi ∼ U ( π 36 , 17π 36 ). Once this is done for all i = 1, 2, . . . , 30, we set Xi = (Ri cos θi, Ri sin θi) for all i = 1, 2, . . . , 30 as our data points in the first quadrant. In the other quadrants, we draw Ri in the same way and generate θi uniformly from ( (j-1)π 2 + π 36 , jπ 2 - π 36 ) for the j th quadrant. We place the data points lying in the same quadrant in the same cluster. Just like in the experiment using the Jain dataset, outliers have been generated uniformly on [-1, 1] × [-1, 1]. 15, 15, and 20 outliers were introduced in three stages, respectively, so that the total number of data points stood at 135, 150, and 170 respectively. While the efficiency of the other competing algorithms plummeted or showed erratic behavior (often combined with low accuracy), the ARI corresponding to DP-MoM did not waver. Figure 2 depicts the superiority of our proposed algorithm over the other existing clustering techniques.
5.2 Real Data Experiments
Introducing Outliers - A Case Study
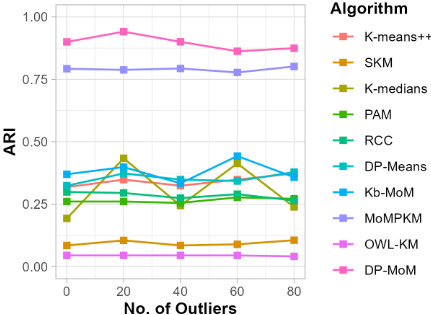
We have picked the dataset Jain [Jain and Law, 2005] for this experiment. Jain is a 2-dimensional dataset with 373 data points. The 2 natural clusters are shaped like boomerangs, as can be seen in Figure 1 in Section 1. The performance of the algorithms was assessed on the original dataset. Afterward, several outliers were uniformly generated throughout the range of the data. 20 fresh outliers were introduced in each of the 4 stages, and at each stage, the algorithms were pitted against each other again. Even with the introduction of 80 outliers, DP-MoM remained remarkably robust, consistently achieving a clustering accuracy of nearly 0.9 in terms of ARI (while the maximum ARI achieved was above that figure in all but one stage). Conversely, many other competing algorithms struggled to maintain their performance in the face of increasing outlier counts. They exhibited significant fluctuations in ARI as the number of outliers rose. Even the ones that maintained stability could only muster a measly ARI of 0.42, as did all the other competing techniques.
5.3 Real Data Experiments
Further Experiments
For a comprehensive performance evaluation of our proposed clustering algorithm in situations where the underlying data distributions are unknown, we implement DP-MoM on several real datasets from the Compcancer database and the UCI Repository. Additionally, we implement some state-of-the-art clustering algorithms mentioned at the start of this section on the same datasets and compare the corresponding ARI values against that of DP-MoM. Since DP-MoM is a randomized algorithm in the sense that its cluster assignment is dependent on the initial dataset partitioning into buckets, we implement DP-MoM on each dataset 35 times independently and report the median ARI. The same procedure is followed while reporting the ARI values for the competing algorithms. All the results have been summarized in Table 1 (UCI) and Table 2 (Compcancer). For every dataset, the entry corresponding to the algorithm that produced the highest median ARI among all the methods has been boldfaced. It should be noted that standard errors of ARI values across all experiments and all datasets turned out to be at most 0.05, and thus have been omitted from the tables for better readability.
Friedman's Rank Test
Friedman's rank test [Friedman, 1937] is employed to discern whether a significant difference exists in the performance of the algorithms applied to our datasets. This assessment unfolds across three stages. In the initial stage, the test encompasses all clustering algorithms under consideration. Moving to the second stage, the analysis omits DP-MoMwhile incorporating the other algorithms. In the third stage, both MoMPKM
| Description | State-of-the-Art Algorithms | DP-MoM | |||||||||||
|---|---|---|---|---|---|---|---|---|---|---|---|---|---|
| Dataset | n | p | K | KM++ | SKM | KMed | PAM | RCC | DPM | KbMoM | MoMPKM | OWL-KM | |
| Iris | 150 | 4 | 3 0.7237 | 0.7960 | 0.7515 | 0.6325 | 0.8090 | 0.7515 | 0.7565 | 0.8647 | 0.6339 | 0.9799 | |
| Glass | 214 | 9 | 7 0.3728 | 0.3595 | 0.3367 | 0.3501 | 0.3930 | 0.4472 | 0.3467 | 0.2484 | 0.2659 | 0.3190 | |
| WDBC | 569 | 30 | 2 0.4223 | 0.4223 | 0.4603 | 0.4587 | 0.4146 | 0.4479 | 0.4560 | 0.6839 | 0.5897 | 0.6798 | |
| E.Coli | 336 | 7 | 8 0.5001 | 0.4918 | 0.5346 | 0.5407 | 0.5350 | 0.6663 | 0.6216 | 0.4952 | 0.2174 | 0.7835 | |
| Wine | 178 | 13 | 3 0.4140 | 0.4287 | 0.4226 | 0.4189 | 0.3564 | 0.4094 | 0.4227 | 0.5518 | 0.3470 | 0.5820 | |
| Thyroid | 215 | 5 | 3 0.3936 | 0.2145 | 0.1450 | 0.2144 | 0.5186 | 0.4971 | 0.3032 | 0.5995 | 0.4392 | 0.8842 | |
| Zoo | 101 | 16 | 7 0.7376 | 0.7516 | 0.6730 | 0.6566 | 0.7173 | 0.8270 | 0.4978 | 0.7603 | 0.8408 | 0.8477 | |
| soybean | 47 | 35 | 4 0.7143 | 0.7138 | 0.7108 | 0.7437 | 0.8268 | 0.7368 | 0.82678 | 0.7417 | 0.5452 | 0.9533 | |
| Average Rank | 6.5625 | 6.1875 | 6.9375 | 6.5000 | 5.1875 | 4.6875 | 5.4375 | 4.2500 | 7.2500 | 2.0000 | |||
| Description | State-of-the-Art Algorithms | DP-MoM | |||||||||||
|---|---|---|---|---|---|---|---|---|---|---|---|---|---|
| Dataset | n | p | K | KM++ | SKM | KMed | PAM | RCC | DPM | KbMoM | MoMPKM | OWL-KM | |
| golub 1999 v2 | 72 | 1868 | 3 | 0.4334 | 0.6876 | 0.6116 | 0.7716 | 0.0000 | 0.6421 | 0.5664 | 0.6361 | 0.7438 | 0.7798 |
| west 2001 | 49 | 1198 | 2 | 0.1527 | 0.0002 | 0.0886 | 0.1058 | 0.0000 | 0.1715 | 0.3061 | 0.4761 | 0.5613 | 0.5035 |
| pomeroy 2002 v2 | 42 | 857 | 5 | 0.0000 | 0.4924 | 0.0000 | 0.0000 | 0.0000 | 0.0514 | 0.3583 | 0.4685 | 0.5175 | 0.5446 |
| singh 2002 | 102 | 339 | 2 | 0.0259 | 0.0330 | 0.0259 | 0.0330 | 0.0000 | 0.0574 | 0.0330 | 0.3433 | 0.0483 | 0.8135 |
| tomlins v2 | 92 | 1288 | 4 | 0.1418 | 0.1245 | 0.0100 | 0.2134 | 0.0000 | 0.1814 | 0.1730 | 0.2775 | 0.1993 | 0.3985 |
| alizadeh 2000 v1 | 42 | 1095 | 2 | 0.0127 | 0 .0000 | 0.0000 | 0.2564 | 0.0000 | 0.0023 | 0.0613 | 0.2714 | 0.0889 | 0.3716 |
| armstrong 2002 v2 | 72 | 2194 | 3 | 0.5123 | 0.5448 | 0.6625 | 0.4584 | 0.0000 | 0.4660 | 0.4992 | 0.6365 | 0.9186 | 0.8332 |
| bredel 2005 | 50 | 832 | 3 | 0.2000 | 0.3525 | 0.0098 | 0.4760 | 0.0000 | 0.0893 | 0.2315 | 0.4877 | 0.2996 | 0.5841 |
| Average Rank | 7.2500 | 6.0000 | 7.7500 | 5.3125 | 9.6875 | 5.8750 | 5.7500 | 3.1250 | 3.0000 | 1.2500 | |||
and DP-MoM are excluded from the test. The calculated p-values for these three stages are as follows: 1.57 × 10⁻⁷ , 0.0021, and 0.0599 respectively. The null hypothesis, which posits no significant variance in clustering accuracy among the tested algorithms, is rejected in the first and second stages, but accepted in the third stage. This outcome underscores that MoMPKM and DP-MoM emerge as the most proficient algorithms at our disposal. Further assessments indicate that MoMPKM is outperformed comprehensively by DP-MoM.
Sign Test and Wilcoxon Signed Rank (WSR) Test
We also perform the Sign Test and Wilcoxon Signed Rank Test to compare our proposed algorithm individually with every other competing algorithm mentioned in Tables 1 and 2 and check whether DP-MoM performs significantly better than each of the aforementioned state-of-the-art algorithms. It is evident from the p-values that the null hypotheses: H0s : The said algorithm is better than our proposed algorithm DP-MoM (Sign Test) and H0w : The said algorithm is equivalent to our proposed framework DP-MoM (Wilcoxon's signed Rank Test) are rejected in favor of the alternative H1 : DP-MoM performs significantly better than the other state-of-the-art clustering algorithm in question for a test with level of significance 0.01. In a majority of the cases, our proposed DP-MoM algorithm is the standout performer. However, in the 3 cases where its performance is slightly suboptimal with respect to that of MoMPKM and OWL k-means, the results of the statistical tests presented in Table 3, indicate that this drop in performance is not statistically significant at the specified level.
Tables 4 and 5 in the Supplementary Material provide the range of the penalty parameter λ that enables us to cluster each dataset more efficiently. The predicted number of clusters are also displayed. The number of clusters has been calculated after assigning the data points in the clusters containing less than 3 points, to the nearest cluster containing at least 3 points.
6 Discussion
In this article, we proposed a new clustering algorithm that integrates two major clustering paradigms, viz., centroid-based and model-based clustering and is intended to perform well on noisy or outlier-laden data. We utilize the Median-of-Means (MoM) estimator to deal with noise or outliers present in data, and Bayesian nonparametric modeling ensures that the number of clusters need not be specified. Unlike conventional clustering methods, which tackle only one of these challenges, our proposed algorithm adeptly tackles both at the same time. Following our comprehensive theoretical analysis of error rate bounds, augmented by extensive simulation studies and real-world data analysis, we showcase the superiority of our method against quite a few prominent clustering algorithms.
However, our proposed technique is not without its shortcomings; the parameter λ is notoriously hard to tune without resorting to grid searching using clustering efficiency. On the bright side, our technique works quite well even in the high-dimensional setting, and it might be fruitful to explore convergence results in this regime to further enhance its applicability and efficacy in the future.
Ethical Statement
There are no ethical issues.
Contribution Statement
Supratik Basu and Jyotishka Ray Choudhury contributed equally to this research.
@inproceedings{ijcai2025p531,
  title     = {Dirichlet Process-Based Robust Clustering Using the Median-of-Means Estimator},
  author    = {Basu, Supratik and Ray Choudhury, Jyotishka and Paul, Debolina and Das, Swagatam},
  booktitle = {Proceedings of the Thirty-Fourth International Joint Conference on
               Artificial Intelligence, {IJCAI-25}},
  publisher = {International Joint Conferences on Artificial Intelligence Organization},
  editor    = {James Kwok},
  pages     = {4770--4778},
  year      = {2025},
  month     = {8},
  note      = {Main Track},
  doi       = {10.24963/ijcai.2025/531},
  url       = {https://doi.org/10.24963/ijcai.2025/531},
}
TY - CPAPER TI - Dirichlet Process-Based Robust Clustering Using the Median-of-Means Estimator AU - Basu, Supratik AU - Ray Choudhury, Jyotishka AU - Paul, Debolina AU - Das, Swagatam T2 - Proceedings of the Thirty-Fourth International Joint Conference on Artificial Intelligence, IJCAI-25 PB - International Joint Conferences on Artificial Intelligence Organization PY - 2025 SP - 4770 EP - 4778 DO - 10.24963/ijcai.2025/531 UR - https://doi.org/10.24963/ijcai.2025/531 ER -Copied
Machine-readable versions of this paper, for tools and AI agents:





