
SpectralGap: Graph-Level Out-of-Distribution Detection via Laplacian Eigenvalue Gaps
Proceedings of the Thirty-Fourth International Joint Conference on Artificial Intelligence. Main Track. Pages 5244-5252.
https://doi.org/10.24963/ijcai.2025/584
Keywords
- Machine Learning: ML: Open-World/Open-Set/OOD Learning
Abstract
The task of graph-level out-of-distribution (OOD) detection is crucial for deploying graph neural networks in real-world settings. In this paper, we observe a significant difference in the relationship between the largest and second-largest eigenvalues of the Laplacian matrix for in-distribution (ID) and OOD graph samples: OOD samples often exhibit anomalous spectral gaps (the difference between the largest and second-largest eigenvalues). This observation motivates us to propose SpecGap, an effective post-hoc approach for OOD detection on graphs. SpecGap adjusts features by subtracting the component associated with the second-largest eigenvalue, scaled by the spectral gap, from the high-level features (i.e., X - (λn - λn-1) u_n-1 v_n-1^T). SpecGap achieves state-of-the-art performance across multiple benchmark datasets. We present extensive ablation studies and comprehensive theoretical analyses to support our empirical results. As a parameter-free post-hoc method, SpecGap can be easily integrated into existing graph neural network models without requiring any additional training or model modification.
- [Chung and Graham, 1997] Fan RK Chung and Fan Chung Graham. Spectral graph theory. Number 92. American Mathematical Soc., 1997.
- [Guo et al., 2023] Yuxin Guo, Cheng Yang, Yuluo Chen, Jixi Liu, Chuan Shi, and Junping Du. A data-centric framework to endow graph neural networks with out-of- distribution detection ability. In Proceedings of the 29th ACM SIGKDD Conference on Knowledge Discovery and Data Mining, pages 638-648, 2023.
- [Hamilton et al., 2017] Will Hamilton, Zhitao Ying, and Jure Leskovec. Inductive representation learning on large graphs. In Advances in neural information processing sys- tems, pages 1024-1034, 2017.
- [Hendrycks and Gimpel, 2016] Dan Hendrycks and Kevin Gimpel. A baseline for detecting misclassified and out-of- distribution examples in neural networks. In International Conference on Learning Representations, 2016.
- [Hoory et al., 2006] Shlomo Hoory, Nathan Linial, and Avi Wigderson. Expander graphs and their applications. Bul- letin of the American Mathematical Society, 43(4):439- 561, 2006.
- [Hu et al., 2020] Weihua Hu, Matthias Fey, Marinka Zitnik, Yuxiao Dong, Hongyu Ren, Bowen Liu, Michele Catasta, and Jure Leskovec. Open graph benchmark: Datasets for machine learning on graphs. Advances in neural informa- tion processing systems, 33:22118-22133, 2020.
- [Huang et al., 2024] Xinlei Huang, Zhiqi Ma, Dian Meng, Yanran Liu, Shiwei Ruan, Qingqiang Sun, Xubin Zheng, and Ziyue Qiao. Praga: Prototype-aware graph adaptive aggregation for spatial multi-modal omics analysis. In AAAI 2025, 2024.
- [Ji et al., 2023] Yuanfeng Ji, Lu Zhang, Jiaxiang Wu, Bingzhe Wu, Lanqing Li, Long-Kai Huang, Tingyang Xu, Yu Rong, Jie Ren, Ding Xue, et al. Drugood: Out-of- distribution dataset curator and benchmark for ai-aided drug discovery-a focus on affinity prediction problems with noise annotations. In Proceedings of the AAAI Con- ference on Artificial Intelligence, volume 37, pages 8023- 8031, 2023.
- [Ju et al., 2024] Wei Ju, Zheng Fang, Yiyang Gu, Zequn Liu, Qingqing Long, Ziyue Qiao, Yifang Qin, Jianhao Shen, Fang Sun, Zhiping Xiao, et al. A comprehensive survey on deep graph representation learning. Neural Networks, page 106207, 2024.
- [Kipf and Welling, 2016] Thomas N Kipf and Max Welling. Semi-supervised classification with graph convolutional networks. arXiv preprint arXiv:1609.02907, 2016.
- [Li et al., 2022] Zenan Li, Qitian Wu, Fan Nie, and Junchi Yan. Graphde: A generative framework for debiased learn- ing and out-of-distribution detection on graphs. Advances in Neural Information Processing Systems, 35:30277- 30290, 2022.
- [Liang et al., 2017] Shiyu Liang, Yixuan Li, and Rayadurgam Srikant. Enhancing the reliability of out-of-distribution image detection in neural networks. In International Conference on Learning Representations, 2017.
- [Liu et al., 2023] Yixin Liu, Kaize Ding, Huan Liu, and Shirui Pan. Good-d: On unsupervised graph out-of- distribution detection. In Proceedings of the Sixteenth ACM International Conference on Web Search and Data Mining, pages 339-347, 2023.
- [Liu et al., 2024] Yixin Liu, Kaize Ding, Qinghua Lu, Fuyi Li, Leo Yu Zhang, and Shirui Pan. Towards self- interpretable graph-level anomaly detection. Advances in Neural Information Processing Systems, 36, 2024.
- [Ma et al., 2022] Rongrong Ma, Guansong Pang, Ling Chen, and Anton van den Hengel. Deep graph-level anomaly de- tection by glocal knowledge distillation. In Proceedings of the fifteenth ACM international conference on web search and data mining, pages 704-714, 2022.
- [Maron et al., 2019] Haggai Maron, Heli Ben-Hamu, Hadar Serviansky, and Yaron Lipman. Provably powerful graph networks. Advances in neural information processing sys- tems, 32, 2019.
- [Mirakhorli et al., 2020] Jalal Mirakhorli, Hamidreza Amin- davar, and Mojgan Mirakhorli. A new method to predict anomaly in brain network based on graph deep learning. Reviews in the Neurosciences, 31(6):681-689, 2020.
- [Morris et al., 2020] Christopher Morris, Nils M Kriege, Franka Bause, Kristian Kersting, Petra Mutzel, and Mar- ion Neumann. Tudataset: A collection of bench- mark datasets for learning with graphs. arXiv preprint arXiv:2007.08663, 2020.
- [Qiao et al., 2023] Ziyue Qiao, Xiao Luo, Meng Xiao, Hao Dong, Yuanchun Zhou, and Hui Xiong. Semi-supervised domain adaptation in graph transfer learning. In Proceed- ings of the Thirty-Second International Joint Conference on Artificial Intelligence, pages 2279-2287, 2023. IJCAI
- [Qiao et al., 2024] Ziyue Qiao, Meng Xiao, Weiyu Guo, Xiao Luo, and Hui Xiong. Information filtering and in- terpolating for semi-supervised graph domain adaptation. Pattern Recognition, 153:110498, 2024.
- [Qiao et al., 2025] Ziyue Qiao, Junren Xiao, Qingqiang Sun, Meng Xiao, Xiao Luo, and Hui Xiong. Towards contin- uous reuse of graph models via holistic memory diversi- fication. In The Thirteenth International Conference on Learning Representations, 2025.
- [Qiu et al., 2022] Chen Qiu, Marius Kloft, Stephan Mandt, and Maja Rudolph. Raising the bar in graph-level anomaly detection. arXiv preprint arXiv:2205.13845, 2022. IJCAI
- [Shen et al., 2024] Xu Shen, Yili Wang, Kaixiong Zhou, Shirui Pan, and Xin Wang. Optimizing ood detection in molecular graphs: A novel approach with diffusion mod- els. In Proceedings of the 30th ACM SIGKDD Conference on Knowledge Discovery and Data Mining, pages 2640- 2650, 2024.
- [Veličković et al., 2017] Petar Veličković, Guillem Cucurull, Arantxa Casanova, Adriana Romero, Pietro Lio, and Yoshua Bengio. Graph attention networks. arXiv preprint arXiv:1710.10903, 2017.
- [Wang et al., 2024] Luzhi Wang, Dongxiao He, He Zhang, Yixin Liu, Wenjie Wang, Shirui Pan, Di Jin, and Tat-Seng Chua. Goodat: Towards test-time graph out-of-distribution detection. In Proceedings of the AAAI Conference on Arti- ficial Intelligence, volume 38, pages 15537-15545, 2024.
- [Wu et al., 2020] Zonghan Wu, Shirui Pan, Fengwen Chen, Guodong Long, Chengqi Zhang, and Philip S Yu. A com- prehensive survey on graph neural networks. IEEE trans- actions on neural networks and learning systems, 32(1):4- 24, 2020.
- [Wu et al., 2023] Qitian Wu, Yuxuan Chen, Chenghao Yang, and Junchi Yan. Energy-based out-of-distribution de- tection for graph neural networks. arXiv preprint arXiv:2302.02914, 2023.
- [Xia et al., 2021] Feng Xia, Ke Sun, Shuo Yu, Abdul Aziz, Liangtian Wan, Shirui Pan, and Huan Liu. Graph learning: A survey. IEEE Transactions on Artificial Intelligence, 2(2):109-127, 2021.
- [Xu et al., 2018] Keyulu Xu, Weihua Hu, Jure Leskovec, and Stefanie Jegelka. How powerful are graph neural net- works? arXiv preprint arXiv:1810.00826, 2018.
- [Yang et al., 2021] Jingkang Yang, Kaiyang Zhou, Yixuan Li, and Ziwei Liu. Generalized out-of-distribution detec- tion: A survey. arXiv preprint arXiv:2110.11334, 2021.
- [You et al., 2020] Yuning You, Tianlong Chen, Yongduo Sui, Ting Chen, Zhangyang Wang, and Yang Shen. Graph con- trastive learning with augmentations. Advances in neural information processing systems, 33:5812-5823, 2020.
- [You et al., 2021] Yuning You, Tianlong Chen, Yang Shen, and Zhangyang Wang. Graph contrastive learning auto- mated. In International Conference on Machine Learning, pages 12121-12132. PMLR, 2021.
- [Zhang et al., 2022] Ge Zhang, Zhenyu Yang, Jia Wu, Jian Yang, Shan Xue, Hao Peng, Jianlin Su, Chuan Zhou, Quan Z Sheng, Leman Akoglu, et al. Dual-discriminative graph neural network for imbalanced graph-level anomaly detection. Advances in Neural Information Processing Systems, 35:24144-24157, 2022.
- [Zhao and Akoglu, 2023] Lingxiao Zhao and Leman Akoglu. On using classification datasets to evaluate graph outlier detection: Peculiar observations and new insights. Big Data, 11(3):151-180, 2023.
References were extracted automatically from the PDF and may contain errors.
Full text extracted automatically from the PDF; figures, tables and equations may differ. The PDF is the version of record.
1 Introduction
Graph-structured data has become increasingly prevalent in various domains, including social networks, bioinformatics, and recommendation systems [Wu et al., 2020; Hamilton et al., 2017; Huang et al., 2024]. Graph Neural Networks (GNNs) have emerged as powerful tools for learning representations and making predictions on such data, achieving state-of-the-art performance in numerous tasks [Kipf and Welling, 2016; Veliˇckovi´c et al., 2017; Xia et al., 2021; Ju et al., 2024; Qiao et al., 2025]. However, as GNNs are increasingly deployed in real-world applications, ensuring their reliability and robustness becomes paramount. One critical challenge in this context is the detection of out-ofdistribution (OOD) samples at the graph level, which is essential for maintaining the integrity and trustworthiness of GNN-based systems [Liu et al., 2023; Ma et al., 2022; Qiao et al., 2023]. The importance of OOD detection in machine learning has been well-established in domains such as computer vision and natural language processing [Hendrycks and Gimpel, 2016; Liang et al., 2017; Zhang et al., 2022; Mirakhorli et al., 2020]. However, the unique characteristics of graph-structured data pose additional challenges for OOD detection. Unlike images or text, graphs exhibit complex structural properties and relational information that must be considered. Moreover, the potential for subtle distributional shifts in graph data can be more nuanced and difficult to detect using traditional methods [Qiao et al., 2024; Yang et al., 2021; Qiu et al., 2022].
∗Corresponding authors: Ziyue Qiao (ziyuejoe@gmail.com) and Zechao Li (zechao.li@njust.edu.cn).
Recent years have witnessed growing interest in graphlevel OOD detection, with researchers exploring various approaches. Contrastive learning-based methods have shown promise by leveraging the structural information of graphs [Li et al., 2022; Qiu et al., 2022; Liu et al., 2024], while energy-based models have demonstrated effectiveness in capturing the underlying data distribution [Wu et al., 2023; Shen et al., 2024]. Despite these advancements, existing methods often require significant modifications to GNN architectures or extensive additional training, limiting their practical applicability in real-world scenarios where model retraining may be costly or infeasible[Ji et al., 2023; Wang et al., 2024].
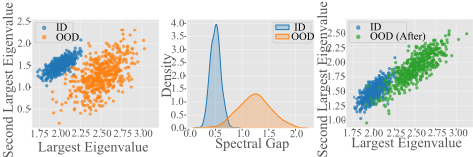
In this work, we present a novel perspective on graphlevel OOD detection by focusing on the spectral properties of graphs. Our key observation is a significant difference in the relationship between the largest and second-largest eigenvalues of the Laplacian matrix for in-distribution (ID) and OOD graph samples. As illustrated in Figure 1(a), OOD samples frequently exhibit anomalous spectral gaps - the difference between the largest and second-largest eigenvalues - compared to ID samples. This observation provides a strong intuition for OOD detection: the spectral gap reflects fundamental structural properties of a graph, such as its connectivity and community structure [Chung and Graham, 1997]. ID samples, which share similar structural characteristics, tend to have consistent spectral gaps. In contrast, OOD samples, with potentially different underlying generative processes, often display distinct spectral properties, manifesting as larger or more varied spectral gaps. This phenomenon can be attributed to the fact that the spectral gap is closely related to the mixing time of random walks on the graph and the graph's expansion properties [Hoory et al., 2006], which are likely to differ between ID and OOD samples.
Motivated by this insight, we propose SpecGap, an effective post-hoc approach for OOD detection on graphs. SpecGap leverages the observed spectral gap anomalies by adjusting the high-level features of a graph. Specifically, it subtracts the component associated with the second-largest eigenvalue, scaled by the spectral gap, from the high-level features. This adjustment effectively normalizes the spectral properties of OOD samples, bringing them closer to the distribution of ID samples, as demonstrated in Figure 1(c).
The proposed SpecGap method offers several key advantages:
- Theoretical Grounding: By focusing on fundamental spectral properties, SpecGap provides a theoretically grounded approach to OOD detection, offering insights into the structural differences between ID and OOD graphs.
- Ease of Integration: As a parameter-free post-hoc method, SpecGap can be seamlessly integrated into existing GNN models without requiring additional training or architectural modifications.
- Computational Efficiency: The method relies on efficient eigenvalue computations, making it suitable for large-scale graph datasets.
- State-of-the-Art Performance: Our extensive experiments demonstrate that SpecGap significantly outperforms existing methods, reducing the average false positive rate (FPR95) by 15.40% compared to the previous best approach.
In the following sections, we provide a detailed description of the SpecGap method, present comprehensive theoretical analyses to support our empirical findings, and demonstrate its effectiveness across multiple benchmark datasets. The implementation code will be released upon acceptance.
2 SpecGap: Spectral Gap-based OOD Detection
2.1 Preliminaries
Let G = (V, E) be an undirected graph with n vertices. The Laplacian matrix L of G is defined as:
where D is the degree matrix and A is the adjacency matrix of G. The degree matrix D is diagonal with Dii being the degree of vertex i, and the adjacency matrix A is defined as:
The Laplacian matrix L is symmetric and positive semidefinite, with n non-negative real eigenvalues 0 = λ1 ≤ λ2 ≤ ... ≤ λn. These eigenvalues provide crucial information about the graph's structure and connectivity.
The spectral gap, defined as ∆λ = λn - λn-1, plays a significant role in graph theory. Intuitively, the spectral gap represents the connectivity and expansion properties of the graph. A larger spectral gap indicates better connectivity and faster information diffusion within the graph. In the context of OOD detection, we hypothesize that in-distribution (ID) and out-of-distribution (OOD) samples may exhibit different spectral gap characteristics, reflecting fundamental differences in their underlying graph structures.
2.2 SpecGap Algorithm
Feature Adjustment
Given a high-level feature map X ∈ RC×HW from a Graph Neural Network (GNN), where C is the number of channels and H ×W is the spatial dimension, our SpecGap algorithm adjusts this feature based on the spectral properties of the graph it represents.
First, we compute the Laplacian matrix L of the original input graph. Then, we calculate its two largest eigenvalues λn and λn-1, along with the eigenvector un-1 corresponding to λn-1.
The spectral gap is computed as:
Next, we project the feature map X onto the subspace spanned by un-1:
Now, we adjust the feature map by subtracting the component associated with λn-1, scaled by the spectral gap:
This adjustment effectively removes the influence of the second-largest eigenvalue, which we hypothesize is more prominent in OOD samples. The scaling by ∆λ ensures that the adjustment is proportional to the spectral gap, which differs between ID and OOD samples.
Intuitively, this adjustment can be seen as "normalizing" the spectral properties of the graph. For OOD samples, which may have anomalous spectral gaps, this normalization brings their feature representations closer to those of ID samples, potentially making them easier to detect.
Integration into GNN Models
The adjusted feature map X′ is seamlessly integrated back into the GNN model. Specifically, X′ replaces the original feature map X in the subsequent layers of the network. The process can be formalized as:
where hl+1 is the output of the (l +1)-th layer, fl is the layer function, and A is the adjacency matrix.
This integration allows the SpecGap adjustment to influence the entire downstream processing of the GNN. The effect of this adjustment on the model's output can be significant: 1) Enhanced Discriminability: By normalizing the spectral properties, the adjusted features may become more discriminative between ID and OOD samples. 2) Improved Generalization: The spectral gap-based adjustment may help the model focus on more robust, graph-structural features, potentially improving generalization. 3) Calibrated Confidence: For OOD samples, the adjustment may lead to less overconfident predictions, as their anomalous spectral properties are mitigated.
Mathematically, we can express the impact on the model's output y as:
where g is the final classification layer and L is the total number of layers.
The SpecGap adjustment essentially modifies the feature space in which the GNN operates, potentially creating a more suitable space for distinguishing between ID and OOD samples. This modification is based on fundamental graph properties, making it a theoretically grounded approach to improving OOD detection in GNNs.
2.3 Efficient Computation of Spectral Gap
Lanczos Algorithm
To efficiently compute the two largest eigenvalues λn and λn-1 of the Laplacian matrix L, we employ the Lanczos algorithm. This iterative algorithm is particularly effective for large, sparse matrices, making it well-suited for graph Laplacians. The Lanczos algorithm builds an orthonormal basis for the Krylov subspace:
where v is an initial vector, typically chosen randomly. The algorithm proceeds by iteratively constructing a sequence of orthonormal vectors {qj}kj=1 and scalars {αj}kj=1 and {βj }k-1 j=1 . At each iteration, the algorithm computes:
This process generates a tridiagonal matrix Tk ∈ Rk×k :
The eigenvalues of Tk approximate the extreme eigenvalues of L. Specifically, the largest eigenvalue of Tk converges to λn, and the second largest to λn-1. Regarding convergence, the error in the j-th Ritz value θj (an approximation to an eigenvalue) is bounded by:
where C is a constant. This bound demonstrates that the convergence is faster when the eigenvalues are well-separated.
The computational complexity of the Lanczos algorithm is O(k·nnz(L)), where k is the number of iterations and nnz(L) is the number of non-zero elements in L. For sparse graphs, this is significantly more efficient than full eigendecomposition.
Implementation Details
The implementation of the Lanczos algorithm requires careful consideration of numerical stability and efficiency. We initialize q1 as a random unit vector, computed by normalizing a vector of random numbers drawn from a standard normal distribution:
The matrix-vector product Lqj is computed efficiently by leveraging the sparsity of the Laplacian matrix:
where D and A are the degree and adjacency matrices, respectively. To maintain numerical stability, we perform full reorthogonalization after each iteration:
where Qj = [q1, ..., qj]. The eigenvalues of the tridiagonal matrix Tk are computed using a stable method such as the QR algorithm. The two largest eigenvalues of Tk serve as our approximations for λn and λn-1.
The iteration process continues until the change in the estimated eigenvalues falls below a predetermined threshold ϵ:
where λ(k) n and λ(k) n-1 are the estimates at the k-th iteration.
By implementing these details, we can efficiently and stably compute the spectral gap ∆λ = λn -λn-1 for use in our SpecGap algorithm, even for large graphs.
3 Experiments
To comprehensively evaluate the effectiveness of the SpecGap method, we have designed a series of experiments. This section will detail the experimental setup, main results analysis, and in-depth ablation studies.
3.1 Experimental Setup
Datasets
Our experiments utilize five pairs of datasets, representing indistribution (ID) and out-of-distribution (OOD) data respectively. These pairs are selected from the TU datasets[Morris et al., 2020] and Open Graph Benchmark (OGB)[Hu et al., 2020], covering molecular, social network, and bioinformatics domains. Each pair belongs to the same field but exhibits a mild domain shift, providing an ideal testbed for OOD detection. We follow the dataset split strategy from previous works[Liu et al., 2023]: 80% of ID graphs for training, and the remaining 20% split equally between validation and test sets. These latter sets are augmented with an equal number of OOD graphs, creating a realistic and challenging evaluation scenario.
Baselines and Our Method
Our experiments include several baseline methods, categorized into unsupervised and supervised approaches. The unsupervised baselines are GCL[You et al., 2020] and JOAO[You et al., 2021], while the supervised ones are GIN[Xu et al., 2018] and PPGN[Maron et al., 2019]. We also compare our method with state-of-the-art OOD detection methods, including AAGOD[Guo et al., 2023], GOODD[Liu et al., 2023], OCGIN[Zhao and Akoglu, 2023], and GLocalKD[Ma et al., 2022]. Our proposed method, SpecGap, is applied to all these baseline methods as well as AAGOD to demonstrate its versatility and effectiveness as a post-processing technique.
Evaluation Metrics
To ensure a comprehensive evaluation, we employ three widely-used metrics in OOD detection tasks: Area Under the Receiver Operating Characteristic Curve (AUC), Area Under the Precision-Recall Curve (AUPR), and False Positive Rate at 95% True Positive Rate (FPR95). These metrics provide a holistic view of the method's performance across different operating points.
Implementation Details
In our implementation, SpecGap is applied to the final layer's feature map of the GNN models. This choice allows us to leverage the most abstract and task-relevant features learned by the network. For Graph Transformer architectures, we apply SpecGap after the self-attention layer, enabling it to refine the attention-weighted features. This consistent application across different architectures demonstrates the flexibility and generality of our approach.
3.2 Main Results
To evaluate the effectiveness of SpecGap, we conduct experiments on various well-trained GNNs, including unsupervised methods (GCL, JOAO) and supervised methods (GIN, PPGN). We used the SSD/LOF scoring function from [Guo et al., 2023] to enable these baseline methods to have OOD detection capabilities.Tables 1 and 2 present the results on unsupervised and supervised GNNs, respectively.The results in Tables 1 and 2 demonstrate the superior performance of SpecGap across various GNN architectures and datasets.
The substantial and consistent performance improvements achieved by SpecGap across a diverse range of graph neural network architectures and datasets. SpecGap's effectiveness is particularly evident in its ability to significantly enhance OOD detection capabilities, as reflected by the marked increases in AUC and AUPR scores, coupled with notable reductions in FPR95 values. For instance, when applied to the GCL S model on the BZR/COX2 dataset pair, SpecGap elevates the AUC from 75.00% to an impressive 98.56%, while simultaneously reducing the FPR95 from 47.50% to a mere 12.69%. This dramatic improvement underscores SpecGap's prowess in refining the feature space to accentuate the distinctions between in-distribution and out-of-distribution samples. The method's efficacy is further corroborated by its performance on challenging cases, such as improving the AUC of GIN S on the IMDBM/IMDBB pair from 42.05% to 60.77%, demonstrating its ability to extract meaningful signals even in scenarios where baseline methods struggle.
SpecGap's consistent performance across both unsupervised (GCL, JOAO) and supervised (GIN, PPGN) architectures, as well as its compatibility with different scoring functions (SSD and LOF), highlights its versatility and robustness as a post-processing technique. The method's success can be attributed to its novel approach of leveraging spectral properties, particularly the spectral gap, to capture and amplify structural differences between ID and OOD graphs. This spectral-based feature adjustment effectively normalizes the feature representations, bringing OOD samples closer to the ID distribution in the feature space, thereby facilitating more accurate detection. The observed improvements across various graph types, including molecular (e.g., TOX21/SIDER with AUC increase from 68.04% to 73.41% for GCL S), social network (IMDBM/IMDBB), and bioinformatics (ENZYMES/PROTEIN) datasets, underscore SpecGap's generalizability and its potential for wide-ranging applications in graph-based machine learning tasks.
Comparison with Other OOD Detection Methods
The experimental results demonstrate that SpecGap consistently outperforms existing state-of-the-art graph OOD detection methods across various datasets, showcasing its effectiveness as a post-processing technique. To rigorously evaluate SpecGap's performance, we conducted a comparative analysis against several prominent graph OOD detection methods: AAGOD, OCGIN, GLocalKD, and GOOD-D. For this comparison, AAGOD was implemented using the JOAO architecture with the SSD scoring function, establishing a robust baseline. SpecGap, being a post-processing method, was applied to each of these methods to assess its universal applicability and potential for performance enhancement.
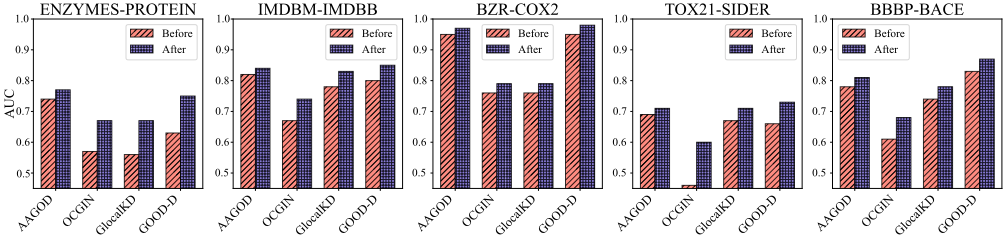
Figure 2 presents the AUC scores of these methods across five dataset pairs, both before and after the application of SpecGap. The results reveal a consistent pattern of improvement, with SpecGap enhancing the performance of all methods across all datasets. This uniform uplift in AUC scores underscores SpecGap's ability to extract and utilize complementary information from the graph structure. The magnitude of improvement varies across methods and datasets, reflecting the complex interplay between SpecGap, the base methods, and the underlying data distributions. Notably, SpecGap's enhancements are not limited to underperforming methods; even high-performing algorithms like GOOD-D see non-trivial improvements in certain datasets. This observation suggests that SpecGap captures fundamental graph properties that are not fully exploited by existing techniques.
| ID | OOD | Metric | GCLS | GCLL | JOAOS | JOAOL | ||||
|---|---|---|---|---|---|---|---|---|---|---|
| Original | +SpecGap | Original | +SpecGap | Original | +SpecGap | Original | +SpecGap | |||
| ENZYMES | PROTEIN | AUC↑ AUPR↑ FPR95↓ | 62.97 62.47 93.33 | 75.24 77.03 74.77 | 62.56 65.45 93.30 | 69.50 67.14 71.95 | 61.20 61.30 90.00 | 76.67 79.41 69.09 | 59.68 64.16 96.67 | 67.42 66.42 71.95 |
| IMDBM | IMDBB | AUC↑ AUPR↑ FPR95↓ | 80.52 74.43 38.67 | 85.52 82.16 32.43 | 61.08 59.52 96.67 | 70.70 70.07 77.29 | 80.40 74.70 44.70 | 84.45 79.32 35.53 | 48.25 47.88 98.00 | 66.25 63.47 79.54 |
| AUC↑ AUPR↑ | 75.00 62.41 | 98.56 98.52 | 34.69 39.07 | 67.25 64.78 | 80.00 67.10 | 96.75 95.78 | 41.80 56.70 | 67.94 69.24 | ||
| BZR | COX2 | FPR95↓ | 47.50 | 12.69 | 92.50 | 67.68 | 37.50 | 10.58 | 97.50 | 82.46 |
| 60.00 | ||||||||||
| AUC↑ | 68.04 | 73.41 | 53.44 | 53.46 | 71.47 | 53.64 | 57.34 57.70 | |||
| TOX21 | SIDER | AUPR↑ | 69.28 90.42 | 75.73 75.74 | 56.81 94.25 | 61.37 78.44 | 56.02 | 73.14 76.61 | 56.02 95.66 | |
| 77.07 | 82.46 | 52.05 | 43.96 | |||||||
| FPR95↓ | 95.66 | 75.85 | ||||||||
| AUC↑ | 46.74 | 75.48 | 80.32 | 52.82 | ||||||
| BBBP | BACE | AUPR↑ | 68.41 | 74.41 | 45.35 | 47.88 | 69.32 | 75.91 | 44.77 | 49.77 |
| FPR95↓ | 71.92 | 51.26 | 92.12 | 73.35 | 76.85 | 58.76 | 94.09 | 78.35 | ||
| ID | OOD | Metric | GINS | GINL | PPGNS | PPGNL | ||||
|---|---|---|---|---|---|---|---|---|---|---|
| Original | +SpecGap | Original | +SpecGap | Original | +SpecGap | Original | +SpecGap | |||
| ENZYMES | PROTEIN | AUC↑ AUPR↑ FPR95↓ | 52.22 50.41 93.33 | 68.21 60.57 62.04 | 58.44 53.82 90.00 | 67.87 60.80 70.50 | 53.89 54.06 80.00 | 68.67 67.67 67.68 | 52.56 51.21 100.00 | 65.21 59.29 70.50 |
| IMDBM | IMDBB | AUC↑ AUPR↑ FPR95↓ | 42.05 44.43 100.00 | 60.77 59.55 76.71 | 57.24 54.41 87.17 | 64.58 64.08 80.37 | 40.62 43.41 96.43 | 61.03 56.69 72.05 | 47.90 50.06 89.67 | 57.31 54.34 75.58 |
| BZR | AUC↑ AUPR↑ | 35.25 39.61 | 79.05 68.31 | 60.75 | 78.28 65.08 | 62.75 57.15 | 73.90 81.31 | 65.00 62.14 | 74.42 79.92 | |
| COX2 | FPR95↓ | 100.00 | 59.22 | 53.71 95.00 | 38.07 | 65.00 | 76.14 | |||
| 80.00 | 80.37 | |||||||||
| AUC↑ | 63.73 | 66.19 | 51.47 | 59.32 | 36.98 | 63.08 | 54.61 | 56.65 | ||
| TOX21 | SIDER | AUPR↑ | 63.79 | 69.37 | 58.25 | 59.65 | ||||
| 52.33 | 43.55 | 59.90 | 53.91 | |||||||
| FPR95↓ | 83.78 | 79.41 | 96.93 | 78.12 | 97.45 | 69.98 | 94.38 | 82.55 | ||
| AUC↑ | 64.58 | 69.83 | 43.54 | 58.84 | 30.79 | 72.31 | 47.55 | 58.67 | ||
| BBBP | BACE | AUPR↑ | 58.39 | 63.77 | 43.80 | 55.74 | 44.06 | 76.80 | 49.71 | 59.70 |
| FPR95↓ | 87.68 | 76.68 | 91.63 | 77.93 | 97.56 | 66.03 | 100.00 | 75.11 | ||
3.3 Ablation Studies
Component Analysis
To thoroughly investigate the effectiveness of our proposed SpecGap method, we conducted comprehensive ablation studies on its key components. These studies focus on three critical aspects: comparison of different spectral gap adjustment techniques, the impact of feature adjustment methods, and the influence of using varying numbers of largest eigenvalues. Our experiments were performed on the ENZYMESPROTEIN dataset using the GCL model with the SSD scoring function (GCLS) as the base architecture.
The choice of spectral gap adjustment technique proves to be crucial for the performance of SpecGap, with our proposed method outperforming alternative approaches. Table 3 presents the comparison of different spectral gap adjustment techniques. We evaluated four approaches: no adjustment (original GCLS), simple subtraction (λn-λn-1), relative difference ((λn - λn-1)/λn), and our proposed method (scaled subtraction). Our proposed scaled subtraction method outperforms the alternatives across all evaluation metrics. The improvement is particularly notable in the AUC and AUPR
| Adjustment Technique | AUC | AUPR | FPR95 |
|---|---|---|---|
| No Adjustment (Original) | 62.97 | 62.47 | 93.33 |
| Simple Subtraction | 68.35 | 69.82 | 85.21 |
| Relative Difference | 71.56 | 73.19 | 79.68 |
| Scaled Subtraction (SpecGap) | 75.24 | 77.03 | 74.77 |
| Feature Adjustment Method | AUC | AUPR | FPR95 |
|---|---|---|---|
| Concatenation | 69.83 | 71.25 | 84.56 |
| Multiplication | 72.61 | 74.38 | 79.92 |
| Subtraction (SpecGap) | 75.24 | 77.03 | 74.77 |
scores, with increases of 19.5% and 23.3% respectively compared to the original model. This significant enhancement can be attributed to the method's ability to effectively capture and emphasize the structural differences between indistribution and out-of-distribution graphs. The simple subtraction method, while showing some improvement over the original model, falls short of our proposed approach.
The method of incorporating the spectral gap information into the graph features significantly influences the performance of SpecGap. We compared three feature adjustment methods: concatenation, multiplication, and our proposed subtraction method. Table 4 presents the results of this comparison. Our proposed subtraction method consistently outperforms both alternative techniques across all evaluation metrics. The concatenation method, while providing additional information, fails to effectively emphasize the structural differences captured by the spectral gap. This results in only modest improvements over the original model. The multiplication method shows better performance, likely due to its ability to scale features based on the spectral gap. However, it may overly amplify or diminish certain features, leading to suboptimal results.
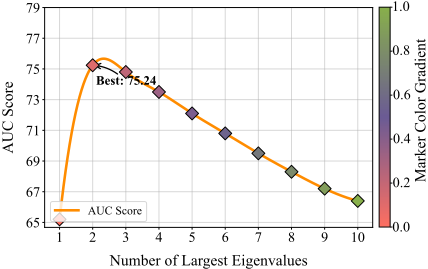
The number of largest eigenvalues used in SpecGap significantly impacts its performance, with an optimal range identified for best results. Figure 3 illustrates the impact of using different numbers of largest eigenvalues on the OOD detection performance. We varied the number of eigenvalues from 1 to 10 and measured the resulting AUC scores. The results reveal a clear trend: performance initially improves as more eigenvalues are incorporated, reaches a peak at 2 eigenvalues (which corresponds to our proposed method using the spectral gap), and then gradually declines. This pattern suggests that while the largest eigenvalues contain crucial structural information for OOD detection, incorporating too many may introduce noise or redundant information that dilutes the discriminative power of the spectral features. The sharp increase in performance from using just one eigenvalue to using two (i.e., considering the spectral gap) underscores the importance of capturing this specific aspect of the graph's spectral properties. The subsequent decline in performance when using more eigenvalues indicates that the most relevant structural information for OOD detection is concentrated in the spectral gap.
Feature Adjustment Position
The position of SpecGap application within the GNN architecture significantly impacts its effectiveness, with earlier layers generally yielding better performance. Table 5 presents the OOD detection performance of SpecGap when applied at different positions in a 3-layer GCL model on the Table 6: Performance comparison of SpecGap using different Laplacian matrix variants on the BZR-COX2 dataset with the GCLS model.
| Application Position | AUC | AUPR | FPR95 |
| After 1st Layer | 75.24 | 77.03 | 74.77 |
|---|---|---|---|
| After 2nd Layer | 73.18 | 75.42 | 77.56 |
| After 3rd Layer | 71.95 | 73.89 | 79.32 |
| Output Layer | 70.62 | 72.51 | 81.05 |
| Laplacian Variant | AUC | AUPR | FPR95 |
| Unnormalized | 95.82 | 95.73 | 17.54 |
|---|---|---|---|
| Normalized | 98.56 | 98.52 | 12.69 |
| Signless | 94.17 | 94.05 | 19.86 |
ENZYMES-PROTEIN dataset. The results demonstrate that applying SpecGap after the first layer consistently outperforms applications at later layers or the output layer. The superior performance of early-layer application can be attributed to the enhancement of global structural information captured by the spectral gap. By applying SpecGap in the early layers, we allow the subsequent layers to learn more discriminative representations based on the adjusted spectral properties of the graph.
Laplacian Matrix Variants
The choice of Laplacian matrix variant in SpecGap significantly influences OOD detection performance, with the normalized Laplacian generally yielding the best results. Table 6 compares the performance of SpecGap using different Laplacian matrix variants on the BZR-COX2 dataset with the GCLS model. The variants considered are the unnormalized Laplacian, normalized Laplacian, and signless Laplacian. The normalized Laplacian consistently outperforms other variants across all metrics. This superior performance can be attributed to its invariance to graph scale and its ability to capture both local and global graph properties effectively. The normalized Laplacian's spectral gap provides a more informative measure of graph connectivity and community structure, which is crucial for distinguishing between in-distribution and out-of-distribution samples.The unnormalized Laplacian, while still effective, shows slightly lower performance compared to its normalized counterpart. This may be due to its sensitivity to graph size, which can introduce unwanted variability in the spectral gap calculation for graphs of different scales.
Feature Projection Methods
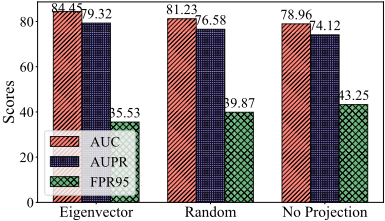
The choice of feature projection method in SpecGap plays a crucial role in its effectiveness, with eigenvector-based projection demonstrating superior performance. Figure 4 illustrates the performance of different feature projection methods in SpecGap on the IMDBM-IMDBB dataset using the JOAOS model. We compare three projection methods: eigenvector-based, random projection, and no projection (direct feature adjustment). The eigenvector-based projection method consistently outperforms the alternatives across all evaluation metrics. This superior performance can be attributed to its ability to align the feature adjustment with the principal directions of variation in the graph structure, as captured by the eigenvectors of the Laplacian matrix. Random projection, while showing some improvement over no projection, falls short of the eigenvector-based method. This suggests that while dimensionality reduction can be beneficial, the specific structure preserved by eigenvector projection is particularly valuable for OOD detection.The no projection method, which directly adjusts features without any projection, shows the lowest performance.
4 Conclusion
This paper introduces SpecGap, a novel theoretical and empirical framework for graph-level out-of-distribution (OOD) detection using spectral properties. Our key contributions include: (1) A parameter-free post-processing technique that leverages spectral gaps to enhance OOD detection, showing consistent improvements across multiple benchmark datasets and model architectures; (2) A rigorous theoretical foundation demonstrating how spectral gaps reflect fundamental structural differences between ID and OOD graphs; and (3) Comprehensive empirical analyses through extensive experiments and ablation studies that validate our theoretical findings. Our theoretical analysis reveals that the spectral gap serves as a robust structural signature, supported by formal proofs of distribution-level separation gains and connections to classical graph theory. The experimental results demonstrate significant performance improvements, with SpecGap reducing the average false positive rate (FPR95) by 15.40% compared to previous methods.
While SpecGap shows promising results, several important directions remain for future research. First, scalability to very large graphs could be further improved through more efficient eigenvalue computation techniques or approximation methods. Second, investigating the method's robustness under adversarial perturbations and developing theoretical guarantees for such scenarios would strengthen its reliability for applications. Finally, exploring the integration of SpecGap with other graph learning tasks beyond OOD detection.
Acknowledgments
The work is partially supported by the National Natural Science Foundation of China (Grant No. 62406056, 62425603), the Guangdong Basic and Applied Basic Research Foundation (Grant No.2024A1515140114), the Basic Research Program of Jiangsu Province (Grant No. BK20240011), and Guangdong Research Team for Communication and Sensing Integrated with Intelligent Computing (Project No. 2024KCXTD047). The computational resources are supported by SongShan Lake HPC Center (SSL-HPC) in Great Bay University.
@inproceedings{ijcai2025p584,
  title     = {SpectralGap: Graph-Level Out-of-Distribution Detection via Laplacian Eigenvalue Gaps},
  author    = {Gu, Jiawei and Qiao, Ziyue and Li, Zechao},
  booktitle = {Proceedings of the Thirty-Fourth International Joint Conference on
               Artificial Intelligence, {IJCAI-25}},
  publisher = {International Joint Conferences on Artificial Intelligence Organization},
  editor    = {James Kwok},
  pages     = {5244--5252},
  year      = {2025},
  month     = {8},
  note      = {Main Track},
  doi       = {10.24963/ijcai.2025/584},
  url       = {https://doi.org/10.24963/ijcai.2025/584},
}
TY - CPAPER TI - SpectralGap: Graph-Level Out-of-Distribution Detection via Laplacian Eigenvalue Gaps AU - Gu, Jiawei AU - Qiao, Ziyue AU - Li, Zechao T2 - Proceedings of the Thirty-Fourth International Joint Conference on Artificial Intelligence, IJCAI-25 PB - International Joint Conferences on Artificial Intelligence Organization PY - 2025 SP - 5244 EP - 5252 DO - 10.24963/ijcai.2025/584 UR - https://doi.org/10.24963/ijcai.2025/584 ER -Copied
Machine-readable versions of this paper, for tools and AI agents:





