
Transferable Relativistic Predictor: Mitigating Cross-Task Cold-Start Issue in NAS
Proceedings of the Thirty-Fourth International Joint Conference on Artificial Intelligence. Main Track. Pages 5625-5633.
https://doi.org/10.24963/ijcai.2025/626
Keywords
- Machine Learning: ML: Knowledge-aided learning
- Machine Learning: ML: Evaluation
Abstract
In neural architecture search (NAS), the relativistic predictor has recently emerged as an attractive technique to solve ranking issue for performance evaluation by predicting the relativistic ranking of architecture pair rather than the absolute performance of an architecture. However, it suffers from a significant cold-start issue, requiring a large amount of evaluated architectures to train an effective predictor on new datasets. In this paper, we propose a transferable relativistic predictor (TRP). Specifically, we construct a proxy dataset using the transferable cheaper-to-obtain performance estimation to softly label the rank between architectural pairs. The soft label with a smooth and easy-to-optimize loss function facilitates the learning of expressive and generalizable representations on the proxy dataset. Furthermore, we construct Chebyshev interpolation for correlation curve to adaptively determine the number of evaluated architectures required on each dataset. Extensive experimental results in different search spaces show the superior performance of TRP compared with state-of-the-art predictors. TRP requires only 54 and 73 evaluated architectures for a warm start on the CIFAR-10 and CIFAR-100 under the DARTS search space.
- [Bergstra and Bengio, 2012] James Bergstra and Yoshua Bengio. Random search for hyper-parameter optimization. JMLR, 2012.
- [Chen et al., 2020] Xin Chen, Yawen Duan, Zewei Chen, and Hang Xu. Catch: Context-based meta reinforcement learning for transferrable architecture search. In Proc. of ECCV, 2020.
- [Chen et al., 2021a] Wuyang Chen, Xinyu Gong, and Zhangyang Wang. Neural architecture search on imagenet in four gpu hours: A theoretically inspired perspective. In Proc. of ICLR, 2021.
- [Chen et al., 2021b] Yaofo Chen, Yong Guo, Qi Chen, and Minli Li. Contrastive neural architecture search with neu- ral architecture comparators. In Proc. of CVPR, 2021.
- [Chen et al., 2021c] Ziye Chen, Yibing Zhan, Baosheng Yu, Mingming Gong, and Bo Du. Not all operations contribute equally: Hierarchical operation-adaptive predictor for neu- ral architecture search. In Proc. of ICCV, 2021.
- [Chen et al., 2024] Wuyang Chen, Xinyu Gong, Junru Wu, and Yunchao Wei. Understanding and accelerating neural architecture search with training-free and theory-grounded metrics. IEEE TPAMI, 2024.
- [Dong and Yang, 2019a] Xuanyi Dong and Yi Yang. One- shot neural architecture search via self-evaluated template network. In Proc. of CVPR, 2019.
- [Dong and Yang, 2019b] Xuanyi Dong and Yi Yang. Search- ing for a robust neural architecture in four gpu hours. In Proc. of CVPR, 2019.
- [Dong and Yang, 2020] Xuanyi Dong and Yi Yang. Nas- bench-201: Extending the scope of reproducible neural ar- chitecture search. In Proc. of ICLR, 2020.
- [Dong et al., 2024] Peijie Dong, Lujun Li, Xinglin Pan, and Zimian Wei. Parzc: Parametric zero-cost proxies for effi- cient nas. arXiv preprint arXiv:2402.02105, 2024.
- [Duan et al., 2021] Yawen Duan, Xin Chen, and Hang Xu. Transnas-bench-101: Improving transferability and gener- alizability of cross-task neural architecture search. In Proc. of CVPR, 2021.
- [Elsken et al., 2019] Thomas Elsken, Jan Hendrik Metzen, and Frank Hutter. Neural architecture search: A survey. JMLR, 2019.
- [Falkner et al., 2018] Stefan Falkner, Aaron Klein, and Frank Hutter. Bohb: Robust and efficient hyperparame- ter optimization at scale. In Proc. of ICML, 2018.
- [Guo et al., 2024] Bicheng Guo, Lilin Xu, Tao Chen, and Peng Ye. Latency-aware neural architecture performance predictor with query-to-tier technique. IEEE TCSVT, 2024.
- [He et al., 2016] Kaiming He, Xiangyu Zhang, Shaoqing Ren, and Jian Sun. Deep residual learning for image recog- nition. In Proc. of CVPR, 2016.
- [Hu et al., 2021] Chi Hu, Chenglong Wang, Xiangnan Ma, and Xia Meng. Ranknas: Efficient neural architecture search by pairwise ranking. In Proc. of EMNLP, 2021.
- [Huang et al., 2022] Minbin Huang, Zhijian Huang, and Changlin Li. Arch-graph: Acyclic architecture relation predictor for task-transferable neural architecture search. In Proc. of CVPR, 2022.
- [Huang et al., 2024] Yi-Cheng Huang, Wei-Hua Li, Chih- Han Tsou, Jun-Cheng Chen, and Chu-Song Chen. Up- nas: Unified proxy for neural architecture search. In Proc. of CVPR, 2024.
- [Ji et al., 2024] Han Ji, Yuqi Feng, and Yanan Sun. Cap: A context-aware neural predictor for nas. In Proc. of IJCAI, 2024. IJCAI
- [Krishnakumar et al., 2022] Arjun Krishnakumar, Colin White, and Arber Zela. Nas-bench-suite-zero: Acceler- ating research on zero cost proxies. In Proc. of NeurIPS, 2022.
- [Lee et al., 2018] Namhoon Lee, Thalaiyasingam Ajanthan, and Philip Torr. Snip: Single-shot network pruning based on connection sensitivity. In Proc. of ICLR, 2018.
- [Li et al., 2024] Guihong Li, Duc Hoang, and Kartikeya Bhardwaj. Zero-shot neural architecture search: Chal- lenges, solutions, and opportunities. IEEE TPAMI, 2024.
- [Liu et al., 2018a] Chenxi Liu, Barret Zoph, Maxim Neu- mann, Jonathon Shlens, Wei Hua, Li-Jia Li, Li Fei-Fei, Alan Yuille, Jonathan Huang, and Kevin Murphy. Progres- sive neural architecture search. In Proc. of ECCV, 2018.
- [Liu et al., 2018b] Hanxiao Liu, Karen Simonyan, and Yim- ing Yang. Darts: Differentiable architecture search. In Proc. of ICLR, 2018.
- [Liu et al., 2021] Yuqiao Liu, Yehui Tang, and Yanan Sun. Homogeneous architecture augmentation for neural pre- dictor. In Proc. of ICCV, 2021.
- [Lopes and Alexandre, 2023] Vasco Lopes and Luís A Alexandre. Toward less constrained macro-neural archi- tecture search. IEEE TNNLS, 2023.
- [Lu et al., 2021a] Shun Lu, Jixiang Li, Jianchao Tan, Sen Yang, and Ji Liu. Tnasp: A transformer-based nas predic- tor with a self-evolution framework. In Proc. of NeurIPS, 2021.
- [Lu et al., 2021b] Shun Lu, Jixiang Li, Jianchao Tan, Sen Yang, and Ji Liu. Tnasp: A transformer-based nas pre- dictor with a self-evolution framework. Proc. of NeurIPS, 2021.
- [Lu et al., 2023] Shun Lu, Yu Hu, Peihao Wang, Yan Han, Jianchao Tan, Jixiang Li, Sen Yang, and Ji Liu. Pinat: A permutation invariance augmented transformer for nas predictor. In Proc. of AAAI, 2023.
- [Luo et al., 2018] Renqian Luo, Fei Tian, Tao Qin, Enhong Chen, and Tie-Yan Liu. Neural architecture optimization. Proc. of NeurIPS, 2018.
- [Luo et al., 2020] Renqian Luo, Xu Tan, Rui Wang, Tao Qin, Enhong Chen, and Tie-Yan Liu. Semi-supervised neural architecture search. In Proc. of NeurIPS, 2020.
- [Ma et al., 2024] Lianbo Ma, Haidong Kang, Guo Yu, Qing Li, and Qiang He. Single-domain generalized predictor for neural architecture search system. IEEE TC, 2024.
- [Mellor et al., 2021] Joe Mellor, Jack Turner, Amos Storkey, and Elliot J Crowley. Neural architecture search without training. In Proc. of ICML, 2021.
- [Ning et al., 2020] Xuefei Ning, Yin Zheng, Tianchen Zhao, Yu Wang, and Huazhong Yang. A generic graph-based neural architecture encoding scheme for predictor-based nas. In Proc. of ECCV, pages 189-204, 2020.
- [Ning et al., 2021] Xuefei Ning, Changcheng Tang, and Wenshuo Li. Evaluating efficient performance estimators of neural architectures. In Proc. of NeurIPS, 2021.
- [Pham et al., 2018] Hieu Pham, Melody Guan, Barret Zoph, Quoc Le, and Jeff Dean. Efficient neural architecture search via parameters sharing. In Proc. of ICML, 2018.
- [Real et al., 2019] Esteban Real, Alok Aggarwal, Yanping Huang, and Quoc V Le. Regularized evolution for image classifier architecture search. In Proc. of AAAI, 2019.
- [Rivlin, 2020] Theodore J Rivlin. Chebyshev polynomials. Courier Dover Publications, 2020.
- [Saberian and Vasconcelos, 2011] Mohammad Saberian and Nuno Vasconcelos. Multiclass boosting: Theory and algo- rithms. Proc. of NeurIPS, 2011.
- [Schulman et al., 2017] John Schulman, Filip Wolski, Pra- fulla Dhariwal, Alec Radford, and Oleg Klimov. Prox- imal policy optimization algorithms. arXiv preprint arXiv:1707.06347, 2017.
- [Shen et al., 2023] Yu Shen, Yang Li, Jian Zheng, and Wen- tao Zhang. Proxybo: Accelerating neural architecture search via bayesian optimization with zero-cost proxies. In Proc. of AAAI, 2023.
- [Shi et al., 2020] Han Shi, Renjie Pi, Hang Xu, Zhenguo Li, James Kwok, and Tong Zhang. Bridging the gap between sample-based and one-shot neural architecture search with bonas. Proc. of NeurIPS, 2020.
- [Tanaka et al., 2020] Hidenori Tanaka, Daniel Kunin, Daniel L Yamins, and Surya Ganguli. Pruning neural networks without any data by iteratively conserving synaptic flow. In Proc. of NeurIPS, 2020.
- [Wang et al., 2020] Ning Wang, Yang Gao, and Hao Chen. Nas-fcos: Fast neural architecture search for object detec- tion. In Proc. of CVPR, 2020.
- [Wei et al., 2021] Chen Wei, Yiping Tang, and Chuang Niu Chuang Niu. Self-supervised representation learning for evolutionary neural architecture search. IEEE CIM, 2021.
- [Wei et al., 2022] Chen Wei, Chuang Niu, Yiping Tang, Yue Wang, Haihong Hu, and Jimin Liang. Npenas: Neural predictor guided evolution for neural architecture search. IEEE TNNLS, 2022.
- [Wen et al., 2020] Wei Wen, Hanxiao Liu, Yiran Chen, and Hai Li. Neural predictor for neural architecture search. In Proc. of ECCV, 2020.
- [White et al., 2021a] Colin White, Willie Neiswanger, and Yash Savani. Bananas: Bayesian optimization with neu- ral architectures for neural architecture search. In Proc. of AAAI, 2021.
- [White et al., 2021b] Colin White, Arber Zela, Robin Ru, Yang Liu, and Frank Hutter. How powerful are perfor- mance predictors in neural architecture search? Proc. of NeurIPS, 2021.
- [Wu et al., 2021] Junru Wu, Xiyang Dai, Dongdong Chen, Yinpeng Chen, Mengchen Liu, Ye Yu, Zhangyang Wang, Zicheng Liu, Mei Chen, and Lu Yuan. Stronger nas with weaker predictors. Proc. of NeurIPS, 2021.
- [Xiao et al., 2024] Teng Xiao, Huaisheng Zhu, Zhengyu Chen, and Suhang Wang. Simple and asymmetric graph contrastive learning without augmentations. Proc. of NeurIPS, 2024.
- [Xu et al., 2021] Yixing Xu, Yunhe Wang, Kai Han, and Yehui Tang. Renas: Relativistic evaluation of neural ar- chitecture search. In Proc. of CVPR, 2021.
- [Yan et al., 2020] Shen Yan, Yu Zheng, Wei Ao, Xiao Zeng, and Mi Zhang. Does unsupervised architecture represen- tation learning help neural architecture search? Proc. of NeurIPS, 2020.
- [Yi et al., 2023] Yun Yi, Haokui Zhang, Wenze Hu, Nannan Wang, and Xiaoyu Wang. Nar-former: Neural architecture representation learning towards holistic attributes predic- tion. In Proc. of CVPR, 2023.
- [Zhang et al., 2021a] Xiong Zhang, Hongmin Xu, and Hong Mo. Dcnas: Densely connected neural architecture search for semantic image segmentation. In Proc. of CVPR, 2021.
- [Zhang et al., 2021b] Yuge Zhang, Chenqian Yan, and Quanlu Zhang. Acenas: Learning to rank ace neural archi- tectures with weak supervision of weight sharing. arXiv preprint arXiv:2108.03001, 2021.
- [Zhao et al., 2023] Junbo Zhao, Xuefei Ning, Enshu Liu, and Binxin Ru. Dynamic ensemble of low-fidelity experts: Mitigating nas "cold-start". In Proc. of AAAI, 2023.
- [Zheng et al., 2022] Xiawu Zheng, Xiang Fei, Lei Zhang, and Chenglin Wu. Neural architecture search with rep- resentation mutual information. In Proc. of CVPR, 2022.
- [Zheng et al., 2024] Shenghe Zheng, Hongzhi Wang, and Tianyu Mu. Dclp: Neural architecture predictor with cur- riculum contrastive learning. In Proc. of AAAI, 2024.
References were extracted automatically from the PDF and may contain errors.
Full text extracted automatically from the PDF; figures, tables and equations may differ. The PDF is the version of record.
1 Introduction
Neural architecture search (NAS) [Elsken et al., 2019] has successfully emerged in automatically constructing network architectures for various tasks, including image classification [Huang et al., 2024], objective detection [Wang et al., 2020] and semantic segmentation [Zhang et al., 2021a]. Typical NAS frameworks find the best architecture in a vast search space based on a predefined performance metric (e.g., accuracy [Shen et al., 2023]), where training and evaluating candidate architectures requires substantial computational resources, limiting NAS applications in real-world scenarios [Huang et al., 2024]. To alleviate this issue, various methods are developed to reduce the overheads of architecture evaluations, such as predictor [Wen et al., 2020], parameter sharing
∗Corresponding author.
[Shen et al., 2023], and zero-shot metric [Mellor et al., 2021].
Many predictor-based NAS methods sample a set of evaluated architectures to train an accuracy predictor[Ma et al., 2024], aiming to learn the mapping relationship between architecture encodings and their corresponding absolute performance [Wen et al., 2020]. However, these predictors often face ranking issue caused by prediction biases, i.e., architectures with similar performance may be inaccurately ranked during the architecture search process, leading to suboptimal performance [Huang et al., 2022].
Recently, relativistic predictor focuses on comparing the relativistic performance of paired architectures rather than predicting their absolute performances, effectively mitigating the ranking issue [Huang et al., 2022; Xu et al., 2021]. However, such predictors still face cold-start issue: When applied to new datasets, the effective relativistic predictor needs to be trained from scratch by a large number of evaluated architectures for constructing the relativistic dataset, which remains a computationally expensive process [Zhao et al., 2023].
Typical relativistic predictors use accuracy to label architectural superior-inferior relationship. This paper exploits transferable relativistic label from the cheaper-toobtain performance estimation (i.e., zero-shot metric), which can roughly label the relativistic superiority or inferiority between architecture pairs on a proxy dataset for pretraining relativistic predictor. Learning to fit transferable relativistic label may encourage predictor to extract better ranking ability in advance, thereby facilitating a warm start on new datasets. In other words, a pretrained predictor with good ranking ability requires only a small number of evaluated architectures to achieve excellent predictive results on the new datasets. A straightforward approach is to pretrain the predictor by utilizing relativistic label of a single zero-shot metric on the proxy dataset and then finetune it on a small number of evaluated architectures from the new dataset. Table 1 presents preliminary experiments, yielding following observations.
1) Transferable relativistic label can significantly enhance ranking performance. For example, using NWOT [Mellor et al., 2021] increases Kendall's Tau by 0.3811 and 0.5062 on Ninapro and SCIFAR100, respectively.
2) Inappropriate use of transferable relativistic label may degrade ranking performance. For instance, using JACOV [Mellor et al., 2021] decreases Kendall's Tau by 0.01 and 0.0053 on ImageNet16-120 and Ninapro, respectively.
| Pretrained Correlation/Finetuning Correlation | ||||||
|---|---|---|---|---|---|---|
| Zero-shot | CIFAR10 | CIFAR100 | ImageNet16-120 | Ninapro | SVHN | SCIFAR100 |
| 0.2558/0.5459 ↑ | 0.4901/0.5002 ↑ | 0.6331/0.6421 ↑ | 0.3851/0.7627 ↑ | 0.5555/0.5434 ↓ | 0.2711/0.7773 ↑ | NWOT |
| SYNFLOW 0.5536/0.5665 ↑ | 0.5959/0.6096 ↑ | 0.3935/0.3951 | 0.3554/0.6740 | 0.1866/0.3890 ↑ | 0.6445/0.6383 ↓ | ↑ ↑ |
| 0.3026/0.5059 ↑ | 0.4379/0.4436 ↑ | 0.2759/0.6189 ↑ | 0.3757/0.7955 ↑ | 0.3563/0.3878 ↑ | 0.3329/0.5935 ↑ | SNIP |
| 0.3981/0.4012 ↑ | 0.5527/0.6394 ↑ | 0.7248/0.7148 ↓ | 0.4688/0.4635 ↓ | 0.3092/0.3797 ↑ | 0.3886/0.5682 ↑ | JACOV |
- Different datasets exhibit varied preferences for transferable relativistic label. For example, SYNFLOW [Tanaka et al., 2020] reduces Kendall's Tau on SCIFAR100 but enhances predictions on other datasets.
- Relativistic label is generally positively transferable across most datasets. For instance, NWOT, SYNFLOW, SNIP [Lee et al., 2018], and JACOV show positive transferability in 5, 5, 6, and 4 datasets, respectively.
Preliminary experiments demonstrate that transferable relativistic label improves ranking ability with limited evaluated architectures. This indicates that transferable relativistic label can effectively mitigate the cold-start issue. However, such a naive approach, which highly relies on selection of which single zero-shot metric, fails to fully exploit complementary knowledge from different zero-shot metrics. Therefore, integrating multiple metrics can better mitigate cold-start issue.
Accordingly, this paper proposes a transferable relativistic predictor (TRP). The proposed predictor comprises two steps. During the pretraining stage, we employ the proposed loss function, characterized by its smoothness and ease of optimization, to improve ranking ability on the relativistic dataset, which is softly labeled using multiple zero-shot metrics. During the finetuning stage, we approximate the ranking correlation function of TRP using Chebyshev interpolation. A point where the marginal benefit is less than a certain threshold value indicates the number of evaluated architectures required to finetune TRP on the target dataset. This method can adaptively determine the number of evaluated architectures. The contributions can be summarized as follows.
- We propose a transferable relativistic predictor (TRP), which can effectively mitigate the cold-start issue by full use of the transferable relativistic label from multiple zero-shot metrics.
- We provide theoretical analyses of the designed loss function from Bayes consistency and risk minimization, demonstrating its advantages in obtaining better ranking representation.
- We run extensive experiments. Specifically, the number of evaluated architectures needed by TRP is fewer than that of most existing predictors. TRP can achieve good results in NAS-Bench-201, TransferNAS-Bench101-Micro, TransferNAS-Bench101-Macro, and DARTS search spaces.
2 RelatedWorks
Zero-shot metrics. These metrics eliminate the need for architecture training and can quickly quantify the performance of architectures by the theoretical-based and empirical-based methods [Chen et al., 2024]. Typically, such metrics require less than one second for architectural evaluation [Chen et al., 2021a]. In addition, numerous studies [Krishnakumar et al., 2022; Chen et al., 2024; Li et al., 2024] have observed that some training-free metrics (e.g., NWOT [Mellor et al., 2021] and FLOPS [Ning et al., 2021]) obtain better ranking correlations on different datasets with the same search space. However, there is no zero-shot metric that achieves good ranking quality in all search spaces, and the optimal zero-shot metric varies from search space [Ning et al., 2021].
Predictor-based NAS. The accuracy predictor has achieved remarkable success in performance evaluation, but expensive evaluated architectures still limit the development. Early works have attempted to fully exploit the limited evaluated architectures to improve accuracy predictor performance from the perspective of operation hierarchy [Chen et al., 2021c], spatial topology information [Lu et al., 2021a], and information flow [Ning et al., 2020], respectively. In addition, some works convert learning methods from supervised learning to semi-supervised learning [Luo et al., 2020; Liu et al., 2021] and self-supervised learning [Ji et al., 2024; Wei et al., 2021; Zheng et al., 2024], alleviating the need for evaluated architectures. However, the accuracy predictor with poor ranking correlation between ground-truth performance and the predicted performance can mislead the search algorithm leading to the selection of a low-ranking architecture.
To tackle this, the relativistic predictor is designed to learn the relativistic ranking of architectures rather than their absolute performances [Huang et al., 2022; Hu et al., 2021; Guo et al., 2024; Chen et al., 2021b]. Among these, NARQ2T [Guo et al., 2024] acquires knowledge of the performance distributions within the search space, facilitating the generalization of its ranking ability across datasets. ArchGraph [Huang et al., 2022] generalizes task embedding to predict relativistic relation between architecture pairs. Although NARQ2T and Arch-Graph achieve cross-dataset generalization, they still demand substantial evaluated architectures during training. In addition, these works use the hinge function, which is non-smooth and difficult to optimize/learn the relativistic relationship between architecture pairs, leading to poor ranking ability.
Zero-shot metrics in predictor-based NAS. Recent studies have attempted to exploit zero-shot metrics for achieving better search efficiency. For example, the work [White et al., 2021b] finds that certain zero-shot metrics can improve the predictive power of the accuracy predictor. ProxyBO [Shen et al., 2023] proposes to combine the architecture ranking given by the accuracy predictor and zero-shot metrics in the search process. AceNAS [Zhang et al., 2021b] pretrains the accuracy predictor based no FLOPS and #PARAMS. DELE [Zhao et al., 2023] dynamically integrates zero-shot metrics for pretraining accuracy predictor. However, such predictors are still subject to the ranking issue.
3 Methodology
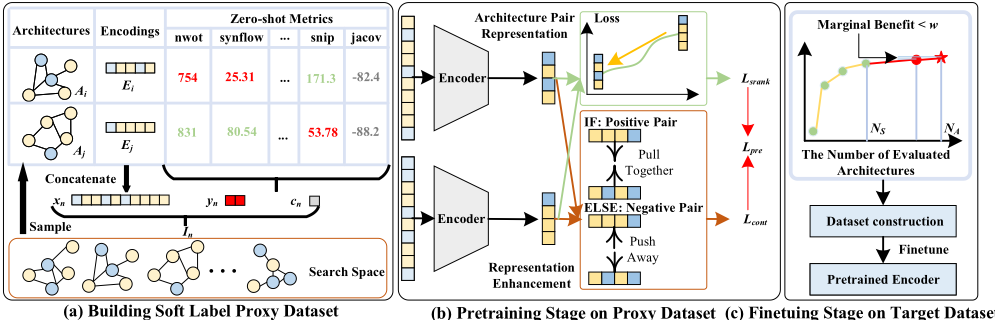
As shown in Figure 1, the overall framework of the proposed TRP method contains three parts, i.e., building soft label proxy dataset, pretraining stage on proxy dataset, and finetuing stage on target dataset.
3.1 Building Soft Label Proxy Dataset
Given a search space, two architectures Ai and Aj are randomly sampled to construct an instance In for proxy dataset DP . The encodings Ei and Ej corresponding to Ai and Aj are concatenated to form the input feature xn. Considering the imprecision of zero-shot metrics (especially when the values of the metrics for the two architectures are close [Mellor et al., 2021]), soft label yn and confidence score cn are used to measure relativistic knowledge from K zero-shot metrics at a fine-grained level. yn is a two-dimensional vector, where the first dimension y1n denotes the probability that Ai is significantly better than Aj, and the second dimension y2n denotes the probability that Aj is significantly better than Ai. We first judge whether Ai or Aj is significantly superior or inferior than the other based on Eq. (1).
where MAi and MAj are the metric values of architectures Ai and Aj, respectively. The selection of ρ is decided by experiment instead of a statistical significance test. If ρ is greater than threshold, there is a significant superior-inferior relationship between Ai and Aj. Conversely, there is no significant superior-inferior relationship. Ni, Nj, and Nij indicate the number of metrics where Ai is significantly better than Aj, Aj is significantly better than Ai, and neither is significantly better, respectively. Based on this, y1n and y2n are equal toNi/K andNj/K, respectively. For confidence score cij, the smaller Nij indicates that the annotation is more reliable. Thus, cn is equal to 1 - (Nij/K). Repeating the above process N times, we can obtain the proxy dataset DP . Due to the architecture pair with transferable relativistic label, the pretrained predictor on DP can obtain better representations.
3.2 Pretraining Stage on Proxy Dataset
For architectural pair representation, the normal ranking loss can be defined as Eq. (2) [Xu et al., 2021; Guo et al., 2024].
where ψ (.) is a hinge function with a hyperparameter α, which is usually set to 1 to control the margin (see Eq. (3)). Unfortunately, the hinge function is non-smooth and thus is difficult to optimize for better ranking ability.
where f1(xn) and f0(xn) are the predicted values of xn, respectively. Given proxy dataset DP , we develop a smooth approximation of Eq. (2) via the log-sum-exp function,
Lsrank form is, asymptotically, an upper bound of the following hinge loss form,
where
which allows the predictor to have adaptive margins α⋆ per architecture pair. It is differentiable and smooth everywhere, which makes it easier to optimize for obtaining better ranking ability. We give theoretical analysis of Lsrank in Section 4.
To enhance the architecture pair representations, we employ contrastive learning [Xiao et al., 2024] to maximize similarity among positive data while ensuring dissimilarity for negative samples, thereby aligning architecture pair representations for semantically similar data. Our approach treats different instances with the same soft label as positive data and instances with the different soft label as negative data. We calculate the representation similarity of two instances xi and xj , where the embeddings are obtained with an encoder z (.):
The contrastive learning requires similar data to yield a larger s (.). The contrastive loss is as follows:
where τ is a temperature hyperparameter. k+ and k- denote positive and negative data, respectively. The final loss function is the combination of Eqs. 4 and 8.
where λ1 is a hyperparameter to control the importance between two different loss functions. Therefore, the proposed loss function has a twofold effect. The first is to maximize the capture of relativistic knowledge in soft labels through a smooth and easy-to-optimize loss function (i.e., Lsrank). The second is the acquisition of more discriminative ranking representations through contrastive loss (i.e., Lcont).
3.3 Finetuing Stage on Target Dataset
After pretraining stage, finetuning is required to transfer the pretrained predictor to the target task. However, how to choose the appropriate number of evaluated architectures still requires trial and error. To solve the issue, we design an interpolation-based method to select the number of evaluated architectures adaptively. Specifically, we first sample a small number of evaluated architectures (Ns) from the target dataset. Interpolated data points are denoted as DI = (mi, ri), where ri refers to Kendall's Tau correlation for Ns evaluated architectures after finetuning via mi samples. Based on DI , we fit a curve of the relationship between the number of evaluated architectures and Kendall's Tau correlation by Chebyshev interpolation polynomial (i.e., Eq. (10)) [Rivlin, 2020].
The marginal benefit is the first order derivative of Eq. (10) as follows:
The optimal number of evaluated architectures is NA = min {m ∈ N | P ′ (x) ≤ ω}. The relativistic dataset DT with size 2NA(NA-1) is constructed to finetune the predictor. Unlike DP , labels in DT are based on ground-truth performances of architecture pairs. If Ai is better than Aj, y1n and y2n are 1 and 0, respectively. Otherwise, y1n and y2n are 0 and 1. Furthermore, DT is without confidence score. The following loss function is used in finetuing stage,
where λ2 is to control the importance between two different loss functions. L∗srank is version of Eq. (4) without confidence score cn.
4 Theoretical Analysis
We prove the benefit of Eq. (4) from the point of view of Bayes consistency and risk minimization. Bayes consistency is a critical attribute of loss function for achieving the right objective [Saberian and Vasconcelos, 2011]. The output of the predictor is a two-dimensional vector [fF (x), fL(x)], where fF (x) and fL(x) are the superiority and inferiority scores in architectural pairs, respectively. Based on Bayes prediction rule, we can obtain the followings:
where Y ∈ {F, L} is the label space. F and L denote the labels in architectural pairs in which the former is superior to the latter and the latter is better than the former, respectively. The outputs to the predictor need to be satisfied:
Due to ∆f(xn) = f1(xn) - f0(xn), when sign(y1n - y2n ) = 1, exp((f1(xn) - f0(xn) ∗ sign(y1n - y2n )) = exp (∆f(xn)). When sign(y1n - y2n ) = 0, exp((f1(xn) - f0(xn) ∗ sign(y1n - y2n )) = exp (-∆f(xn)). Thus, Eq. (4) = log (1+ ∑Nn=1 cn ∗ exp (±∆f(xn)))≈ ∑Nn=1 cn ∗ exp (- 1 2 ∆f (xn)).
Considering the loss of a single architecture pair, since cn as a real number cannot affect the subsequent proof, Lsrank in Eq. (4) loss is analytically equivalent to the following loss without the logarithmic,
where ∆f(x) = fF (x) - fL(x). When ∆f(x) ≫ 0, i.e., fF (x) ≫ fL(x), it indicates that score of F is significantly higher than L, and loss approaches zero. The loss function drives predictor training, making ∆f(x) increasingly larger, aligning predictor's predictions with Bayes consistency.
Proof. Consider f(x) that minimizes the risk, The total risk function of the predictor is defined as:
The conditional risk function is defined as:
Substituting the loss function, we have:
The first and second order derivatives of Eq. (18) are
Since P(Y = F | x) and P(Y = L | x) are non-negative, and the exponential function is always greater than zero, the second-order derivative is always positive, indicating that the risk function is convex and exists a global minimum solution. Making the first order derivative equal to 0 obtains the minimum value of the risk function ∆f(x) = log P(Y=F|x) P (Y =L|x) consistent with the predictor's output. f ∗ (x) implements the Bayes prediction rule in Eq. (13). Thus, we can say that using Eq. (4) achieves the right objective and extracts better architecture pair representations for predictor.
5 Experiments and Results
The experiments contain ranking capability, search results, and ablation studies. We run experiments on three closed domain search spaces and one open domain search space.
| Method | CIFAR-10 | CIFAR-100 | ImageNet16-120 | |||
|---|---|---|---|---|---|---|
| Query | τ | Query | τ | Query | τ | |
| CAP † | 50 | 0.5733 | 50 | 0.5663 | 50 | 0.5697 |
| DCLP † | 50 | 0.6090 | 50 | 0.5899 | 50 | 0.5828 |
| DELE † | 45 | 0.6447 | 45 | 0.6427 | 45 | 0.6328 |
| Arch-Graph † | 150 | 0.6724 | 150 | 0.6674 | 150 | 0.6533 |
| ReNAS † | 90 | 0.6529 | 90 | 0.6411 | 90 | 0.6458 |
| TRP (Ours) | 30 | 0.8324 | 34 | 0.8267 | 41 | 0.8286 |
5.1 Results on NAS Benchmarks
The experiments are conducted on NAS-Bench-201 and TransNAS-Bench-101 benchmarks. Kendall's Tau is used to evaluate the predictor's ranking capability, while a query metric represents the amount of evaluated architectures required by the predictor. TRP focuses on the relative relationship between two architectures, and an additional bubble sort is necessary to determine the predicted ranking for a set of architectures, where TRP is used to decide whether to swap the rankings of two architectures. The closer Kendall's Tau value is to 1, the higher the agreement between actual accuracy ranking and predicted ranking, indicating the better ranking capability of TRP. For the query metric, we adopt experimental results from the original literature. If the predictor has not been tested on a NAS benchmark, default settings from the source code are applied. In NAS-Bench-201, the proxy dataset is constructed using zero-shot metrics on CIFAR-10 for pretraining, followed by finetuning on CIFAR-10, CIFAR-100, and ImageNet16-120. For TransNAS-Bench-101, zero-shot metrics from the objective classification task are used to construct the proxy dataset, and finetuning is performed on all datasets. The number of queries is adaptively determined using the proposed interpolation method.
The ranking results on NAS-Bench-201 are recorded in Table 2. Compared with existing pretraining-finetuning accuracy predictors (i.e., CAP, DCLP, and DELE) and relativistic predictors (Arch-Graph and ReNAS), TRP achieves the best Kendall's Tau on the three datasets with the fewest number of evaluated architectures (CIFAR-10: 30, CIFAR-100: 34 and ImageNet16-120: 41). Notably, with only 30 evaluated architectures (1/3 of Arch-Graph), Kendall's Tau of TRP achieves 0.1805 improvement on the CIFAR-10. Moreover, we report the ranking results on TransNAS-Bench-101 in Table 3. It can be observed that TRP obtains state-of-the-art performance when compared with other competitors regardless of the datasets. Moreover, it is noteworthy that TRP surpasses the second-best predictors (i.e., DELE and ReNAS) by at least 0.22 Kendall's Tau on all tasks in the macro and micro search spaces. Compared to Arch-Graph (50), which is also tested on TransNAS-Bench-101, we are at least 10 the evaluated architectures fewer than Arch-Graph is, but obtain an improvement of at least 0.25 Kendall's Tau.
Such good results imply that the pretraining stage can fully utilize the transferable relativistic label from zero-shot metrics via the designed soft label and loss function. The pretrained predictor can learn meaningful architecture pair representations for the architectural pairs even before the finetuning stage. Thus, only a few evaluated architectures are enough for a warm start of the predictor on new datasets.
| Search Space | Method | Cls. Obj. | Cls. Scene | Auto. | Normal | Sem. Seg. | Room. | Jigsaw | |||||||
|---|---|---|---|---|---|---|---|---|---|---|---|---|---|---|---|
| Query | τ | Query | τ | Query | τ | Query | τ | Query | τ | Query | τ | Query | τ | ||
| CAP† | 50 | 0.5648 | 50 | 0.5557 | 50 | 0.557 | 50 | 0.5619 | 50 | 0.5582 | 50 | 0.5524 | 50 | 0.5596 | |
| DCLP† | 50 | 0.6075 | 50 | 0.5977 | 50 | 0.6089 | 50 | 0.6105 | 50 | 0.6081 | 50 | 0.5902 | 50 | 0.6083 | |
| Micro DELE† | 45 | 0.6306 | 45 | 0.6339 | 45 | 0.6369 | 45 | 0.6304 | 45 | 0.6261 | 45 | 0.6275 | 45 | 0.6327 | |
| Arch-Graph† | 50 | 0.6063 | 50 | 0.5918 | 50 | 0.6021 | 50 | 0.6069 | 50 | 0.5906 | 50 | 0.6084 | 50 | 0.6023 | |
| ReNAS† | 90 | 0.6378 | 90 | 0.6277 | 90 | 0.6297 | 90 | 0.6377 | 90 | 0.6319 | 90 | 0.6233 | 90 | 0.6269 | |
| TRP (Ours) | 31 | 0.8584 | 28 | 0.8620 | 33 | 0.8771 | 34 | 0.8695 | 29 | 0.8697 | 40 | 0.8709 | 38 | 0.8513 | |
| CAP† | 50 | 0.5545 | 50 | 0.5594 | 50 | 0.5553 | 50 | 0.5586 | 50 | 0.5583 | 50 | 0.5572 | 50 | 0.5672 | |
| DCLP† | 50 | 0.6011 | 50 | 0.5963 | 50 | 0.6034 | 50 | 0.5920 | 50 | 0.5978 | 50 | 0.6101 | 50 | 0.5995 | |
| Macro DELE† | 45 | 0.6295 | 45 | 0.6238 | 45 | 0.6357 | 45 | 0.6379 | 45 | 0.6246 | 45 | 0.6327 | 45 | 0.6418 | |
| Arch-Graph† | 50 | 0.6004 | 50 | 0.6040 | 50 | 0.5942 | 50 | 0.5989 | 50 | 0.6029 | 50 | 0.6009 | 50 | 0.6073 | |
| ReNAS† | 90 | 0.6251 | 90 | 0.6281 | 90 | 0.6342 | 90 | 0.6250 | 90 | 0.6392 | 90 | 0.6324 | 90 | 0.6325 | |
| TRP (Ours) | 33 | 0.8551 | 36 | 0.8503 | 34 | 0.8715 | 37 | 0.8527 | 33 | 0.8667 | 39 | 0.8515 | 37 | 0.8609 | |
| Method | CIFAR-10 | CIFAR-100 | ImageNet16-120 | Search Cost | |||
|---|---|---|---|---|---|---|---|
| Val. Acc (%) ↑ | Test.Acc (%) ↑ | Val. Acc (%) ↑ | Test.Acc (%) ↑ | Val. Acc (%) ↑ | Test.Acc (%) ↑ | (Seconds) ↓ | |
| ResNet [2016] | 90.83 | 93.97 | 70.42 | 70.86 | 44.53 | 43.63 | - |
| ENAS [2018] DARTS [2018b] | 37.51 ± 3.19 | 53.89 ± 0.58 | 13.37 ± 2.35 | 13.96 ± 2.33 | 15.06 ± 1.95 | 14.84 ± 2.10 | 13314.51 |
| 39.77 ± 0.00 | 54.30 ± 0.00 | 15.03 ± 0.00 | 15.61 ± 0.00 | 16.43 ± 0.00 | 16.32 ± 0.00 | 10889.87 | |
| Arch2Vec-BO [2020] | 91.41 ± 0.22 | 94.18 ± 0.24 | 73.35 ± 0.32 | 73.37 ± 0.30 | 46.34 ± 0.18 | 46.27 ± 0.37 | 12000 |
| RMI-NAS [2022] | 91.44 ± 0.09 | 94.28 ± 0.10 | 73.38 ± 0.14 | 73.36 ± 0.19 | 46.37 ± 0.00 | 46.34 ± 0.00 | 1258.21 |
| CAP [2024] | 91.54 ± 0.10 | 94.34 ± 0.06 | 73.41 ± 0.17 | 73.41 ± 0.22 | 46.47 ± 0.07 | 46.44 ± 0.36 | 15.65 |
| ReNAS [2021] | 90.90 ± 0.31 | 93.99 ± 0.25 | 71.96 ± 0.99 | 72.12 ± 0.79 | 45.85 ± 0.47 | 45.97 ± 0.49 | 86.31 |
| LCMNAS [2023] | 91.22 ± 0.17 | 94.05 ± 0.07 | 71.96 ± 0.96 | 72.01 ± 0.82 | 45.55 ± 0.78 | 45.61 ± 0.08 | 11521 |
| BOHB [2018] | 90.82 ± 0.53 | 93.61 ± 0.52 | 70.74 ± 1.29 | 70.85 ± 1.28 | 44.26 ± 1.36 | 44.42 ± 1.49 | 12000 |
| Jacob cov [2021] | 89.69 ± 0.73 | 92.96 ± 0.80 | 69.87 ± 1.22 | 70.03 ± 1.16 | 43.99 ± 2.05 | 44.43 ± 2.07 | - |
| SETN [2019a] | 82.25 ± 5.17 | 86.19 ± 4.63 | 56.86 ± 7.59 | 56.87 ± 7.77 | 32.54 ± 3.63 | 31.90 ± 4.07 | 31009.81 |
| ParZC [2024] | 91.55 ± 0.02 | 94.36 ± 0.25 | 73.49 ± 0.02 | 73.31 ± 0.02 | 46.37 ± 0.04 | 46.34 ± 0.01 | 68.95 |
| GDAS [2019b] | 90.00 ± 0.21 | 93.51 ± 0.13 | 71.14 ± 0.27 | 70.61 ± 0.26 | 41.70 ± 1.26 | 41.84 ± 0.90 | 28926 |
| TRP | 91.57 ± 0.01 | 94.36 ± 0.15 | 73.49 ± 0.01 | 73.44 ± 0.02 | 46.49 ± 0.05 | 46.48 ± 0.27 | 14.97 |
| Optimal | 91.61 | 94.37 | 73.49 | 73.51 | 46.73 | 47.31 | - |
5.2 Searching on Closed Domain Search Spaces
On NAS-Bench-201, the total number of queried architectures is determined by an interpolation-based method (see Table 2). We follow the settings in [Dong and Yang, 2020] to search for architectures. Specifically, the predictor evaluates all architectures in the search space. The best performance of the first 50 evaluated architectures is reported as the search result (see Table 4). Compared with competitors, TRP completes the evaluation of all architectures using only 15 seconds. In addition, we achieve the best average accuracy on different datasets. Especially, the number of queried architectures is substantially fewer than the accuracy predictor (e.g., CAP) and relativistic predictor (e.g., ReNAS). For fair comparison on TransNAS-Bench-101, we follow the settings in [Huang et al., 2022] and the search results are shown in Table 5. On macro and micro search spaces, TRP achieves the best search results on all datasets. Compared to Arch-Graph (query = 50), TRP achieves good results by querying a small number of architectures (query range: 29-40).
These extraordinary results can be attributed to the sufficient transferable relativistic label from zero-shot metrics that the predictor learns in advance through the designed soft label and loss function. Moreover, TRP is finetuned on a small number of evaluated architectures, and obtains excellent state-of-the-art performances on different datasets across multiple search spaces, further verifying the positive effects of using transferable relativistic label. These promising experimental results demonstrate that the transferable relativistic label facilitates reducing the number of evaluated architectures and mitigating cold-start issue on new datasets.
5.3 Searching on Open Domain Search Space
We construct the proxy dataset using the zero-shot metrics on CIFAR-10 for the pretraining predictor, which is finetuned by CIFAR-10 and CIFAR-100. Following [White et al., 2021a], we randomly select a certain number of architectures in the DARTS search space and then train them from scratch to construct the evaluated architectures for the pretraining predictor, where the number of selected architectures is determined by the proposed adaptive approach. For each selected architecture, the epoch number is set to 50 with a batch size 64. As for the search method, we sample 10k architectures at random in the DARTS search space and evaluate them using our trained predictor. After that, we select the architectures with top-5 predicted performance as the search results and re-train them with common DARTS strategies. The experimental results on CIFAR-10 and CIFAR-100 are shown in Table 6.
Compared to predictor-based NAS approaches, the architectures obtained by TRP achieve minimal loss and #Param on both datasets. Regarding search cost, we outperform most predictors on CIFAR-10, second only to TNASP and PINAT. In terms of loss, the architecture obtained by TRP is less than TNASP and PINAT by 0.12 and 0.02, respectively. Regarding the number of queried architectures, on CIFAR-10 and CIFAR-100, TRP is only 1/4 of DELE. Using such a small number of queried architectures and obtaining good search results reaffirms the advantages of the proposed predictor for mitigating cold-start issue. More detailed experimental settings are reported in the supplementary materials.
| Search Space | Algorithm | Cls. Obj. Acc. (%) ↑ | Cls. Scene Acc. (%) ↑ | Auto. SSIM (10-3 ) ↑ | Normal SSIM (10-3 ) ↑ | Sem. Seg. mIoU (%) ↑ | Room. L2 loss (10-3 ) ↓ | Jigsaw Acc. (%) ↑ |
|---|---|---|---|---|---|---|---|---|
| Micro | RS [2012] | 45.16 | 54.41 | 55.94 | 56.85 | 25.21 | 61.48 | 94.47 |
| REA [2019] | 45.39 | 54.62 | 56.96 | 57.22 | 25.52 | 61.72 | 88.95 | |
| PPO [2017] | 45.19 | 54.37 | 55.83 | 56.9 | 25.24 | 66.98 | 88.95 | |
| BONAS-t [2020] | 45.38 | 54.57 | 56.18 | 57.24 | 25.24 | 60.93 | - | |
| Arch-Graph-zero [2022] | 45.64 | 54.8 | 56.61 | 57.9 | 25.73 | 60.21 | - | |
| Arch-Graph[2022] | 45.81 | 54.9 | 56.58 | 58.27 | 25.69 | 60.08 | - | |
| weakNAS [2021] | 45.66 | 54.72 | 56.91 | 57.21 | 25.90 | 60.37 | 94.63 | |
| CATCH [2020] | 45.27 | 54.38 | 56.13 | 56.99 | 25.38 | 60.7 | - | |
| TRP (Ours) | 45.92 | 54.77 | 56.99 | 58.62 | 25.90 | 60.01 | 94.77 | |
| Optimal | 46.32 | 54.94 | 57.72 | 59.62 | 26.27 | 59.38 | 95.37 | |
| Macro | RS [2012] | 46.85 | 56.5 | 70.06 | 60.7 | 28.37 | 59.35 | 96.78 |
| REA [2019] | 47.09 | 56.57 | 69.98 | 60.88 | 28.87 | 58.73 | 96.88 | |
| BONAS [2020] | 46.85 | 56.47 | 74.45 | 61.62 | 28.82 | 59.39 | 96.76 | |
| weakNAS [2021] | 47.4 | 56.88 | 72.54 | 62.37 | 29.18 | 57.86 | 96.86 | |
| CATCH [2020] | 47.29 | 56.49 | 70.36 | 60.85 | 28.71 | 59.37 | - | |
| BONAS-t [2020] | 47.06 | 56.86 | 71.41 | 61.44 | 28.76 | 58.35 | - | |
| Arch-Graph-zero [2022] | 47.42 | 56.78 | 75.51 | 63.39 | 29.17 | 58.15 | - | |
| Arch-Graph [2022] | 47.44 | 56.98 | 75.9 | 64.35 | 29.19 | 57.75 | - | |
| TRP (Ours) | 47.52 | 56.99 | 75.95 | 64.35 | 29.20 | 57.55 | 96.97 | |
| Optimal | 47.96 | 57.48 | 76.88 | 64.35 | 29.66 | 56.28 | 97.02 |
| Dataset | Algorithm | #Param (MB) ↓ | Error (%) ↓ | Search Cost (GPUDays)↓ | Query ↓ |
|---|---|---|---|---|---|
| C10 | CATE [2021a] NPENAS-NP [2022] TNASP [2021b] NAR-Former [2023] DELE [2023] DCLP-RL [2024] CAP [2024] PINAT [2023] CATES [2020] Arch2vec-BO [2020] BONAS-D [2020] | 3.5 3.5 3.7 3.8 4.1 - 3.3 3.6 4.1 3.6 3.3 | 2.56 2.44 2.52 2.48 2.3 2.48 2.42 2.42 2.58 2.48 2.43 | 3.3 1.8 0.3 0.24 - 0.17 3.3 0.3 - 100 10 | 150 100 1000 100 300 - 100 1000 800 400 4800 |
| PNAS [2018a] NAO [2018] | 3.2 | 17.63 15.67 16.07 | 225 200 - | 1160 1000 300 | |
| 10.6 | |||||
| TRP (Ours) | 3.2 | 2.40 | 1.4 | 54 | |
| C100 | |||||
| DELE [2023] | 4.1 | ||||
| TRP (Ours) | 3.2 | 14.94 | 1.7 | 73 |
5.4 Ablation Study
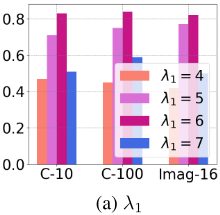
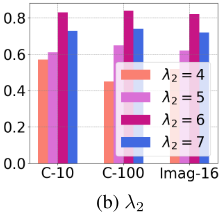
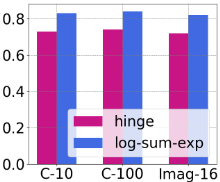
We conduct ablation studies for the loss function, including hyperparameters (λ1 and λ2), hinge/log-sum-exp, and with/without contrastive loss. Based on Figures 2 (a) and (b), λ1 and λ2 for pretraining and finetuning stages should be taken as 7 and 6, respectively, achieving good Kendall's Tau. Figure 2 (c) proves that the log-sum-exp learns a better representation compared to the hinge loss, facilitating the improvement of the ranking ability of the predictor. The contrastive loss can capture better architecture pair representations (see
(c) Hinge vs. log-sum-exp
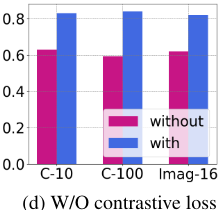
Figure 2 (d)). More experiments (e.g., ① soft label/hard label, ② with/without pretraining, and ③ finetuning methods) can be found in the supplementary materials.
6 Conclusions
This paper proposes a transferable relativistic predictor to alleviate cold-start issue. The pretraining stage enhances architecture pair representation with a specialized loss function, and the finetuning stage employs interpolation to determine the amount of evaluated architectures adaptively. Experiments across four search spaces demonstrate that TRP outperforms peer predictor-based NAS methods. We further will explore more information fusion technology to boost in-depth research into the transferable relativistic label.
Acknowledgments
This work is supported in part by the National Natural Science Foundation of China under Grant 62472079, in part by the China Scholarship Council (CSC)/Victoria University Scholarship, and in part by the Special Programme for Doctoral Students under the Young Talent Support Project of CAST.
@inproceedings{ijcai2025p626,
  title     = {Transferable Relativistic Predictor: Mitigating Cross-Task Cold-Start Issue in NAS},
  author    = {Li, Nan and Xue, Bing and Ma, Lianbo and Zhang, Mengjie},
  booktitle = {Proceedings of the Thirty-Fourth International Joint Conference on
               Artificial Intelligence, {IJCAI-25}},
  publisher = {International Joint Conferences on Artificial Intelligence Organization},
  editor    = {James Kwok},
  pages     = {5625--5633},
  year      = {2025},
  month     = {8},
  note      = {Main Track},
  doi       = {10.24963/ijcai.2025/626},
  url       = {https://doi.org/10.24963/ijcai.2025/626},
}
TY - CPAPER TI - Transferable Relativistic Predictor: Mitigating Cross-Task Cold-Start Issue in NAS AU - Li, Nan AU - Xue, Bing AU - Ma, Lianbo AU - Zhang, Mengjie T2 - Proceedings of the Thirty-Fourth International Joint Conference on Artificial Intelligence, IJCAI-25 PB - International Joint Conferences on Artificial Intelligence Organization PY - 2025 SP - 5625 EP - 5633 DO - 10.24963/ijcai.2025/626 UR - https://doi.org/10.24963/ijcai.2025/626 ER -Copied
Machine-readable versions of this paper, for tools and AI agents:





