
Uncertainty-guided Graph Contrastive Learning from a Unified Perspective
Proceedings of the Thirty-Fourth International Joint Conference on Artificial Intelligence. Main Track. Pages 5653-5661.
https://doi.org/10.24963/ijcai.2025/629
Keywords
- Data Mining: DM: Mining graphs
- Machine Learning: ML: Self-supervised Learning
Abstract
The success of current graph contrastive learning methods largely relies on the choice of data augmentation and contrastive objectives. However, most existing methods tend to optimize these two components independently, neglecting their potential interplay, which leads to suboptimal quality of the learned embeddings. To address this issue, we propose Uncertainty-guided Graph Contrastive Learning (UGCL) from a unified perspective. The core of our method is the introduction of sample uncertainty, a critical metric that quantifies the degree of class ambiguity within individual samples. On this basis, we design a novel multi-scale data augmentation strategy and a weighted graph contrastive loss function, both of which significantly enhance the quality of embeddings. Theoretically, we demonstrate that UGCL can coordinate overall optimization objectives through uncertainty, and through experiments, we show that it improves the performance of tasks such as node classification, node clustering, and link prediction, thereby verifying the effectiveness of our method.
- [Baevski et al., 2022] Alexei Baevski, Wei-Ning Hsu, Qiantong Xu, Arun Babu, Jiatao Gu, and Michael Auli. Data2vec: A general framework for self-supervised learning in speech, vision and language. In Proceedings of the 39th International Conference on Machine Learning, pages 1298-1312, 2022.
- [Chen et al., 2020a] Ming Chen, Zhewei Wei, Zengfeng Huang, Bolin Ding, and Yaliang Li. Simple and deep graph convolutional networks. In Proceedings of the 37th International Conference on Machine Learning, pages 1725-1735, 2020.
- [Chen et al., 2020b] Ting Chen, Simon Kornblith, Moham- mad Norouzi, and Geoffrey E. Hinton. A simple frame- work for contrastive learning of visual representations. In Proceedings of the 37th International Conference on Ma- chine Learning, pages 1597-1607, 2020.
- [Chu et al., 2021] Guanyi Chu, Xiao Wang, Chuan Shi, and Xunqiang Jiang. Cuco: Graph representation with curricu- lum contrastive learning. In Proceedings of the 30th Inter- national Joint Conference on Artificial Intelligence, pages 2300-2306, 2021. IJCAI
- [Grill et al., 2020] Jean-Bastien Grill, Florian Strub, Flo- rent Altché, Corentin Tallec, Pierre H. Richemond, Elena Buchatskaya, Carl Doersch, Bernardo Ávila Pires, Zhao- han Guo, Mohammad Gheshlaghi Azar, Bilal Piot, Koray Kavukcuoglu, Rémi Munos, and Michal Valko. Bootstrap your own latent -A new approach to self-supervised learn- ing. In Proceedings of the 33rd Advances in Neural Infor- mation Processing Systems, 2020.
- [Hartigan and Wong, 1979] John A Hartigan and Manchek A Wong. Algorithm as 136: A k-means clustering algorithm. Journal of The Royal Statistical Society. Series c (Applied Statistics), 28(1):100-108, 1979.
- [Hassani and Ahmadi, 2020] Kaveh Hassani and Amir Ho- sein Khas Ahmadi. Contrastive multi-view representa- tion learning on graphs. In Proceedings of the 37th Inter- national Conference on Machine Learning, pages 4116- 4126, 2020.
- [He et al., 2020] Kaiming He, Haoqi Fan, Yuxin Wu, Sain- ing Xie, and Ross B. Girshick. Momentum contrast for unsupervised visual representation learning. In Proceed- ings of the IEEE/CVF Conference on Computer Vision and Pattern Recognition, pages 9726-9735, 2020.
- [Kipf and Welling, 2016] Thomas N Kipf and Max Welling. Variational graph auto-encoders. arXiv preprint arXiv:1611.07308, 2016.
- [Li et al., 2021] Haoyang Li, Xin Wang, Ziwei Zhang, Ze- huan Yuan, Hang Li, and Wenwu Zhu. Disentangled con- trastive learning on graphs. In Proceedings of the 34th Ad- vances in Neural Information Processing Systems, pages 21872-21884, 2021.
- [Liu et al., 2024] Ziyang Liu, Chaokun Wang, and Cheng Wu. Graph contrastive learning with reinforcement aug- mentation. In Proceedings of the 33rd International Joint Conference on Artificial Intelligence, pages 2225-2233, 2024. IJCAI
- [Luo et al., 2023] Dongsheng Luo, Wei Cheng, Yingheng Wang, Dongkuan Xu, Jingchao Ni, Wenchao Yu, Xuchao Zhang, Yanchi Liu, Yuncong Chen, Haifeng Chen, and Xiang Zhang. Time series contrastive learning with information-aware augmentations. In Proceedings of the 37th AAAI Conference on Artificial Intelligence, pages 4534-4542, 2023.
- [Ma et al., 2024] Yinchao Ma, Yuyang Tang, Wenfei Yang, Tianzhu Zhang, Jinpeng Zhang, and Mengxue Kang. Uni- fying visual and vision-language tracking via contrastive learning. In Proceedings of the 38th AAAI Conference on Artificial Intelligence, pages 4107-4116, 2024.
- [Meng et al., 2024] Chaojun Meng, Changfan Pan, Zilong Li, Cong Zhou, Xinran Cao, and Jia Zhu. DFRP: A dual- track feedback recommendation system for educational re- sources. In Proceedings of the 33rd International Joint Conference on Artificial Intelligence, pages 8741-8744, 2024.
- [Ng et al., 2001] Andrew Y. Ng, Michael I. Jordan, and Yair Weiss. On spectral clustering: Analysis and an algorithm. In Proceedings of the 14th Advances in Neural Informa- tion Processing Systems, pages 849-856, 2001.
- [Niu et al., 2024] Chaoxi Niu, Guansong Pang, and Ling Chen. Affinity uncertainty-based hard negative mining in graph contrastive learning. IEEE Transactions on Neural Networks and Learning Systems, 2024.
- [Pan et al., 2018] Shirui Pan, Ruiqi Hu, Guodong Long, Jing Jiang, Lina Yao, and Chengqi Zhang. Adversarially reg- ularized graph autoencoder for graph embedding. In Pro- ceedings of the 27th International Joint Conference on Ar- tificial Intelligence, pages 2609-2615, 2018. IJCAI
- [Peng et al., 2020] Zhen Peng, Wenbing Huang, Minnan Luo, Qinghua Zheng, Yu Rong, Tingyang Xu, and Jun- zhou Huang. Graph representation learning via graphical mutual information maximization. In Proceedings of The Web Conference, pages 259-270, 2020.
- [Perozzi et al., 2014] Bryan Perozzi, Rami Al-Rfou, and Steven Skiena. Deepwalk: Online learning of social repre- sentations. In Proceedings of the 20th ACM SIGKDD In- ternational Conference on Knowledge Discovery and Data Mining, pages 701-710, 2014.
- [Qiu et al., 2020] Jiezhong Qiu, Qibin Chen, Yuxiao Dong, Jing Zhang, Hongxia Yang, Ming Ding, Kuansan Wang, and Jie Tang. GCC: graph contrastive coding for graph neural network pre-training. In Proceedings of the 26th ACM SIGKDD International Conference on Knowledge Discovery and Data Mining, pages 1150-1160, 2020.
- [Schulman et al., 2016] John Schulman, Philipp Moritz, Sergey Levine, Michael I. Jordan, and Pieter Abbeel. High-dimensional continuous control using generalized advantage estimation. In The 4th International Conference on Learning Representations, 2016.
- [Sen et al., 2008] Prithviraj Sen, Galileo Namata, Mustafa Bilgic, Lise Getoor, Brian Galligher, and Tina Eliassi-Rad. Collective classification in network data. AI Magazine, 29(3):93-106, 2008.
- [Shchur et al., 2018] Oleksandr Shchur, Maximil- ian Mumme, Aleksandar Bojchevski, and Stephan Günnemann. Pitfalls of graph neural network evaluation. arXiv preprint arXiv:1811.05868, 2018.
- [Shen et al., 2023] Xiao Shen, Dewang Sun, Shirui Pan, Xi Zhou, and Laurence T. Yang. Neighbor contrastive learning on learnable graph augmentation. In Proceed- ings of the 37th AAAI Conference on Artificial Intelligence, pages 9782-9791, 2023.
- [Shi et al., 2024] Jinsong Shi, Pan Gao, and Jie Qin. Transformer-based no-reference image quality assessment via supervised contrastive learning. In Proceedings of the 38th AAAI Conference on Artificial Intelligence, pages 4829-4837, 2024.
- [Song et al., 2023] Zixing Song, Yifei Zhang, and Irwin King. Optimal block-wise asymmetric graph construction for graph-based semi-supervised learning. In Proceedings of the 36th Advances in Neural Information Processing Systems, 2023.
- [Sun et al., 2020] Fan-Yun Sun, Jordan Hoffmann, Vikas Verma, and Jian Tang. Infograph: Unsupervised and semi- supervised graph-level representation learning via mutual information maximization. In The 8th International Con- ference on Learning Representations, 2020.
- [Tian et al., 2021] Yuandong Tian, Xinlei Chen, and Surya Ganguli. Understanding self-supervised learning dynam- ics without contrastive pairs. In Proceedings of the 38th International Conference on Machine Learning, pages 10268-10278, 2021.
- [Veličković et al., 2017] Petar Veličković, Guillem Cucurull, Arantxa Casanova, Adriana Romero, Pietro Lio, and Yoshua Bengio. Graph attention networks. arXiv preprint arXiv:1710.10903, 2017.
- [Velickovic et al., 2019] Petar Velickovic, William Fedus, William L. Hamilton, Pietro Liò, Yoshua Bengio, and R. Devon Hjelm. Deep graph infomax. In The 7th Inter- national Conference on Learning Representations, 2019.
- [Wang et al., 2023] Hanchen Wang, Jean Kaddour, Shengchao Liu, Jian Tang, Joan Lasenby, and Qi Liu. Evaluating self-supervised learning for molecular graph embeddings. In Proceedings of the 36th Advances in Neural Information Processing Systems, 2023.
- [Xia et al., 2022] Jun Xia, Lirong Wu, Ge Wang, Jintao Chen, and Stan Z. Li. Progcl: Rethinking hard negative mining in graph contrastive learning. In Proceedings of the 39th International Conference on Machine Learning, pages 24332-24346, 2022.
- [Xiao et al., 2023a] Teng Xiao, Huaisheng Zhu, Zhengyu Chen, and Suhang Wang. Simple and asymmetric graph contrastive learning without augmentations. In Proceed- ings of the 36th Advances in Neural Information Process- ing Systems, 2023.
- [Xiao et al., 2023b] Teng Xiao, Huaisheng Zhu, Zhengyu Chen, and Suhang Wang. Simple and asymmetric graph contrastive learning without augmentations. In Alice Oh, Tristan Naumann, Amir Globerson, Kate Saenko, Moritz Hardt, and Sergey Levine, editors, Proceedings of the 36th Advances in Neural Information Processing Systems, 2023.
- [Yang and Leskovec, 2012] Jaewon Yang and Jure Leskovec. Defining and evaluating network commu- nities based on ground-truth. In Proceedings of the 12nd IEEE International Conference on Data Mining, pages 745-754, 2012.
- [You et al., 2020] Yuning You, Tianlong Chen, Yongduo Sui, Ting Chen, Zhangyang Wang, and Yang Shen. Graph con- trastive learning with augmentations. In Proceedings of the 33rd Advances in Neural Information Processing Systems, 2020.
- [You et al., 2021] Yuning You, Tianlong Chen, Yang Shen, and Zhangyang Wang. Graph contrastive learning auto- mated. In Marina Meila and Tong Zhang, editors, Pro- ceedings of the 38th International Conference on Machine Learning, volume 139, pages 12121-12132, 2021.
- [Yu et al., 2023] Yue Yu, Xiao Wang, Mengmei Zhang, Nian Liu, and Chuan Shi. Provable training for graph con- trastive learning. In Proceedings of the 36th Advances in Neural Information Processing Systems, 2023.
- [Zhang et al., 2023] Yifei Zhang, Hao Zhu, Zixing Song, Pi- otr Koniusz, and Irwin King. Spectral feature augmenta- tion for graph contrastive learning and beyond. In Brian Williams, Yiling Chen, and Jennifer Neville, editors, Pro- ceedings of the 37th AAAI Conference on Artificial Intelli- gence, pages 11289-11297, 2023.
- [Zhao et al., 2021] Han Zhao, Xu Yang, Zhenru Wang, Erkun Yang, and Cheng Deng. Graph debiased contrastive learning with joint representation clustering. In Proceed- ings of the 30th International Joint Conference on Artifi- cial Intelligence, pages 3434-3440, 2021. IJCAI
- [Zhu et al., 2020] Yanqiao Zhu, Yichen Xu, Feng Yu, Qiang Liu, Shu Wu, and Liang Wang. Deep graph contrastive representation learning. CoRR, abs/2006.04131, 2020.
- [Zhu et al., 2021] Yanqiao Zhu, Yichen Xu, Feng Yu, Qiang Liu, Shu Wu, and Liang Wang. Graph contrastive learning with adaptive augmentation. In Proceedings of the Web Conference, pages 2069-2080, 2021.
References were extracted automatically from the PDF and may contain errors.
Full text extracted automatically from the PDF; figures, tables and equations may differ. The PDF is the version of record.
1 Introduction
Graph data as a type of complex non-Euclidean data, is widely used in applications such as social networks, recommendation systems, and biological networks [Meng et al., 2024]. With its intricate structure and diverse attributes, obtaining effective graph representations is crucial for improving the performance of downstream tasks. However, traditional graph data analysis methods rely on supervised or semi-supervised paradigms and obtaining high-quality labeled data is often challenging [Chen et al., 2020a; Peng et al., 2020; Song et al., 2023]. Recently, graph self-supervised learning, which uses pretext tasks to extract meaningful supervisory signals for downstream tasks, has emerged as a key technique to reduce label dependency [Tian et al., 2021; Baevski et al., 2022; Wang et al., 2023]. Among these, graph contrastive learning (GCL) has gained prominence due to its exceptional performance [Li et al., 2021; Xiao et al.,
* Co-corresponding authors
2023a]. It generates contrastive views through data augmentation, bringing positive examples closer and negative examples further away in the embedding space, thereby producing discriminative representations.
The success of current GCL relies on the choice of data augmentation and contrastive objectives. Data augmentation generates multiple views by perturbing the graph structure or properties to capture invariances and obtain general representations [Liu et al., 2024; Zhang et al., 2023; Xiao et al., 2023b]. On the other hand, contrastive objectives guide the learning process by selecting positive and negative sample pairs, aiming to maximize the similarity between positive samples and minimize the similarity between negative samples, thereby improving the model's generalization ability [Xia et al., 2022; Niu et al., 2024].
However, existing methods often treat data augmentation and contrastive objectives as separate processes, lacking a deep understanding of the potential relationship between them. In such frameworks, the data augmentation strategy may not be well-aligned with the contrastive objective, resulting in the failure to fully capture the complex structural relationships between nodes and edges in the graph. Furthermore, due to the independent optimization of data augmentation and contrastive objectives, the model may learn conflicting embeddings that fail to capture deeper semantic information in the graph. As a result, the lack of a unified guiding principle between the augmentation strategy and contrastive objectives in current GCL methods hinders the quality of the learned embeddings. And, as an unsupervised learning paradigm, GCL lacks explicit label information, leading to ambiguous boundaries between classes and increasing the uncertainty in positive and negative sample selection.
To address this issue, we propose an Uncertainty-guided Graph Contrastive Learning (UGCL) algorithm, which systematically optimizes the interaction between data augmentation and contrastive objectives through a unified uncertainty measure. Specifically, we introduce sample uncertainty to quantify the degree of class ambiguity in graph data. This metric plays a core role throughout the entire life cycle of GCL, effectively aligning data augmentation with contrastive objectives. On this basis, we construct a homogeneity matrix to generate multi-scale augmented views and design a weighted graph contrastive loss to further optimize the contrastive learning process. Through the unified perspective of uncertainty, our method effectively aligns the selection of data augmentation and contrastive objectives, ensuring their collaborative optimization and significantly enhancing the quality of graph embeddings. In conclusion, the main contributions of our method can be summarized as follows:
- Introduction of Unified Perspective: We propose a unified perspective to jointly optimize data augmentation and contrast objectives for Graph Contrastive Learning.
- Uncertainty-guided Learning Process: Based on sample uncertainty, we propose a multi-scale data augmentation strategy and a weighted graph contrastive loss to enhance the quality of learned embeddings.
- Theoretical and Experimental Verification: We provide theoretical proofs to support the proposed method and demonstrate its effectiveness through extensive experiments in various tasks, such as node classification, node clustering, and link prediction.
2 RelatedWork
2.1 Graph Contrastive Learning
Contrastive learning is a self-supervised learning method primarily used to learn low-dimensional embeddings, where similar samples are placed closer in the embedding space, and dissimilar samples are farther apart [Hassani and Ahmadi, 2020; Sun et al., 2020; Luo et al., 2023]. Recently, contrastive learning has achieved significant unsupervised performance in computer vision, with methods such as MOCO [He et al., 2020], BYOL [Grill et al., 2020], and others [Ma et al., 2024; Shi et al., 2024], which has also inspired its application to graph data. To date, many graph contrastive learning (GCL) methods have been proposed to enhance graph representation learning. For example, DGI [Velickovic et al., 2019] learns node embeddings by maximizing the mutual information between local node features and global graph features. GCC [Qiu et al., 2020] designs a pretext task for subgraph instance recognition within the network. POT [Yu et al., 2023] regularizes GCL training to better encode node embeddings that follow GCL principles.
2.2 Graph Contrastive Learning Paradigms
Most existing graph contrastive learning methods focus on either data augmentation or contrastive objective selection. Data augmentation-based methods, such as GraphCL [You et al., 2020], systematically investigate the impact of various combinations of graph data augmentations on multiple tasks by designing four different graph data augmentation scenarios. Based on GRACE [Zhu et al., 2020], GCA [Zhu et al., 2021] preserves important structural and attribute features in graph data, forcing the model to identify underlying semantic information. JOAO [You et al., 2021] automatically combines different augmentation strategies. NCLA [Shen et al., 2023] uses a multi-head attention mechanism to generate augmented views, effectively avoiding the use of extensive prior knowledge. In terms of contrastive objective selection, positive samples are chosen based on corresponding nodes in augmented views, while various methods for selecting negative samples have been proposed. For example, GDCL [Zhao et al., 2021] suggests using clustering results from GCL to eliminate false negatives and reduce their occurrence. CUCO [Chu et al., 2021] introduces a curriculum learning method, designing scoring and pacing functions to select appropriate negative samples from the negative sample pool. ProGCL [Xia et al., 2022] proposes mining hard negative samples by fitting the negative sample distribution and avoiding the selection of similar neighboring nodes as negative samples to mitigate false negatives. AUGCL [Niu et al., 2024] introduces the concept of affinity uncertainty and applies it to measure hard negative samples. However, the above graph contrastive learning methods primarily focus on either augmentation strategies or contrastive objective selection, neglecting the potential interplay between the two, which limits the quality of graph contrastive learning embeddings.
3 Methodology
In this section, we first present the problem formulation. Then we introduce the sample uncertainty in GCL, which serves as the foundation for our multi-scale data augmentation strategy and weighted graph contrastive loss.
3.1 Problem Statement
Let G = (V, E) represent a graph, where V = {v1, v2, . . . , vN} is the set of nodes and E ⊆ V × V is the set of edges. X ∈ RN×F denotes the node feature matrix, where each node is associated with a F-dimensional feature vector, and A ∈ {0, 1}N×N represents the adjacency matrix, which describes the connections between nodes. The objective of UGCL is to learn a GNN encoder f (X, A) ∈ RN×F ′ that embeds nodes into a low-dimensional space without relying on label information. The core formula for the encoder
where ˜ A represents the adjacency matrix of the graph plus a self-connection term I, ˜D represents the degree matrix of ˜ A, W represents the weight matrix, and σ is the activation function.
Most mainstream GCL methods are similarities with the InfoNCE objective, where the training objective for each positive pair is to:
where F(·, ·) = exp (θ(·, ·)/τ), θ(·, ·) = s(g(·), g(·)), here s(·, ·) is the cosine similarity and g(·) is the linear projection to augment the expressive power [Chen et al., 2020b], and τ is the temperature coefficient. Owing to the symmetry of these two views, the overall loss is defined as the average of all positive pairs:
3.2 The ProposedModel: UGCL
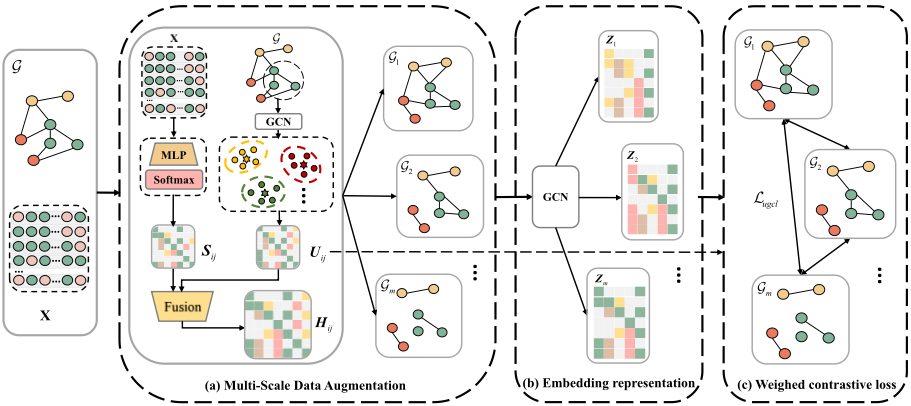
Most existing GCL methods focus on optimizing either data augmentation or contrastive objectives independently, neglecting their potential interaction, which leads to suboptimal embedding quality. Therefore, we develop an algorithm utilizes a unified perspective on uncertainty to enhance GCL. The entire algorithm framework is illustrated in Figure 1.
Introduction of Sample Uncertainty
In GCL, we introduce sample uncertainty to quantify the degree of class ambiguity, and assign an uncertainty measure to each sample. Sample uncertainty refers to the degree of variation in a sample's distance to various cluster centers, which indicates class uncertainty. Specifically, we first obtain the node embeddings by applying parameter-shared GCN to the original views. Then, we use the K-means algorithm based on these embeddings to obtain K cluster centers {µ1, µ2, . . . , µk}, and compute the distance dij from node zi to node µj in each cluster:
Then, calculate the standard deviation to quantify this uncertainty. The specific formula is as follows:
where σi represents the uncertainty of node vi, which is calculated based on the variance of its distances to all cluster centers. lk k∑ j ′=1 dij ′ is the average distance fromnode vi to the
k cluster centers. σi measures the distributional variation of node vi relative to all cluster centers in the embedding space. Therefore, a smaller calculated standard deviation indicates higher uncertainty of the node. The uncertainty matrix between node pairs (vi,vj ) based on node uncertainty is defined as follows:
here, z is the embedding representation of the node, ∥zi - zj∥ represents the Euclidean distance between node pairs, and C is a scaling constant, typically set to 1. The uncertainty between node pairs is highest when and only when both ∥zi - zj∥ and σi are small, making node vj more likely to be a hard negative example relative to node vi. This lays the foundation for building a unified perspective on GCL.
Multi-Scale Data Augmentation
As shown in Figure 1, we first construct a similarity matrix before the data augmentation phase. The purpose of this matrix is to perform an initial screening of samples. The construction process involves several steps. Firstly, an MultiLayer Perceptron (MLP) is employed as a feature extractor. After applying the MLP to the node features of the original view, a Softmax operation is performed to obtain the node embedding matrix. Since the MLP does not involve neighborhood aggregation, it effectively preserves the discriminative power of the samples. The specific formula is as follows:
Next, we compute the similarity matrix between each pair of nodes by performing the dot product of the matrix of the obtained node embeddings with its transpose. Based on the obtained similarity matrix, we calculate the median of the similarities between all samples and the anchor points, denoted as Sme. Similarities lower than this median are masked as 0. These negative samples, having a significant similarity gap with the anchor points, can be considered as samples of a different class from the anchor points. This results in an similarity matrix, with the specific formula given as follows:
In order to explore the deep connection between data augmentation and contrast objectives, we consider the advantages of difficult samples from the perspective of multi-scale data augmentation and construct a homogeneous matrix Hij based on the uncertainty matrix Uij obtained from node pairs. The aim is to reduce the connections between nodes of different classes in various augmentation views and learn the invariance of hard negative samples across augmentation views at different scales. Specifically, we generate εm = KN(K ∈ 1, 2, 3, ...; m = 1, ..., M) edges based on the number of nodes N, establishing the edge connections and thus reconstructing the adjacency matrix. The specific formulas are as follows:
where Hij is the probability matrix for nodes of the same class, which favors pairs of nodes being of the same class. The enhancement of node features is achieved by randomly masking nodes. Specifically, it refers to the node features randomly generated based on all node attributes. The calculation formula is as follows:
here, ˜Xm represents randomly generated node features; ◦ denotes element-wise multiplication; ˜m ∈ {0, 1}D is a randomly sampled vector, and D is the dimension of the random vector, with each dimension independently drawn from a Bernoulli distribution. Finally, based on the obtained edge and node feature enhancements, the final enhanced view is obtained, as specified by the following formula:
Weighted Graph Contrastive Loss
Based on the obtained uncertainty matrix Uij , we construct a weighted graph contrastive loss by multiplying Uij with the negative samples in each pair of views. This increases the weight of hard negative samples in the contrastive target from an uncertainty perspective. The specific formula is as follows:
where
F(·, ·) = exp (θ(·, ·)/τ). Based on view symmetry, the total loss of the UGCL can be defined as the average of all positive pairs, with the specific formula as follows:
Update the GCN encoder parameters through the total loss. The entire algorithm is shown in Appendix A.
3.3 Theoretical analysis of UGCL
To gain a deeper understanding of the core mechanism of UGCL, we leverage the adjusted triplet loss as an intermediate bridge to analyze the role of sample uncertainty in contrastive learning. By introducing the uncertainty measure Uik between sample pairs during the data augmentation phase and designing an adaptive margin mik = (τ/2)/ logUik, our method dynamically adjusts the decision boundary between positive and negative sample pairs, achieving collaborative optimization between data augmentation and contrastive target selection.
We further propose the following theorem to demonstrate how UGCL improves the optimization of hard negative samples through the adjusted triplet loss and theoretically validate its effectiveness:
Theorem 3.1. Let G be a graph with N nodes V = {v1, v2, . . . , vN}, G1, G2, . . . , Gm is the M views generated by multi-scale data augmentation. Randomly given two view embeddings U, V ∈ RF ′ fromM views. When the projection function is the identity function and Uik is the metric for measuring sample uncertainty between node pairs. The greater the value of Uik, the node uk is more likely to be a hard negative sample based on anchor ui. Minimizing the loss function Eq (14) is equivalent to minimizing the adjusted triplet loss with an adaptive margin mik = (τ/2)/logUik, the following is abbreviated as:
l (ui, vi)
Detailed proofs can be found in Appendix B. We can see that the optimal embeddings for Eq(14) are equivalent to optimizing the following objectives:
where mik = (τ/2)/ logUik, and Uik is a measure of the uncertainty between node pairs. The formula Eq (17)
can be rewritten as mik ≤ ∥ui - vi∥22 - ∥ui - vk∥22 and mik ≤ ∥ui - vi∥22 - ∥ui - uk∥22 . Assuming ∥ui - vi∥22 remains approximately fixed, a decrease in mik imposes looser constraints on ∥ui - vk∥22 and ∥ui - uk∥22 , allowing them to increase during optimization. The underlying reason is that mik, as an adaptive margin, dynamically adjusts the decision boundary, reducing the strict constraints on hard negative samples. This enables the model to handle negative samples more flexibly, thereby achieving a more balanced coordination between data augmentation and contrastive objective.
This theorem fully demonstrates UGCL's ability to optimize under a unified perspective. The key lies in effectively coordinating the overall optimization objectives through sample uncertainty, which is consistent with the goal of graph contrastive learning.
4 Experiments
This section evaluates the proposed method by detailing the datasets, experimental settings, and assessing model performance in key tasks such as node classification, clustering, and link prediction. It also presents findings from ablation studies and hyperparameter analysis.
4.1 Experimental Setup
Dataset. This paper evaluates the proposed method using six commonly used datasets, including four citation networks (Cora [Sen et al., 2008], Citeseer [Sen et al., 2008], Pubmed [Sen et al., 2008], and DBLP [Yang and Leskovec, 2012]) and two Amazon co-purchase networks (Amazon-Computers [Shchur et al., 2018] and Amazon-Photo [Shchur et al., 2018]). Detailed dataset information is provided in Table 1. In the citation networks, nodes represent articles, and edges indicate citation relationships. In the Amazon co-purchase networks, nodes represent products, with edges connecting frequently co-purchased items. Each dataset contains a node feature matrix X and a graph structure matrix A.
| Datasets | Nodes | Edges | Features | Classes |
|---|---|---|---|---|
| Cora | 2,708 | 5,429 | 1,433 | 7 |
| Citeseer | 3,327 | 4,732 | 3,703 | 6 |
| Pubmed | 19,717 | 44,338 | 500 | 3 |
| DBLP | 17,716 | 52,867 | 1,639 | 4 |
| Amazon-Computers | 13,752 | 245,861 | 767 | 10 |
| Amazon-Photo | 7,650 | 119,081 | 745 | 8 |
Implementation Details. In the experiments, the algorithm proposed in this paper was implemented using the Python programming language and the PyTorch framework. For each dataset, we follow the experimental setup of GCA [Zhu et al., 2021], 10%, 10%, and 80% of the nodes were allocated for training, validation, and testing, respectively.
4.2 Node Classification
Node classification involves assigning each node in a graph to a predefined class. The procedure starts with learning node embeddings in an unsupervised way, followed by classifying the nodes using a logistic regression model based on these embeddings.
ComparisonMethods. To assess the node classification performance of our method, we compare it with two types of representative algorithms: traditional methods like DeepWalk [Perozzi et al., 2014] and deep learning methods such as GAE [Schulman et al., 2016], VGAE [Kipf and Welling, 2016], GAT [Veliˇckovi´c et al., 2017], DGI [Velickovic et al., 2019], GRACE [Zhu et al., 2020], GCA [Zhu et al., 2021], GDCL [Zhao et al., 2021], ProGCL [Xia et al., 2022], and AUGCL [Niu et al., 2024].
Results Analysis. Table 2 shows that our model improves performance across six public datasets by addressing the misalignment between data augmentation and contrastive objectives in existing GCL methods. By using sample uncertainty from UGCL, our approach identifies hard negative examples, preserves homophily, and removes edges between nodes of different classes. This unified framework captures complex graph structures and enhances the semantic depth of embeddings, significantly boosting GCL performance.
4.3 Node Clustering
Node clustering seeks to partition nodes in graph data into distinct clusters. A cluster is formed by closely connected nodes sharing similar attributes. This paper generates node embeddings using UGCL and applies K-means to produce the clustering results.
ComparisonMethods. To evaluate the node clustering performance of the proposed method, the paper uses Accuracy (ACC), Normalized Mutual Information (NMI), and Adjusted Rand Index (ARI) to measure the quality of the clustering results. Specifically, experiments are conducted on the Cora, Citeseer, and Pubmed datasets, and comparisons are made with the following baseline methods: Spectral[Ng et al., 2001], K-means[Hartigan and Wong, 1979], GAE[Pan et al., 2018], VGAE[Kipf and Welling, 2016], ARVGA[Pan et al., 2018], GRACE[Zhu et al., 2020], GCA[Zhu et al., 2021], GDCL[Zhao et al., 2021], ProGCL[Xia et al., 2022]], and AUGCL[Niu et al., 2024].
Results Analysis. Table 3 shows that the proposed method significantly outperforms baseline methods on the Cora, CiteSeer, and PubMed citation network datasets, while the experimental results on the DBLP, Computers, and Photo datasets are provided in Appendix C. UGCL unifies data augmentation and contrastive objectives, enabling better capture of deep semantic information in complex graph structures and effectively distinguishing different clusters, demonstrating superior performance in node clustering tasks.
4.4 Link Prediction
Link prediction identifies potential edges between nodes in a graph using data from known nodes and edges. In the experiments, UGCL generates node embeddings, which are subsequently used for link prediction.
Comparison Methods. To evaluate the link prediction performance of the proposed method, the Area Under Curve (AUC) and Average Precision (AP) are employed to measure the quality of the link prediction results. Specifically, experiments are conducted on the Cora, Citeseer, and Pubmed datasets, and comparisons are made with the following baseline methods: Spectral [Ng et al., 2001], DeepWalk [Perozzi et al., 2014], GAE [Schulman et al., 2016], VGAE [Kipf and Welling, 2016], ARVGA [Pan et al., 2018], GRACE [Zhu et al., 2020], GCA [Zhu et al., 2021], GDCL [Zhao et al., 2021], ProGCL [Xia et al., 2022], and AUGCL [Niu et al., 2024].
| Methods | Cora | CiteSeer | PubMed | DBLP | Computers | Photo | Avg |
|---|---|---|---|---|---|---|---|
| DeepWalk[Perozzi et al., 2014] | 70.7±0.25 | 51.4±0.36 | 74.3±0.18 | 75.9±0.10 | 85.6±0.07 | 89.4±0.05 | 74.5 |
| GAE[Schulman et al., 2016] | 71.5±0.39 | 60.6±0.43 | 72.1±0.27 | 81.2±0.07 | 85.2±0.13 | 91.6±0.06 | 77.0 |
| VGAE[Kipf andWelling, 2016] | 78.9±0.26 | 61.2±0.59 | 79.0±0.35 | 81.7±0.05 | 86.3±0.15 | 92.2±0.07 | 79.8 |
| GAT[Veliˇckovi´c et al., 2017] | 83.0±0.30 | 72.5±0.65 | 79.0±0.40 | 81.5±0.03 | 85.2±0.09 | 91.2±0.05 | 82.0 |
| DGI[Velickovic et al., 2019] | 83.8±0.36 | 72.0±0.72 | 76.8±0.45 | 83.2±0.15 | 83.9±0.05 | 91.6±0.09 | 81.9 |
| GRACE[Zhu et al., 2020] | 83.2±0.75 | 72.1±1.51 | 86.7±0.19 | 84.1±0.34 | 86.8±0.32 | 91.8±0.15 | 84.1 |
| GCA[Zhu et al., 2021] | 83.7±0.79 | 72.5±1.29 | 86.8±0.21 | 84.2±0.23 | 87.5±0.35 | 92.2±0.43 | 84.4 |
| GDCL[Zhao et al., 2021] | 84.5±0.59 | 72.8±1.13 | 81.5±0.35 | 82.1±0.42 | 85.9±0.50 | 90.1±0.59 | 83.0 |
| ProGCL[Xia et al., 2022] | 83.7±0.45 | 72.7±1.09 | 85.9±0.26 | 83.7±0.36 | 88.1±0.43 | 93.2±0.32 | 84.6 |
| AUGCL[Niu et al., 2024] | 84.2±0.43 | 72.6±1.25 | 85.5±0.35 | 84.1±0.26 | 88.9±0.39 | 93.6±0.53 | 84.8 |
| Ours | 85.8±0.35 | 73.7±1.01 | 87.7±0.20 | 85.3±0.19 | 88.5±0.26 | 93.7±0.31 | 85.8 |
| Methods | Cora | Citeseer | PubMed | ||||||
|---|---|---|---|---|---|---|---|---|---|
| ACC | NMI | ARI | ACC | NMI | ARI | ACC | NMI | ARI | |
| Spectral | 36.7 | 12.6 | 3.1 | 23.8 | 5.5 | 1.0 | 52.8 | 9.7 | 6.2 |
| K-means | 49.2 | 32.1 | 22.9 | 54.0 | 30.5 | 27.8 | 59.5 | 31.5 | 28.1 |
| GAE | 59.6 | 42.9 | 34.7 | 40.8 | 17.6 | 12.4 | 67.2 | 27.7 | 27.9 |
| VGAE | 50.2 | 32.9 | 25.4 | 46.7 | 26.0 | 20.5 | 63.0 | 22.9 | 21.3 |
| ARVGA | 64.0 | 45.0 | 37.4 | 54.4 | 26.1 | 24.5 | 69.0 | 29.0 | 30.6 |
| GRACE | 64.6 | 47.5 | 44.2 | 65.5 | 39.8 | 39.5 | 69.3 | 36.1 | 35.1 |
| GCA | 65.5 | 50.5 | 49.6 | 65.7 | 40.5 | 39.7 | 69.5 | 33.5 | 32.0 |
| GDCL | 68.2 | 55.1 | 51.0 | 67.5 | 43.2 | 43.3 | 71.0 | 35.2 | 34.3 |
| ProGCL | 66.5 | 51.2 | 49.5 | 66.2 | 39.3 | 39.5 | 70.1 | 35.3 | 36.1 |
| AUGCL | 66.8 | 53.2 | 48.7 | 65.8 | 39.5 | 39.2 | 70.3 | 37.3 | 37.1 |
| Ours | 69.7 | 54.9 | 52.8 | 67.9 | 42.3 | 41.5 | 72.0 | 39.6 | 39.5 |
Results Analysis. Table 4 shows that the UGCL method significantly outperforms baseline methods on the Cora, CiteSeer, and PubMed citation network datasets, while the experimental results on the DBLP, Computers, and Photo datasets are provided in Appendix C. It performs well across different datasets, highlighting its potential in link prediction tasks.
4.5 Ablation Experiment
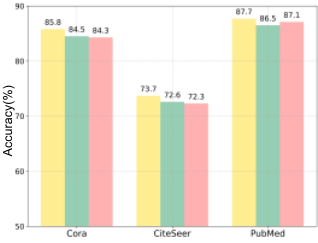
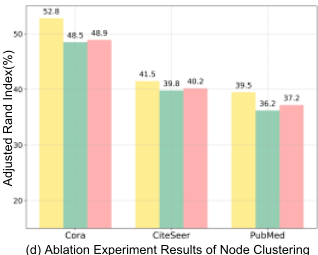
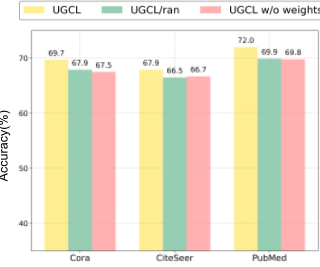
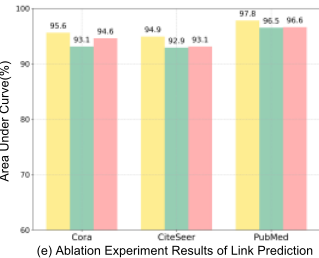
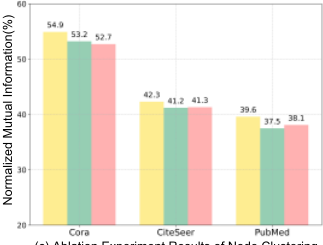
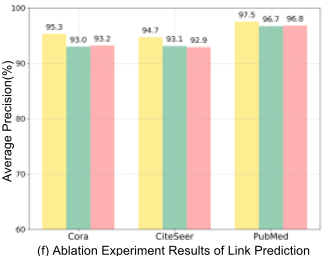
This section includes two ablation experiments to evaluate the model components. The first experiment focuses on the effect of data augmentation with sample uncertainty, while the second investigates the weighted graph contrastive loss. The results of these experiments are illustrated in Figure 2.
Multi-Scale Data augmentation. In this section, the data augmentation based on sample uncertainty is replaced with random edge dropping to compare and evaluate its effectiveness in the model. The results indicate that, compared to the baseline method UGCL/ran with random edge dropping, data augmentation based on sample uncertainty leads to significant improvements in tasks such as node classification, node clustering, and link prediction. This suggests that generating multi-scale augmentation views based on the sample uncertainty plays a crucial role in improving the discriminability of embedded representations.
| Methods | Cora | Citeseer | PubMed | |||
|---|---|---|---|---|---|---|
| AUC | AP | AUC | AP | AUC | AP | |
| Spectral | 84.6 | 88.5 | 80.5 | 85.0 | 84.2 | 87.8 |
| DeepWalk | 83.1 | 85.0 | 80.5 | 83.6 | 84.4 | 84.1 |
| GAE | 91.0 | 92.0 | 89.5 | 89.9 | 96.4 | 96.5 |
| VGAE | 91.4 | 92.6 | 90.8 | 92.0 | 94.4 | 94.7 |
| ARGE | 92.4 | 93.2 | 91.9 | 93.0 | 96.8 | 97.1 |
| ARVGA | 92.4 | 92.6 | 92.4 | 93.0 | 96.5 | 96.8 |
| GRACE | 90.9 | 91.0 | 92.1 | 92.2 | 97.0 | 97.1 |
| GCA | 91.4 | 91.5 | 92.0 | 92.6 | 96.3 | 96.5 |
| GDCL | 91.7 | 90.9 | 91.9 | 92.0 | 96.5 | 96.3 |
| ProGCL | 92.9 | 93.5 | 93.1 | 93.3 | 96.1 | 96.7 |
| AUGCL | 93.3 | 93.2 | 92.5 | 92.8 | 96.3 | 96.5 |
| Ours | 95.6 | 95.3 | 94.9 | 94.7 | 97.8 | 97.5 |
Weighted Graph Contrastive Loss. This paper removes the weighted graph contrastive loss based on the sample uncertainty to verify its effectiveness. The experimental results demonstrate that the weighted graph contrastive loss in this paper significantly improves the performance of node classification, node clustering, and link prediction. This indicates that the weighted graph contrastive loss based on the sample uncertainty has a significant role in GCL.
4.6 Hyperparameter Analysis
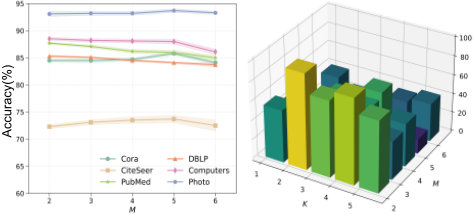
This section analyzes how the choice of parameters affects the performance of the proposed model. It specifically examines how different hyperparameter settings influence the performance of UGCL on various metrics in the node classification task. The results of these experiments are illustrated in Figure 3.
The Number of Views M. This section examines the optimal number of views for our method across different
(a) Ablation Experiment Results of Node Classification
(b) Ablation Experiment Results of Node Clustering
(c) Ablation Experiment Results of Node Clustering
(a) Analysis of parameter M
(b) Analysis of parameter M and K on PubMed
Figure 3: Hyperparameter Analysis Experiment Results.
datasets. Figure 3(a) displays the performance changes with varying numbers of views M across six public datasets. Our experiments reveal that increasing the number of views enhances performance on the Cora, Citeseer, and AmazonPhoto datasets, with the best results occurring at five views. Beyond this point, adding more views either stabilizes or decreases performance, indicating that the optimal number of views is key to capturing the essential features of these datasets. Conversely, the PubMed, DBLP, and AmazonComputers datasets achieve optimal performance with just two views.
The Number of Views M and Edge Retention Ratio K. This section studies the relationship between the number of views M and the edge retention ratios K of the proposed method in different datasets. As illustrated in Figure 3(b), experiments were conducted on the PubMed dataset, with additional datasets detailed in Appendix C. In each view, the minimum number of edges was set to KN, with subsequent values at 2KN, 3KN, etc. Experimental results show that smaller datasets require larger numbers of views M and higher edge retention ratio K, while larger datasets benefit from fewer views and lower K values. This is because smaller datasets have less inherent information, necessitating increased views and edge density to enhance feature diversity and aid learning. Conversely, larger datasets, being more information-rich, require fewer views and lower edge density to avoid redundancy and reduce noise. These findings confirm the effectiveness of our multi-scale data augmentation strategy.
5 Conclusion
This paper proposes an uncertainty-guided graph contrastive learning (UGCL) method, which considers the deep connection between data augmentation and contrastive objectives from a unified perspective. Based on the proposed sample uncertainty measure, we design a multi-scale data augmentation strategy and a weighted graph contrastive loss, which significantly improve the embedding quality. This paper provides theoretical proofs for the proposed method and validates its effectiveness through extensive experiments.
Acknowledgments
This work is supported by the National Natural Science Foundation of China (No.62376142, U21A20473, 62306205) and the Fundamental Research Program of Shanxi Province (202403021211086).
@inproceedings{ijcai2025p629,
  title     = {Uncertainty-guided Graph Contrastive Learning from a Unified Perspective},
  author    = {Li, Zhiqiang and Wang, Jie and Liang, Jianqing and Cui, Junbiao and Zhao, Xingwang and Liang, Jiye},
  booktitle = {Proceedings of the Thirty-Fourth International Joint Conference on
               Artificial Intelligence, {IJCAI-25}},
  publisher = {International Joint Conferences on Artificial Intelligence Organization},
  editor    = {James Kwok},
  pages     = {5653--5661},
  year      = {2025},
  month     = {8},
  note      = {Main Track},
  doi       = {10.24963/ijcai.2025/629},
  url       = {https://doi.org/10.24963/ijcai.2025/629},
}
TY - CPAPER TI - Uncertainty-guided Graph Contrastive Learning from a Unified Perspective AU - Li, Zhiqiang AU - Wang, Jie AU - Liang, Jianqing AU - Cui, Junbiao AU - Zhao, Xingwang AU - Liang, Jiye T2 - Proceedings of the Thirty-Fourth International Joint Conference on Artificial Intelligence, IJCAI-25 PB - International Joint Conferences on Artificial Intelligence Organization PY - 2025 SP - 5653 EP - 5661 DO - 10.24963/ijcai.2025/629 UR - https://doi.org/10.24963/ijcai.2025/629 ER -Copied
Machine-readable versions of this paper, for tools and AI agents:





