
RTdetector: Deep Transformer Networks for Time Series Anomaly Detection Based on Reconstruction Trend
Proceedings of the Thirty-Fourth International Joint Conference on Artificial Intelligence. Main Track. Pages 5788-5796.
https://doi.org/10.24963/ijcai.2025/644
Keywords
- Machine Learning: ML: Time series and data streams
- Machine Learning: ML: Unsupervised learning
Abstract
Anomaly detection in multivariate time series data is critical across a variety of real-life applications. The predominant anomaly detection techniques currently rely on reconstruction-based methods. However, these methods often overfit the abnormal pattern and fail to diagnose the anomaly. Although some studies have attempted to prevent the incorrect fitting of anomalous data by enabling models to learn the trend of data variations, they fail to account for the dynamic nature of data distribution. This oversight can lead to the erroneous reconstruction of anomalies that do not exist. To address these challenges, we propose RTdetector, a Transformer-based time series anomaly detection model leveraging reconstruction trends. RTdetector employs a novel global attention mechanism based on reconstruction trends to learn distinguishable attention from the original sequence, thereby preserving the global trend information intrinsic to the time series. Additionally, it incorporates a self-conditioning transformer, based on reconstruction trend enhancement to achieve superior predictive performance. Extensive experiments on four datasets demonstrate that RTdetector achieves state-of-the-art results in multivariate time series data anomaly detection. Our code is available at https://github.com/CSUFUNLAB/RTdetector.
- [Abdulaal et al., 2021] Ahmed Abdulaal, Zhuanghua Liu, and Tomer Lancewicki. Practical approach to asyn- chronous multivariate time series anomaly detection and localization. In Proceedings of the 27th ACM SIGKDD conference on knowledge discovery & data mining, pages 2485-2494, 2021.
- [Audibert et al., 2020] Julien Audibert, Pietro Michiardi, Frédéric Guyard, Sébastien Marti, and Maria A Zuluaga. Usad: Unsupervised anomaly detection on multivariate time series. In Proceedings of the 26th ACM SIGKDD international conference on knowledge discovery & data mining, pages 3395-3404, 2020.
- [Dau et al., 2019] Hoang Anh Dau, Anthony Bagnall, Kaveh Kamgar, Chin-Chia Michael Yeh, Yan Zhu, Shaghayegh Gharghabi, Chotirat Ann Ratanamahatana, and Eamonn Keogh. The ucr time series archive. IEEE/CAA Journal of Automatica Sinica, 6(6):1293-1305, 2019.
- [Deng and Hooi, 2021] Ailin Deng and Bryan Hooi. Graph neural network-based anomaly detection in multivariate time series. In Proceedings of the AAAI conference on artificial intelligence, volume 35, pages 4027-4035, 2021.
- [Ergen and Kozat, 2019] Tolga Ergen and Suleyman Serdar Kozat. Unsupervised anomaly detection with lstm neu- ral networks. IEEE transactions on neural networks and learning systems, 31(8):3127-3141, 2019.
- [Goldberger et al., 2000] Ary L Goldberger, Luis AN Ama- ral, Leon Glass, Jeffrey M Hausdorff, Plamen Ch Ivanov, Roger G Mark, Joseph E Mietus, George B Moody, Chung-Kang Peng, and H Eugene Stanley. Physiobank, physiotoolkit, and physionet: components of a new re- search resource for complex physiologic signals. circu- lation, 101(23):e215-e220, 2000.
- [Huet et al., 2022] Alexis Huet, Jose Manuel Navarro, and Dario Rossi. Local evaluation of time series anomaly detection algorithms. In Proceedings of the 28th ACM SIGKDD Conference on Knowledge Discovery and Data Mining, pages 635-645, 2022.
- [Hundman et al., 2018] Kyle Hundman, Valentino Con- stantinou, Christopher Laporte, Ian Colwell, and Tom Soderstrom. Detecting spacecraft anomalies using lstms and nonparametric dynamic thresholding. In Proceed- ings of the 24th ACM SIGKDD international conference on knowledge discovery & data mining, pages 387-395, 2018.
- [Jiang et al., 2024] Minqi Jiang, Chaochuan Hou, Ao Zheng, Songqiao Han, Hailiang Huang, Qingsong Wen, Xiyang Hu, and Yue Zhao. Adgym: Design choices for deep anomaly detection. Advances in Neural Information Pro- cessing Systems, 36, 2024.
- [Kim et al., 2021] Taesung Kim, Jinhee Kim, Yunwon Tae, Cheonbok Park, Jang-Ho Choi, and Jaegul Choo. Re- versible instance normalization for accurate time-series forecasting against distribution shift. In International Con- ference on Learning Representations, 2021.
- [Kingma and Ba, 2014] Diederik P Kingma and Jimmy Ba. Adam: A method for stochastic optimization. arXiv preprint arXiv:1412.6980, 2014.
- [Laptev et al., 2015] Nikolay Laptev, Saeed Amizadeh, and Ian Flint. Generic and scalable framework for automated time-series anomaly detection. In Proceedings of the 21th ACM SIGKDD international conference on knowl- edge discovery and data mining, pages 1939-1947, 2015.
- [Li et al., 2019] Dan Li, Dacheng Chen, Baihong Jin, Lei Shi, Jonathan Goh, and See-Kiong Ng. Mad-gan: Multi- variate anomaly detection for time series data with gener- ative adversarial networks. In International conference on artificial neural networks, pages 703-716. Springer, 2019.
- [Li et al., 2022] Longyuan Li, Junchi Yan, Qingsong Wen, Yaohui Jin, and Xiaokang Yang. Learning robust deep state space for unsupervised anomaly detection in contam- inated time-series. IEEE Transactions on Knowledge and Data Engineering, 35(6):6058-6072, 2022.
- [Lim et al., 2024] Willone Lim, Kelvin Yong Sheng Chek, Lau Bee Theng, and Colin Tan Choon Lin. Future of gen- erative adversarial networks (gan) for anomaly detection in network security: A review. Computers & Security, page 103733, 2024.
- [Moody and Mark, 2001] George B Moody and Roger G Mark. The impact of the mit-bih arrhythmia database. IEEE engineering in medicine and biology magazine, 20(3):45-50, 2001.
- [Nakamura et al., 2020] Takaaki Nakamura, Makoto Ima- mura, Ryan Mercer, and Eamonn Keogh. Merlin: Parameter-free discovery of arbitrary length anomalies in massive time series archives. In 2020 IEEE international conference on data mining (ICDM), pages 1190-1195. IEEE, 2020.
- [Paszke et al., 2019] Adam Paszke, Sam Gross, Francisco Massa, Adam Lerer, James Bradbury, Gregory Chanan, Trevor Killeen, Zeming Lin, Natalia Gimelshein, Luca Antiga, et al. Pytorch: An imperative style, high- performance deep learning library. Advances in neural in- formation processing systems, 32, 2019.
- [Ren et al., 2019] Hansheng Ren, Bixiong Xu, Yujing Wang, Chao Yi, Congrui Huang, Xiaoyu Kou, Tony Xing, Mao Yang, Jie Tong, and Qi Zhang. Time-series anomaly detec- tion service at microsoft. In Proceedings of the 25th ACM SIGKDD international conference on knowledge discov- ery & data mining, pages 3009-3017, 2019.
- [Schlegl et al., 2017] Thomas Schlegl, Philipp Seeböck, Se- bastian M Waldstein, Ursula Schmidt-Erfurth, and Georg Langs. Unsupervised anomaly detection with generative adversarial networks to guide marker discovery. In Inter- national conference on information processing in medical imaging, pages 146-157. Springer, 2017.
- [Schmidl et al., 2022] Sebastian Schmidl, Phillip Wenig, and Thorsten Papenbrock. Anomaly detection in time series: a comprehensive evaluation. Proceedings of the VLDB Endowment, 15(9):1779-1797, 2022.
- [Siffer et al., 2017] Alban Siffer, Pierre-Alain Fouque, Alexandre Termier, and Christine Largouet. Anomaly detection in streams with extreme value theory. In Proceedings of the 23rd ACM SIGKDD international conference on knowledge discovery and data mining, pages 1067-1075, 2017.
- [Su et al., 2019] Ya Su, Youjian Zhao, Chenhao Niu, Rong Liu, Wei Sun, and Dan Pei. Robust anomaly detection for multivariate time series through stochastic recurrent neu- ral network. In Proceedings of the 25th ACM SIGKDD international conference on knowledge discovery & data mining, pages 2828-2837, 2019.
- [Tuli et al., 2022] Shreshth Tuli, Giuliano Casale, and Nicholas R Jennings. Tranad: Deep transformer net- works for anomaly detection in multivariate time series data. VLDB Endowment, page 1201, 2022.
- [Vaswani et al., 2017] Ashish Vaswani, Noam Shazeer, Niki Parmar, Jakob Uszkoreit, Llion Jones, Aidan N Gomez, Łukasz Kaiser, and Illia Polosukhin. Attention is all you need. Advances in neural information processing systems, 30, 2017.
- [Wang et al., 2024] Chengsen Wang, Zirui Zhuang, Qi Qi, Jingyu Wang, Xingyu Wang, Haifeng Sun, and Jianxin Liao. Drift doesn't matter: Dynamic decomposition with diffusion reconstruction for unstable multivariate time se- ries anomaly detection. Advances in Neural Information Processing Systems, 36, 2024.
- [Wei et al., 2024] Chuheng Wei, Guoyuan Wu, and Matthew J Barth. Feature corrective transfer learn- ing: End-to-end solutions to object detection in non-ideal visual conditions. arXiv preprint arXiv:2404.11214, 2024.
- [Xie et al., 2024] Guoyang Xie, Jinbao Wang, Jiaqi Liu, Ji- ayi Lyu, Yong Liu, Chengjie Wang, Feng Zheng, and Yaochu Jin. Im-iad: Industrial image anomaly detection benchmark in manufacturing. IEEE Transactions on Cy- bernetics, 2024.
- [Xu et al., 2021] Jiehui Xu, Haixu Wu, Jianmin Wang, and Mingsheng Long. Anomaly transformer: Time series anomaly detection with association discrepancy. arXiv preprint arXiv:2110.02642, 2021.
- [Yan et al., 2024] Peng Yan, Ahmed Abdulkadir, Paul- Philipp Luley, Matthias Rosenthal, Gerrit A Schatte, Ben- jamin F Grewe, and Thilo Stadelmann. A comprehensive survey of deep transfer learning for anomaly detection in industrial time series: Methods, applications, and direc- tions. IEEE Access, 2024.
- [Yang et al., 2023] Yiyuan Yang, Chaoli Zhang, Tian Zhou, Qingsong Wen, and Liang Sun. Dcdetector: Dual attention contrastive representation learning for time series anomaly detection. In Proceedings of the 29th ACM SIGKDD Con- ference on Knowledge Discovery and Data Mining, pages 3033-3045, 2023.
- [Zeng et al., 2023] Ailing Zeng, Muxi Chen, Lei Zhang, and Qiang Xu. Are transformers effective for time series fore- casting? In Proceedings of the AAAI conference on artifi- cial intelligence, volume 37, pages 11121-11128, 2023.
- [Zhang et al., 2019] Chuxu Zhang, Dongjin Song, Yuncong Chen, Xinyang Feng, Cristian Lumezanu, Wei Cheng, Jingchao Ni, Bo Zong, Haifeng Chen, and Nitesh V Chawla. A deep neural network for unsupervised anomaly detection and diagnosis in multivariate time series data. In Proceedings of the AAAI conference on artificial intelli- gence, volume 33, pages 1409-1416, 2019.
- [Zhang et al., 2021] Yuxin Zhang, Yiqiang Chen, Jindong Wang, and Zhiwen Pan. Unsupervised deep anomaly de- tection for multi-sensor time-series signals. IEEE Trans- actions on Knowledge and Data Engineering, 35(2):2118- 2132, 2021.
- [Zong et al., 2018] Bo Zong, Qi Song, Martin Renqiang Min, Wei Cheng, Cristian Lumezanu, Daeki Cho, and Haifeng Chen. Deep autoencoding gaussian mixture model for unsupervised anomaly detection. In Interna- tional conference on learning representations, 2018.
References were extracted automatically from the PDF and may contain errors.
Full text extracted automatically from the PDF; figures, tables and equations may differ. The PDF is the version of record.
1 Introduction
Multivariate time series anomaly detection technology is extensively employed across various domains, including industrial equipment monitoring [Xie et al., 2024], vehicle diagnostics [Wei et al., 2024], network system surveillance [Lim et al., 2024], and financial risk assessment [Jiang et al., 2024]. Due to the development of sensor technology, various sensors are widely used to record industrial process variables. These sensors generate thousands of interconnected multivariate time series datasets within these systems. It is crucial to accurately diagnose the real-time status of equipment from these extensive sensor data.
∗Corresponding authors
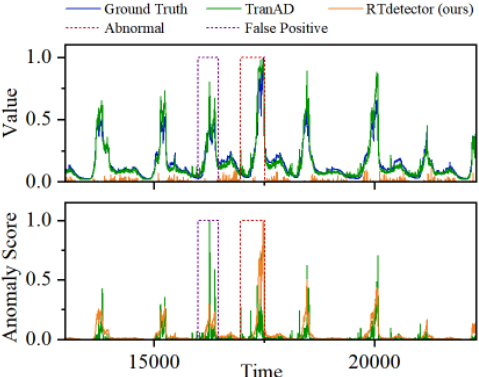
Currently, most anomaly detection methods rely on reconstruction-based approaches. While these methods can effectively identify pattern anomalies, they may overfit to abnormal patterns, making it difficult to detect amplitude anomalies [Schmidl et al., 2022]. To solve this problem, some studies [Kim et al., 2021] prevent incorrect fitting of abnormal data by allowing the model to learn the changing trend of the data. Despite significant progress, these approaches are typically based on idealized datasets for learning model variation trends. However, real-world data are often nonstationary, meaning that the statistical properties and joint distributions of time series data change over time. These methods fail to account for the dynamic nature of data distribution, leading to an inability of the models to effectively learn the correct trend for data reconstruction. Figure 1 shows that the existing methods have incorrectly learned the changing trend of the data, resulting in the reconstruction of anomalies that should not exist at normal times with the wrong changing trend.
There are two key challenges in enabling a model to accurately learn the true reconstruction trends of data. Challenge
1: How to restore the original distributional variations of time series data during reconstruction. In order to allow the model to learn a more stable data distribution, most algorithms [Tuli et al., 2022; Yang et al., 2023] preprocess the time series by stabilizing it. While this approach can enhance the model's predictability, it inevitably leads to the loss of information regarding the original distributional changes, thereby reducing the accuracy of anomaly detection. Challenge 2: The model's inherent architecture does not capture the true variation trends of the time series. Previous methods often rely on the concurrent input of both a window sequence and a complete sequence [Wang et al., 2024] to help the model learn the trend of data variations. Although this approach allows the model to learn the changing trend of the data to a certain extents, the model itself is not designed specifically to recover the reconstruction trend of time series data. As a result, it fails to effectively learn the true changing characteristics of the reconstruction trend of the data.
In response to the above challenges, we propose a reconstruction trend transformer time series anomaly detector (RTdetector). This model captures global features by processing both the window sequence and complete sequence within the Transformer framework and learns the global trend information of intrinsic time series through RT-Attention. The global trend information of the reconstructed data is restored by reconstruction trend enhancement (RTE) of the model's decoder output. Additionally, the difference between the reconstructed data and the real data is amplified through the attention score, thereby enhancing the detection of anomalies that are difficult to distinguish. The contribution of our RTdetector are summarised as follows:
- We propose a global anomaly attention mechanism based on reconstruction trend to capture global information within a window by simultaneously processing the window sequence and the complete sequence. The global feature information of the intrinsic time series is restored through RT-Attention.
- We design a self-conditioning transformer based on RTE, which recovers the global trend features of the input data in the output by aggregating them. Additionally, it uses focus scores to amplify reconstruction errors for better predictability.
- Extensive experiments conducted on four public datasets demonstrate that RTdetector achieves state-of-the-art performance in detecting anomalies in multivariate time series.
2 RelatedWork
In this section, we provide a concise yet comprehensive review of the current landscape in deep models for time series anomaly detection and stationarization for time series detection.
2.1 DeepModels for Time Series Anomaly Detection
In recent years, the use of carefully designed deep learning structures to achieve high-precision multivariate time series detection has garnered significant attention among researchers. A method combining Spectral Residual and CNN was proposed to detect timing anomalies in service systems [Ren et al., 2019]. In the real world, it is difficult for multivariate time series data to have all label information, so unsupervised anomaly diagnosis methods have been widely studied [Deng and Hooi, 2021; Li et al., 2022]. The multivariate spectrum signal frequency consistency is employed for unsupervised anomaly detection [Abdulaal et al., 2021]. For time series anomaly detection, an unsupervised approach utilizing LSTM networks is proposed, wherein anomaly identification is achieved through architectural optimization of LSTM models in conjunction with support vector machine algorithms [Ergen and Kozat, 2019]. USAD [Audibert et al., 2020] employs an autoencoder based on adversarial training, ensuring efficient model training. Among unsupervised learning methods, reconstruction-based anomaly detection techniques have been widely studied due to their effectiveness in solving highdimensional and nonlinear data problems. However, they often tend to overfit to abnormal patterns, which can lead to an inability to accurately diagnose anomalies.
2.2 Anomaly Detection in Time Series Based on Reconstruction
Although reconstruction-based anomaly detection methods can effectively identify pattern anomalies, they are likely to overfit abnormal data, reconstructing the same abnormal data, which makes it difficult to detect amplitude anomalies. To solve these problems, some studies have tried to amplify the difference between abnormal data and reconstructed data to enable the model to better diagnose amplitude anomalies [Schlegl et al., 2017]. To further address the issue of overfitting to abnormal data, numerous studies have aimed to prevent the reconstruction of erroneous fitting results by enabling models to learn the underlying trends of the original data. RevIN [Kim et al., 2021] recovers the statistics of time series data through reversible instance normalization. DCdetector uses a single-scale architecture to extract local features and global correlations to effectively capture the temporal information of long-term series [Yang et al., 2023]. D3R supplements the global information of data through decomposition and reconstruction [Wang et al., 2024]. While these methods have mitigated the problem of overfitting to abnormal data by capturing global trend information to some extent, most models themselves do not learn the reconstruction trend of the data. Instead, they rely on preprocessing the data outside the model, leading to insufficient capability in capturing the reconstruction trend. Consequently, the anomaly detection performance remains unsatisfactory.
3 Methodology
For multivariate time series data with timestamps of length T :
where each data point xt ∈ Rd is collected at timestamp t from different sensors. Here, d is the data dimension, representing the number of sensors. The anomaly detection problem can be defined as: given training data X , for an unknown data ˆ X, where the data length is ˆ T as the test sequence with the same modality as the training data. We need to predict Y = {y1, . . . , y ˆ T }, where yt ∈ {0, 1} represents whether the point is anomalous (1 represents an anomaly and 0 represents a normal point).
3.1 Overall Architecture
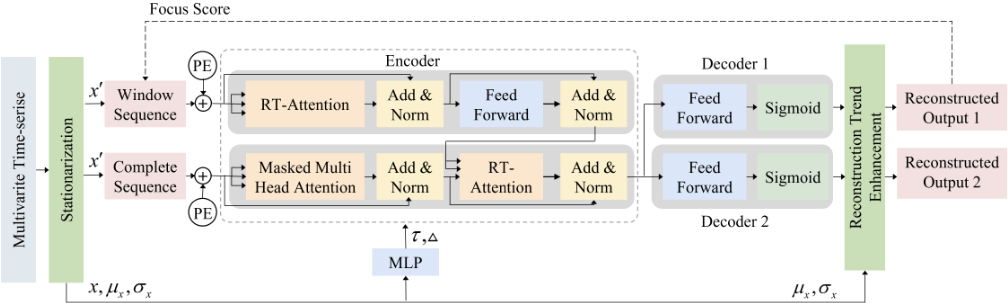
Transformer have been widely used in time series data anomaly detection [Yan et al., 2024]. However, as mentioned above, it is often difficult to capture time series relationships [Zeng et al., 2023] when using Transformer for anomaly detection, and it often lacks the capability to extract global reconstruction information. Therefore, we designed the architecture shown in Figure 2.
We use the complete sequence c to capture the trend of global time series changes, and the window sequence w to capture the relationship between adjacent time series. The masked multi head attention is used to mask the data of subsequent timestamps to prevent the decoder trainer from obtaining data of future timestamps. We designed two decoders to adjust the training model by focusing on the Focus score, which quantifies the difference between the generated and original data, thereby enhancing sensitivity to abnormal intervals. The RTE module is used to restore the information lost by stationarization, which will be discussed in detail in Section 3.2. We designed the RT-Attention module to address the inability of traditional attention mechanisms to capture data reconstruction trends, which will be discussed in detail in Section 3.3. Finally, we use the outputs of the two decoders concurrently to determine the presence of an anomaly.
3.2 Self-conditioning Transformer Based on RTE
In order to make the data distribution of the model more stable and reduce the deviation trend of the data, we stabilize the input time series data X = (x1, x2, . . . , xT ) to obtain the stationarized data X ′ = [x′1 , x′2 , . . . , x′T ]. The stationarization formula is shown as follow:
where µx, σx ∈ Rd×1 and ⊙ is the element-wise product. Although data stabilization can achieve better prediction results by reducing the non-stationarity of the sequence, it often lead to the model's inability to accurately capture the original data reconstruction trends. Therefore, we employ the RTE module to recover the lost information. After the model completes the prediction, the input prediction result is O′ = [o′1 , o′2 , . . . , o′ˆ T ]. We use µx and σx to supplement the lost information of o′i and obtain the final prediction result O = {o1, o2, . . . , o ˆ T }. The RTE formula is as follows:
By transforming the model input through stationarization and the output through RTE, the underlying model processes stabilized inputs to yield enhanced predictive outcomes. Subsequently, these predictive results are combined with the RTE module to restore the inherent variability of the data. This approach ensures that the model incorporates trend of change of the data during anomaly detection, thereby enhancing the accuracy of detection.
We adopted the concept of TranAD [Tuli et al., 2022] and utilized the self-conditioning Transformer for model training. Initially, we employed Input Window W ∈ RK×d with a Focus score F = [0]K×d for training where K is the local contextual window of length. To ensure the generated results closely matched the original input, we applied the L2-norm in training both Decoder 1 and Decoder 2:
Where O′1 and O′2 are the decoder results, followed by a RTE operation. In this stage, we allow the two decoders to generate values as close to the window data as possible to ensure the stability of training. Then, we introduce the concept of an adversarial network and utilize the reconstruction loss of L1 as the focus score. After adversarial training, we obtain the final output ˆO2. Decoder 2 attempts to distinguish the generated data from the input window value as much as possible, while Decoder 1 strives to make the generated value as close to the input window as possible to confuse Decoder 2. Through this stage, the attention weight is adjusted to provide higher neural network activation for the subsequence, thereby advancing the short-term time trend. The training objective is:
Combining the two stages, the loss can be determined as follows:
where η is the training parameter. Finally, our Selfconditioning Transformer is shown in Algorithm 1. This model uses both global and local features of the data to complete model training and achieve better prediction accuracy.
3.3 Reconstruction Trend Attention
In order to capture both global and local trend features of the data, we input both complete sequence and window sequence into the Transformer. The window sequence captures the short-term time series trend and the complete sequence captures the overall data trend. To allow the Transformer to learn the trend of changes of the data at the bottom layer, we employ a novel reconstruction trend attention mechanism. This mechanism captures specific time dependencies from the original data sequence through the bottom-level Attention module. The vanilla Attention mechanism is defined as follows [Vaswani et al., 2017]:
Algorithm 1 The RTdetector training algorithm
Require: Encoder E, Decoders D1 and D2
Parameter: Iteration limit N
- 1: Initialize weights E, D1, D2
- 2: n← 0
- 3: do
- 4: for t = 1 to T
5: O′1 ,O′2 ←D1(E(Wt,⃗0)),D2(E(Wt,⃗0))
7:
8:
10:
11:
ˆO2 = σx ⊙ ( ˆO′2 + µx)
L2 = η‖O2 - Wt‖2 - (1 - η)‖ ˆO2 - Wt‖2
Update weights of E, D1, D2 using L1, L2
- 12: n ← n + 1
13: while (n < N)
where Q (query), K (key), V (value) ∈ RT×dk and T is queries length. Each query Q = [q1, q2, ..., qT ] can be calculated as qi = f(xi) where f is embedding layer and input series X = (x1, x2, . . . , xT ). After stationarization, the model received X ′ = [x′1 , x′2 , . . . , x′T ], and X ′ can get by equation 2. Thus we can get the query Q′ = [q′1 , ..., q′T ] by the equation:
where µQ = 1 T ∑Ti=1 qi ∈ Rdk×1 . and the Q′ can written as (Q- 1µ⊤Q)/σx where 1 ∈ RT×1 is an all-ones vector. The K′ can same calculated as (K - 1µ⊤K )/σx. Thus the QKT can calculated as:
ˆO′2 ← D2(E(Wt, ‖O1 - Wt‖2))
and the attention can calculated as:
where S is the softmax calculation, We find the (QµK)1⊤ and 1(µ⊤QµK)1⊤ are both ∈ RS×S , the same as σ2 xQ′K′⊤ and 1(µ⊤QK⊤). Thus we can obtain equation 12 from equation 11.
where c is a matrix with the same columns and the same number of rows and columns as x.
In order for the model to capture the date change trend of Q′ , K′ , we use two MLP to obtain τ = σ2x , ∆ = KµQ respectively. The RT-Attention can be denoted:
where A is the attention calculation. RT-Attention effectively learns the sequence stationary information while capturing the change trend of the original sequence through the change factor.
3.4 Anomaly Detection Inference
Our anomaly detection inference process is shown in Algorithm 2.The anomaly score is defined as follows:
where the ˆW is the unseen window data.We considered both Decoder outputs for obtaining anomaly scores. At the time of anomaly detection, when the anomaly score of any dimension time series is larger than a threshold, we assume
Algorithm 2 The RTdetector testing algorithm
Require: Trained Encoder E, Decoders D1 and D2, Test Dataset ˆW
- 1: for t = 1 to ˆ T
- 2: O′1 ,O′2 ←D1(E( ˆWt,⃗0)),D2(E( ˆWt,⃗0))
- 3: O1,O2 = σx ⊙ (O′1 +µx), σx ⊙ (O′2 +µx)
- 4: ˆO′2 ← D1(E( ˆWt, ‖O1 - W‖2)), D2(E( ˆWt, ‖O1 - W‖2))
- 5: ˆO2 = σx ⊙ ( ˆO′2 +µx)
- 6: s = 12 ‖O1 - ˆW‖2 + 12 ‖ ˆO2 - ˆW‖2
- 7: yi ← (si ≥ POT(si)) ? 1 : 0
- 8: y = ∨i yi
that the entire multivariate time series is anomalous. To ensure a fair comparison, we employ the Peak Over Threshold (POT) method to dynamically and automatically determine the threshold [Siffer et al., 2017].
4 Experimental
4.1 Experimental Settings
Datasets
We evaluate RTdetector extensively on four real-world datasets: (1) UCR [Dau et al., 2019] is a dataset containing a variety of time series, and we only use data obtained from natural sources (InternalBleeding and ECG datasets), (2) MITBIH Supraventricular Arrhythmia Database (MBA) [Moody and Mark, 2001; Goldberger et al., 2000] is a database for studying arrhythmias provided by the Massachusetts Institute of Technology in the United States. It contains multiparameter cardiopulmonary data and ECG signal diagnostic information recorded by electrocardiologists. (3) Server Machine Dataset (SMD) [Su et al., 2019] is a collection of resource utilization calls of 28 machines within 5 weeks. We use the non-stationary time series for training and testing which named machine-1-1, 2-1, 3-2 and 3-7. (4) Soil Moisture Active Passive (SMAP) [Hundman et al., 2018] is a data set that contains telemetry information data collected by NASA using the SMAP satellite, and the telemetry anomaly data is annotated by experts.
Baselines
We extensively compare our model with 11 baselines, including the reconstruction-based models: OmniAnomaly [Su et al., 2019], MSCRED [Zhang et al., 2019], MAD-GAN [Li et al., 2019]; the density-estimation methods: DAGMM [Zong et al., 2018]; the autoregression-based models: LSTM-NDT [Hundman et al., 2018] USAD [Audibert et al., 2020],CAEM [Zhang et al., 2021], GDN [Deng and Hooi, 2021], TranAD [Tuli et al., 2022]; the classic methods: MERLIN [Nakamura et al., 2020].
Evaluation Criteria
We use recall, precision, F1-score and the area under the receiver operating characteristic curve (ROC/AUC) to evaluate the detection performance of the model [Huet et al., 2022].
We use common anomaly detection criteria for a fair comparison, if any individual time series within the multivariate data is diagnosed as an anomaly, the entire multivariate time series is classified as anomalous [Su et al., 2019; Tuli et al., 2022].
Implementation Details
Following the approach of TranAD, we use non-overlapping sliding windows to obtain sub-windows [Tuli et al., 2022]. For all datasets, the sliding window size is fixed at 10. If the anomaly score at a time point exceeds a certain threshold, the entire window is considered anomalous. We use the Adam optimizer [Kingma and Ba, 2014] to train our model with an initial learning rate of 0.01, a step size of 0.5, 64 hidden units in the encoder layers, and a dropout rate of 0.1 in the encoders. All RTdetector experiments are implemented in PyTorch [Paszke et al., 2019] on an NVIDIA GeForce RTX 2080 Ti GPU.
4.2 Performance Evaluation
We first evaluated our RTdetector on four real-world multivariate datasets using eleven competitive baselines, as shown in Table 1. Our proposed RTdetector outperforms state-ofthe-art baseline methods on most datasets. Specifically, it achieves superior detection performance across all datasets except SMAP, while still demonstrating excellent results on SMAP. We believe this is due to the obvious cyclical nature of the SMAP dataset, where the amplitude of normal data does not vary significantly, thus diminishing the advantage of the RTdetector.
Notably, our method significantly outperformed others on the SMD dataset. This dataset is characterized by high non-stationarity, making it challenging to capture the inherent trends. This highlights the difficulty previous methods faced in effectively capturing accurate reconstruction trends in datasets with complex trend variations. In our model, we address this by using a self-conditioning Transformer based on RTE to restore the inherent trends of the reconstructed data. Additionally, our RT-Attention effectively captures the true data trends from the model's lower layers, thereby improving the application of reconstruction trends in anomaly detection.
4.3 Ablation Experiments
To validate the effectiveness and necessity of our design, we conducted ablation studies on the RTE and RT-Attention modules of the RTdetector. Specifically, we removed the RTE module and replaced the RT-Attention module with vanilla Attention, as shown in Table 2. We observed that the RTE module compensates for information lost due to stationarization by supplementing it after the model's decoder output, making the reconstructed data more closely align with the true data trends. Removing this module led to significant decreases in precision, F1-score, and AUC, demonstrating that this module effectively enhances the model's detection accuracy. From the ablation experiments on the RT-Attention module, we found that using the RT-Attention module instead of vanilla attention, resulted in significant improvements in precision, F1-score, and AUC, though recall slightly decreased. We believe this is because the vanilla Attention module tends to overfit abnormal patterns, leading to more false positives. In contrast, RT-Attention enables the model to learn the correct reconstruction trends at the lower layers, thereby improving anomaly detection results.
| Method | UCR | MBA | ||||||
|---|---|---|---|---|---|---|---|---|
| P | R | AUC | F1 | P | R | AUC | F1 | |
| MERLIN | 0.7542 | 0.8018 | 0.8984 | 0.7773 | 0.9846 | 0.4913 | 0.7828 | 0.6555 |
| LSTM-NDT | 0.5231 | 0.8294 | 0.9781 | 0.6416 | 0.9207 | 0.9718 | 0.9780 | 0.9456 |
| DAGMM | 0.5337 | 0.9718 | 0.9916 | 0.6890 | 0.9475 | 0.9900 | 0.9858 | 0.9683 |
| OmniAnomaly | 0.8346 | 0.9999 | 0.9981 | 0.9098 | 0.8561 | 1.0000 | 0.9570 | 0.9225 |
| MSCRED | 0.5441 | 0.9718 | 0.9920 | 0.6976 | 0.9272 | 1.0000 | 0.9799 | 0.9623 |
| MAD-GAN | 0.8538 | 0.9891 | 0.9984 | 0.9165 | 0.9396 | 1.0000 | 0.9836 | 0.9689 |
| USAD | 0.8952 | 1.0000 | 0.9989 | 0.9447 | 0.8953 | 0.9989 | 0.9701 | 0.9443 |
| CAE-M | 0.6981 | 1.0000 | 0.9957 | 0.8222 | 0.8442 | 0.9997 | 0.9661 | 0.9154 |
| GDN | 0.6894 | 0.9988 | 0.9959 | 0.8158 | 0.8832 | 0.9892 | 0.9528 | 0.9332 |
| TranAD | 0.9407 | 1.0000 | 0.9994 | 0.9694 | 0.9569 | 1.0000 | 0.9885 | 0.9780 |
| DCdetector | 0.8222 | 1.0000 | 0.9985 | 0.9024 | 0.9523 | 0.9912 | 0.9895 | 0.9712 |
| RTdetector | 0.9823 | 1.0000 | 0.9998 | 0.9910 | 0.9734 | 1.0000 | 0.9930 | 0.9865 |
| Method | SMD | SMAP | ||||||
| P | R | AUC | F1 | P | R | AUC | F1 | |
| MERLIN | 0.2871 | 0.5804 | 0.7158 | 0.3842 | 0.1577 | 0.9999 | 0.7426 | 0.2725 |
| LSTM-NDT | 0.9736 | 0.8440 | 0.9671 | 0.9042 | 0.8523 | 0.7326 | 0.8602 | 0.7879 |
| DAGMM | 0.9103 | 0.9914 | 0.9954 | 0.9491 | 0.8069 | 0.9891 | 0.9885 | 0.8888 |
| OmniAnomaly | 0.8881 | 0.9985 | 0.9946 | 0.9401 | 0.8130 | 0.9419 | 0.9889 | 0.8728 |
| MSCRED | 0.7276 | 0.9974 | 0.9921 | 0.8414 | 0.8175 | 0.9216 | 0.9821 | 0.8664 |
| MAD-GAN | 0.9991 | 0.8440 | 0.9933 | 0.9150 | 0.8157 | 0.9216 | 0.9891 | 0.8654 |
| USAD | 0.9060 | 0.9974 | 0.9933 | 0.9495 | 0.7480 | 0.9627 | 0.9890 | 0.8419 |
| CAE-M | 0.9082 | 0.9671 | 0.9783 | 0.9367 | 0.8193 | 0.9567 | 0.9901 | 0.8827 |
| GDN | 0.7170 | 0.9974 | 0.9924 | 0.8342 | 0.7480 | 0.9891 | 0.9864 | 0.8518 |
| TranAD | 0.9262 | 0.9974 | 0.9974 | 0.9605 | 0.8043 | 0.9999 | 0.9921 | 0.8915 |
| DCdetector | 0.8359 | 0.9110 | 0.9924 | 0.8718 | 0.9563 | 0.9892 | 0.9918 | 0.9702 |
| RTdetector | 0.9992 | 0.9974 | 0.9986 | 0.9983 | 0.8339 | 1.0000 | 0.9904 | 0.9094 |
| Method | UCR | |||
|---|---|---|---|---|
| P | R | AUC | F1 | |
| RTdetector | 0.9992 | 0.9974 | 0.9986 | 0.9983 |
| w/o RTE | 0.9783 | 0.9973 | 0.9975 | 0.9877 |
| w/o RT-Attention | 0.9758 | 0.9971 | 0.9978 | 0.9868 |
4.4 Overhead Analysis
To demonstrate the computational efficiency of our method, we further provide the average training time of all models on each dataset. As illustrated in Table 3, our RTdetector achieves a reduction in training time of over 75% compared to most baseline methods.
| Method | UCR | MBA | SMD | SMAP |
|---|---|---|---|---|
| MERLIN | 4.09 | 20.19 | 72.32 | 6.89 |
| LSTM-NDT | 8.71 | 27.80 | 373.14 | 27.62 |
| DAGMM | 20.78 | 74.62 | 204.36 | 19.05 |
| OmniAnomaly | 27.96 | 109.86 | 276.97 | 27.05 |
| MSCRED | 262.45 | 592.13 | 109.63 | 16.13 |
| MAD-GAN | 25.71 | 160.29 | 285.25 | 29.49 |
| USAD | 21.10 | 120.86 | 232.82 | 23.63 |
| MTAD-GAT | 97.12 | 233.08 | 1304.09 | 1015.03 |
| CAE-M | 19.42 | 67.44 | 552.83 | 187.35 |
| GDN | 58.78 | 159.01 | 585.34 | 62.33 |
| TranAD | 0.84 | 4.08 | 43.56 | 3.55 |
| DCdetector | 22.39 | 80.84 | 338.43 | 37.942 |
| RTdetector | 1.38 | 8.42 | 72.90 | 7.19 |
4.6 Hyperparameter Analysis
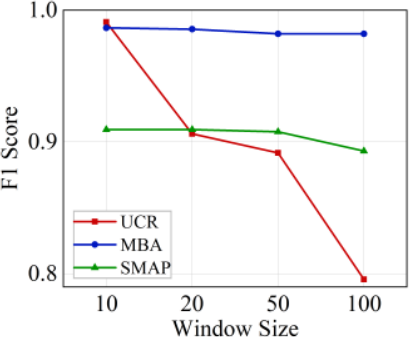
We conducted a sensitivity analysis on the window size parameter. As shown in Figure 4, our results indicate that when the window size exceeds 10, the F1 score decrease significantly. We believe that this is because an excessively large window size will cause the anomaly to be hidden in the long local data and difficult to accurately diagnose. It is difficult for the model to accurately predict its changing trend from the local information of a long sequence.
5 Conclusions
To address the issue of overfitting anomalies in reconstruction-based time series anomaly detection, we proposes a novel anomaly detection algorithm named RTdetector. In RTdetector, a self-conditioning transformer based on RTE is designed to enhance model predictability by amplifying the difference between reconstruction results and original data. RTE ensures that reconstruction results adhere to the normal data trends. Additionally, a global anomaly attention mechanism based on reconstruction trends is designed to enable the model to learn the true reconstruction trends of the data, further ensuring consistency between the final reconstruction trends and the original data. Extensive experiments shown that RTdetector outperforms existing state-of-the-art algorithms on four benchmark datasets.
Acknowledgments
This paper is supported by the National Natural Science Foundation of China (Grant no.62302527), the Young Scientists Fund of the National Natural Science Foundation of China (Grant No. 62302529), the Hunan Provincial Natural Science Foundation of China (2023JJ40770).
4.5 Visual Analysis
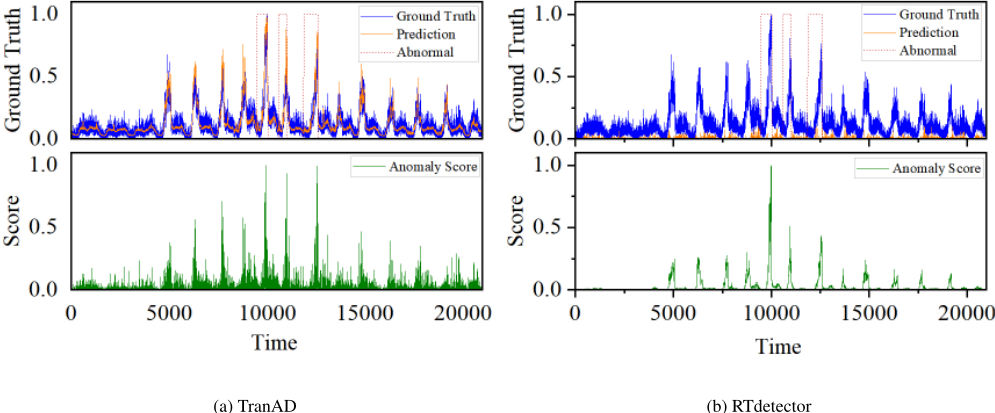
We have conducted a visual analysis of the RTdetector we proposed and compared it with traditional methods. As shown in Figure 3, our findings indicate that the RTdetector method does not aim to generate data that closely resembles real data like traditional methods. Instead, it only generates a reconstruction trend of the data and determines the occurrence of a fault based on whether the real data aligns with this reconstruction trend. By focusing on the data reconstruction trend, our approach can effectively reduce false positives associated with traditional methods. Specifically, it avoids reconstructing anomalies that should not exist due to sudden changes in the data.
@inproceedings{ijcai2025p644,
  title     = {RTdetector: Deep Transformer Networks for Time Series Anomaly Detection Based on Reconstruction Trend},
  author    = {Liu, Xinhong and Li, Xiaoliang and Li, Yangfan and Tang, Fengxiao and Zhao, Ming},
  booktitle = {Proceedings of the Thirty-Fourth International Joint Conference on
               Artificial Intelligence, {IJCAI-25}},
  publisher = {International Joint Conferences on Artificial Intelligence Organization},
  editor    = {James Kwok},
  pages     = {5788--5796},
  year      = {2025},
  month     = {8},
  note      = {Main Track},
  doi       = {10.24963/ijcai.2025/644},
  url       = {https://doi.org/10.24963/ijcai.2025/644},
}
TY - CPAPER TI - RTdetector: Deep Transformer Networks for Time Series Anomaly Detection Based on Reconstruction Trend AU - Liu, Xinhong AU - Li, Xiaoliang AU - Li, Yangfan AU - Tang, Fengxiao AU - Zhao, Ming T2 - Proceedings of the Thirty-Fourth International Joint Conference on Artificial Intelligence, IJCAI-25 PB - International Joint Conferences on Artificial Intelligence Organization PY - 2025 SP - 5788 EP - 5796 DO - 10.24963/ijcai.2025/644 UR - https://doi.org/10.24963/ijcai.2025/644 ER -Copied
Machine-readable versions of this paper, for tools and AI agents:





