
Dynamic Higher-Order Relations and Event-Driven Temporal Modeling for Stock Price Forecasting
Proceedings of the Thirty-Fourth International Joint Conference on Artificial Intelligence. Main Track. Pages 6048-6056.
https://doi.org/10.24963/ijcai.2025/673
Keywords
- Machine Learning: ML: Deep learning architectures
- Multidisciplinary Topics and Applications: MTA: Finance
- Machine Learning: ML: Supervised Learning
- Machine Learning: ML: Applications
Abstract
In stock price forecasting, modeling the probabilistic dependence between stock prices within a time-series framework has remained a persistent and highly challenging area of research. We propose a novel model to explain the extreme co-movement in multivariate data with time-series dependencies. Our model incorporates a Hawkes process layer to capture abrupt co-movements, thereby enhancing the temporal representation of market dynamics. We introduce dynamic hypergraphs into our model adapting to higher-order (groupwise rather than pairwise) relationships within the stock market. Extensive experiments on real-world benchmarks demonstrate the robustness of our approach in predictive performance and portfolio stability.
- [Ang et al., 2006] Andrew Ang, Joseph Chen, and Yuhang Xing. Downside risk. The review of financial studies, 19(4):1191-1239, 2006.
- [Bacry et al., 2015] Emmanuel Bacry, Iacopo Mastromatteo, and Jean-Franc ¸ois Muzy. Hawkes processes in finance. Market Microstructure and Liquidity, 1(01):1550005, 2015.
- [Bai et al., 2021] Song Bai, Feihu Zhang, and Philip HS Torr. Hypergraph convolution and hypergraph attention. Pattern Recognition, 110:107637, 2021.
- [Bennett et al., 2022] Stefanos Bennett, Mihai Cucuringu, and Gesine Reinert. Lead-lag detection and network clus- tering for multivariate time series with an application to the us equity market. Machine Learning, 111(12):4497-4538, 2022.
- [Chen et al., 2018] Yingmei Chen, Zhongyu Wei, and Xu- anjing Huang. Incorporating corporation relationship via graph convolutional neural networks for stock price pre- diction. In Proceedings of the 27th ACM international conference on information and knowledge management, pages 1655-1658, 2018.
- [Cox and Isham, 1980] David Roxbee Cox and Valerie Isham. Point processes, volume 12. CRC Press, 1980.
- [Ding et al., 2020] Qianggang Ding, Sifan Wu, Hao Sun, Ji- adong Guo, and Jian Guo. Hierarchical multi-scale gaus- sian transformer for stock movement prediction. In IJCAI, pages 4640-4646, 2020. IJCAI
- [Embrechts et al., 2011] Paul Embrechts, Thomas Liniger, and Lu Lin. Multivariate hawkes processes: an appli- cation to financial data. Journal of Applied Probability, 48(A):367-378, 2011.
- [Feng et al., 2019a] Fuli Feng, Xiangnan He, Xiang Wang, Cheng Luo, Yiqun Liu, and Tat-Seng Chua. Temporal re- lational ranking for stock prediction. ACM Transactions on Information Systems (TOIS), 37(2):1-30, 2019.
- [Feng et al., 2019b] Yifan Feng, Haoxuan You, Zizhao Zhang, Rongrong Ji, and Yue Gao. Hypergraph neural net- works. In Proceedings of the AAAI conference on artificial intelligence, volume 33, pages 3558-3565, 2019.
- [Hawkes, 1971] Alan G Hawkes. Spectra of some self-exciting and mutually exciting point processes. Biometrika, 58(1):83-90, 1971.
- [Hong et al., 2024] Sungchul Hong, Yunjin Choi, and Jong- June Jeon. Interpretable water level forecaster with spa- tiotemporal causal attention mechanisms. International Journal of Forecasting, 2024.
- [Huynh et al., 2023] Thanh Trung Huynh, Minh Hieu Nguyen, Thanh Tam Nguyen, Phi Le Nguyen, Matthias Weidlich, Quoc Viet Hung Nguyen, and Karl Aberer. Effi- cient integration of multi-order dynamics and internal dy- namics in stock movement prediction. In Proceedings of the Sixteenth ACM International Conference on Web Search and Data Mining, pages 850-858, 2023.
- [Joe, 1997] Harry Joe. Multivariate models and multivariate dependence concepts. CRC press, 1997.
- [Ju et al., 2024] Wei Ju, Zhengyang Mao, Siyu Yi, Yi- fang Qin, Yiyang Gu, Zhiping Xiao, Yifan Wang, Xiao Luo, and Ming Zhang. Hypergraph-enhanced dual semi- supervised graph classification. In Proceedings of the 41st International Conference on Machine Learning, pages 22594-22604. PMLR, 2024.
- [King, 1966] Benjamin F King. Market and industry fac- tors in stock price behavior. the Journal of Business, 39(1):139-190, 1966.
- [Li et al., 2021] Wei Li, Ruihan Bao, Keiko Harimoto, Deli Chen, Jingjing Xu, and Qi Su. Modeling the stock relation with graph network for overnight stock movement predic- tion. In Proceedings of the twenty-ninth international con- ference on international joint conferences on artificial in- telligence, pages 4541-4547, 2021. IJCAI
- [Li et al., 2024] Tong Li, Zhaoyang Liu, Yanyan Shen, Xue Wang, Haokun Chen, and Sen Huang. Master: Market- guided stock transformer for stock price forecasting. In Proceedings of the AAAI Conference on Artificial Intelli- gence, volume 38, pages 162-170, 2024.
- [Lim et al., 2021] Bryan Lim, Sercan Ö Arık, Nicolas Lo- eff, and Tomas Pfister. Temporal fusion transformers for interpretable multi-horizon time series forecasting. Inter- national Journal of Forecasting, 37(4):1748-1764, 2021.
- [Sawhney et al., 2021] Ramit Sawhney, Shivam Agarwal, Arnav Wadhwa, Tyler Derr, and Rajiv Ratn Shah. Stock selection via spatiotemporal hypergraph attention net- work: A learning to rank approach. In Proceedings of the AAAI Conference on Artificial Intelligence, volume 35, pages 497-504, 2021.
- [Scarselli et al., 2008] Franco Scarselli, Marco Gori, Ah Chung Tsoi, Markus Hagenbuchner, and Gabriele Monfardini. The graph neural network model. IEEE transactions on neural networks, 20(1):61-80, 2008.
- [Sibuya and others, 1960] Masaaki Sibuya et al. Bivariate extreme statistics. Annals of the Institute of Statistical Mathematics, 11(2):195-210, 1960.
- [Sun et al., 2021] Xiangguo Sun, Hongzhi Yin, Bo Liu, Hongxu Chen, Jiuxin Cao, Yingxia Shao, and Nguyen Quoc Viet Hung. Heterogeneous hypergraph embedding for graph classification. In Proceedings of the 14th ACM international conference on web search and data mining, pages 725-733, 2021.
- [Vaswani et al., 2017] Ashish Vaswani, Noam M. Shazeer, Niki Parmar, Jakob Uszkoreit, Llion Jones, Aidan N. Gomez, Lukasz Kaiser, and Illia Polosukhin. Attention is all you need. In Neural Information Processing Systems, 2017.
- [Wu et al., 2021] Haixu Wu, Jiehui Xu, Jianmin Wang, and Mingsheng Long. Autoformer: Decomposition transform- ers with auto-correlation for long-term series forecast- ing. Advances in neural information processing systems, 34:22419-22430, 2021.
- [Xia et al., 2024] Hongjie Xia, Huijie Ao, Long Li, Yu Liu, Sen Liu, Guangnan Ye, and Hongfeng Chai. Ci-sthpan: Pre-trained attention network for stock selection with channel-independent spatio-temporal hypergraph. In Pro- ceedings of the AAAI Conference on Artificial Intelligence, volume 38, pages 9187-9195, 2024.
- [Xu et al., 2021] Wentao Xu, Weiqing Liu, Lewen Wang, Yingce Xia, Jiang Bian, Jian Yin, and Tie-Yan Liu. Hist: A graph-based framework for stock trend forecast- ing via mining concept-oriented shared information. arXiv preprint arXiv:2110.13716, 2021.
- [Yoo et al., 2021] Jaemin Yoo, Yejun Soun, Yong-chan Park, and U Kang. Accurate multivariate stock movement pre- diction via data-axis transformer with multi-level contexts. In Proceedings of the 27th ACM SIGKDD Conference on Knowledge Discovery & Data Mining, pages 2037-2045, 2021.
- [Zhang et al., 2020] Qiang Zhang, Aldo Lipani, Omer Kir- nap, and Emine Yilmaz. Self-attentive hawkes process. In International conference on machine learning, pages 11183-11193. PMLR, 2020.
- [Zhao et al., 2023] Yusheng Zhao, Xiao Luo, Wei Ju, Chong Chen, Xian-Sheng Hua, and Ming Zhang. Dynamic hy- pergraph structure learning for traffic flow forecasting. In 2023 IEEE 39th International Conference on Data Engi- neering (ICDE), pages 2303-2316. IEEE, 2023.
- [Zheng et al., 2023] Zetao Zheng, Jie Shao, Jia Zhu, and Heng Tao Shen. Relational temporal graph convolutional networks for ranking-based stock prediction. In 2023 IEEE 39th International Conference on Data Engineering (ICDE), pages 123-136. IEEE, 2023.
- [Zhou et al., 2006] Dengyong Zhou, Jiayuan Huang, and Bernhard Schölkopf. Learning with hypergraphs: Clus- tering, classification, and embedding. Advances in neural information processing systems, 19, 2006.
- [Zhou et al., 2021] Haoyi Zhou, Shanghang Zhang, Jieqi Peng, Shuai Zhang, Jianxin Li, Hui Xiong, and Wan- cai Zhang. Informer: Beyond efficient transformer for long sequence time-series forecasting. In Proceedings of the AAAI conference on artificial intelligence, volume 35, pages 11106-11115, 2021.
- [Zuo et al., 2020] Simiao Zuo, Haoming Jiang, Zichong Li, Tuo Zhao, and Hongyuan Zha. Transformer hawkes pro- cess. In International conference on machine learning, pages 11692-11702. PMLR, 2020.
References were extracted automatically from the PDF and may contain errors.
Full text extracted automatically from the PDF; figures, tables and equations may differ. The PDF is the version of record.
1 Introduction
With a total market capitalization reaching approximately US$111 trillion in 2023 1 , the stock market has experienced rapid growth, accompanied by increasingly complex dependencies among stock prices and their time-series characteristics. Built on years of breakthroughs in AI, many quantitative studies have adopted deep learning methods to model nonlinear relationships between stocks [Chen et al., 2018; Xu et al., 2021]. By employing sophisticated architectures, stock price forecasting enters a new phase in a complex pattern between stocks, modeling higher-order relationships.
The term 'higher-order relationship' extends the concept of stochastic dependence in two directions: it encompasses group-wise dependencies among stock prices and extreme dependencies represented by higher-order moments. For instance, stocks of companies within the same industry often exhibit similar reactions or trends in response to financial conditions. Furthermore, the synchronous movement of stock prices on average sometimes leads to an extreme comovement of stocks within the same groups, such as abrupt crush, which is a crucial factor for risk management [Li et al., 2021].
∗This work was conducted while the author was at the University of Seoul.
†Corresponding author.
1 wikipedia.org/wiki/Market capitalization
To tackle these issues, existing deep learning methods typically incorporate hypergraph learning and the Hawkes process [Hawkes, 1971] in the predictive model. The hypergraph is a general concept of graphs to allow edges are able to join any number of nodes. Through the characteristics of a hypergraph, the nodes (in our context, stocks) can be connected with some hyperedge. Combining with graph neural networks (GNNs), hypergraph learning is applied to model higher-order relationships in stock price prediction [Sawhney et al., 2021; Xia et al., 2024]. The Hawkes process dynamically constructs the intensity function, effectively capturing the tail distribution of the time series. Abrupt temporal dependence in financial events such as transactions (buy and sell) are modeled with the Hawkes process [Zuo et al., 2020; Sawhney et al., 2021; Huynh et al., 2023]. More details of the Hawkes process are presented in Section 3.
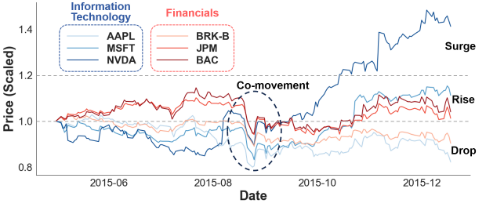
Despite these advancements, two critical challenges remain unaddressed. First, surges or plunges in stock prices often exhibit co-movement characteristics. For example, Figure 1 shows the scaled prices of assets across multiple sectors, normalized to 1 at the initial time point. It highlights a sharp decline across multiple stocks between August and September 2015, as indicated by a dashed circle in the figure. However, existing approaches frequently overlook simultaneous modeling for extremal and group-wise dependence across the stock prices, resulting in their inability to effectively explain the extreme co-movement. Second, the relationships among stocks are exceedingly complex, often beyond the scope of prior domain knowledge, and can dynamically evolve over time. As shown in Figure 1, stocks within the Information Technology sector exhibited noticeably different patterns during the same period. Furthermore, prior to October, stocks within the same sector demonstrated relatively similar movements, but significant divergences emerged afterward. At certain points, stocks from different sectors also exhibited similar movements, suggesting the possibility of temporary groupings across sectors.
In this paper, we propose a novel stock price forecasting model that effectively addresses both challenges. Our approach demonstrates significant enhancements by integrating temporal learning and hypergraph modeling in an end-to-end manner. We fully leverage the use of self-attention mechanisms to enhance temporal learning efficiency. Additionally, we incorporate a Hawkes process layer to capture abrupt changes and co-movement patterns. Finally, we combine domain knowledge-based and dynamic hypergraphs to model evolving relationships over time. These approaches collectively enable our model to achieve superior predictive performance. Our main contributions are summarized as follows:
- A novel neural network layer is proposed to model temporal point processes, with shared movement patterns among stocks effectively captured, temporal representations enriched, and portfolio stability ensured.
- A novel hypergraph learning framework is introduced, where dynamic and predefined hypergraphs are integrated to enable the modeling of dynamic higher-order relationships over time.
- The effectiveness of the proposed approach is demonstrated on real-world datasets, with superior performance shown compared to state-of-the-art baselines, and the significance of the proposed components substantiated.
The remainder of this paper is organized as follows: Section 2 reviews recent studies, and Section 3 provides background on our research. Section 4 describes task definition and our proposed model. Section 5 presents the experimental results and additional analyses. Finally, concluding remarks and directions for future work are presented in Section 6.
2 RelatedWorks
2.1 Transformer-basedModel
The transformer [Vaswani et al., 2017] represents a groundbreaking advancement in deep learning, utilizing a selfattention mechanism to effectively model long-term dependencies. Its success in natural language processing led to its adaptation in various domains, including time series forecasting [Zhou et al., 2021; Wu et al., 2021]. In the context of stock price forecasting, unique challenges arise, requiring models that not only capture temporal patterns of individual stocks but also model complex inter-stock relationships. Several models tailored to address these challenges have been developed. HMG-TF [Ding et al., 2020], a transformer-based model, is specifically designed to account for the unique characteristics of financial markets, including local dependencies and hierarchical structures. DTML [Yoo et al., 2021] employs attention mechanisms along both the time and data axes to learn asymmetric and dynamic stock correlations. MASTER [Li et al., 2024], building upon a framework akin to DTML, adopts a sequential attention mechanism across time, stock, and time dimensions to model cross-time correlations effectively.
2.2 Graph-basedModel
Graph Neural Networks (GNNs) [Scarselli et al., 2008] are designed to learn patterns from graph-structured data and have been widely applied in various domains, including social networks, traffic flow, and chemical structure. In stock price forecasting, GNNs have been utilized to model intricate dependencies and enhance predictive performance. RSR [Feng et al., 2019a] models stock relationships using industry and metadata information sourced from the web, allowing the strength of these relationships to evolve over time. RTGCN [Zheng et al., 2023] enhances relational modeling by constructing three-dimensional graphs that incorporate both temporal and relational information from sources like industry. Recently, the limitations of conventional graph models, which can only handle pairwise relationships, have motivated the development of hypergraph-based stock price forecasting models. Details on hypergraphs are discussed further in Section 3.2. STHAN-SR [Sawhney et al., 2021], similar to RSR, uses industry and Wikidata sources to construct hypergraphs and models higher-order relationships through hypergraph convolution and an attention mechanism. ESTIMATE [Huynh et al., 2023] applies correlation augmentation to industry-based hypergraphs and employs wavelet hypergraph convolution to capture locality and ensure computational efficiency.
3 Preliminaries
3.1 Hawkes Process
A Temporal Point Process (TPP) is a stochastic process that models discrete events occurring over a continuous time axis [Cox and Isham, 1980]. TPPs are particularly useful for describing the temporal distribution of events or analyzing specific patterns and interactions, with applications in fields such as finance.
The Hawkes process [Hawkes, 1971] is a type of TPPs characterized by its "self-exciting" nature, meaning that the occurrence of an event increases the probability of subsequent events. The intensity function of a Hawkes process is defined as:
where λ(t) is the conditional intensity function representing the expected event rate at time t, µ ≥ 0 is the base intensity, representing the exogenous occurrence of events, and ϕ(t) > 0 is a prespecified decaying function, i.e., ϕ(t) = exp(-t). Here, ti denotes the occurrence time of the i-th event. By introducing the regression predictor the Hawkes process can describe how past events influence future occurrences dynamically.
The Hawkes process has been applied in the stock market to model extreme price movements and analyze correlations between events [Bacry et al., 2015; Embrechts et al., 2011]. Its self-exciting nature effectively captures scenarios where a sharp decline in one stock triggers movements in others or extreme volatility events. These applications offer valuable insights into financial risk management and investment strategies.
3.2 Hypergraph Learning
Traditional graphs are limited to modeling pairwise relationships, where edges connect only two nodes. Hypergraphs address this limitation by allowing a single edge to connect multiple nodes, enabling the modeling of higher-order relationships among data. This capability effectively extends connectivity between nodes to capture complex relationships involving multiple nodes.
Hypergraph learning was first introduced in [Zhou et al., 2006], as a propagation process on hypergraph structures. Following the existing works [Bai et al., 2021; Feng et al., 2019b], an undirected hypergraph is defined as G = (V, E,W), where V is the set of nodes, E is the set of hyperedges, and W is a diagonal matrix representing the weights assigned to each hyperedge. The structure of a hypergraph can be represented using the |V| × |E| incidence matrix H, where the entries are defined as:
This incidence matrix provides a flexible representation for capturing complex higher-order relationships that cannot be modeled using traditional pairwise connections.
4 Methodology
4.1 ProblemFormulation
In this paper, bold uppercase letters denote matrices or tensors (e.g., X,H), bold lowercase letters represent vectors (e.g., xst , hst ), and scalars are represented by non-bold lowercase letters (e.g., cst , rs t ). We utilize normalized OHLCV data [Huynh et al., 2023] along with technical indicators (moving average, MACD, RSI) to predict the change in stock price rather than the absolute price. OHLCV data includes open, high, low, close, and volume values, and the relative price change of these values is referred to as the OHLCV ratio. The historical data consists of both the OHLCV ratio and technical indicators. The return ratio, which is the relative close price change in τ days, is defined as rs t+τ = cst+τ -cst cst , where cst is the closing price of stock s at time step t, and τ represents the prespecified lookahead window. The return ratio allows for the normalization of price variations between different stocks, as compared to price changes. Based on the data constructed as described above, we define our task as follows:
Definition 1. Given the historical data X ∈ RS×T×F , where each element xst ∈ RF is a feature vector for stock s ∈ {1, . . . , S} at time t ∈ {1, . . . , T}, the task of Stock Price Forecasting is to predict a return ratio r ∈ RS using a model parameterized by θ. Formally, the goal is to learn a function f such that:
where θ denotes the parameters of the model.
The optimal parameters ˆ θ are obtained by minimizing a risk function L:
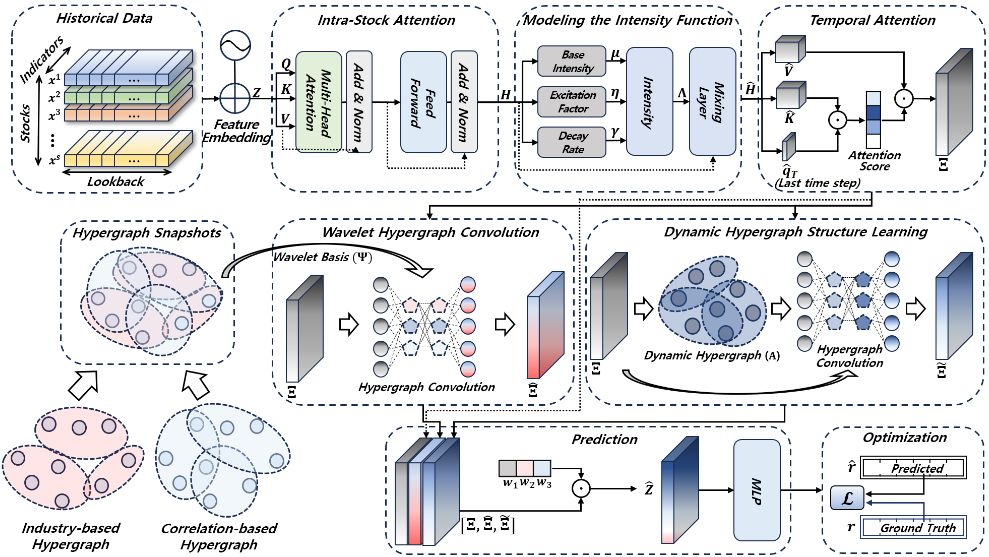
We present an overview of our framework in Figure 2.
4.2 Temporal Dynamics Representation Learning
Feature Embedding. Embedding input features into a multi-dimensional latent space is known to improve the model's ability to capture complex temporal patterns in time series data [Lim et al., 2021; Hong et al., 2024]. To achieve this, we use a simple fully connected layer, which efficiently transforms the rescaled feature vectors into a latent space. Since we use self-attention mechanisms in subsequent stages, it is crucial to preserve the temporal order during model training. Thus, we apply sinusoidal positional encoding, as proposed in [Vaswani et al., 2017] at the initial embedding stage to ensure that the model maintains temporal information throughout the prediction window.
where We ∈ Rde×F and be ∈ Rde are learnable weights and biases, respectively, and PE is sinusoidal positional encoding.
Intra-Stock Attention. RNN-based layers were frequently employed to model the temporal dynamics of individual stocks. However, RNNs are prone to long-term dependency issues, where essential historical information may degrade over time, leading to suboptimal predictions.
To address this, we leverage self-attention mechanisms [Vaswani et al., 2017] to efficiently capture temporal dependencies. To preserve the sequential nature of the data, we apply a temporal mask. The temporal self-attention output for a stock s is given by
where Qs , Ks , and V s are the query, key, and value matrices obtained through linear transformations of Zs = (zst : t = 1, . . . T) ∈ RT×de , respectively. Given the complex time series, we further enhance the model's representations by incorporating multi-head attention, allowing the model to focus on different aspects of temporal features. The outputs of these multiple attention heads are concatenated and then linearly transformed to integrate the information from each head. Additionally, a residual connection is applied to preserve the important stock characteristics. After the multi-head attention, the outputs ˜Hs ∈ RT×de are passed through two fully connected layers with a ReLU activation and dropout, followed by a residual connection.
where W1,W2 ∈ Rde×de and b1, b2 ∈ Rde are learnable weights and biases, respectively, and H = (Hs : s = 1, . . . , S) ∈ RS×T×de is historical context.
4.3 Enhancing and Aggregating Temporal Representation
Modeling the Intensity Function of Hawkes Process. Existing works [Sawhney et al., 2021; Huynh et al., 2023] have utilized Hawkes process-based temporal attention mechanisms to address the non-stationary nature of stock markets and improve the ability of temporal attention mechanisms to capture temporal dynamics. However, the use of static parameterization alone is insufficient to accurately model the dynamic interactions between events.
To leverage the dynamic and self-exciting properties of the Hawkes process, we introduce a layer that directly models its intensity function. We utilize a slice of the historical context H as a predictor to learn the base intensity (µst ), excitation factor (ηst ), and decay rate(γ st ) [Zhang et al., 2020]. These quantities are parametrized by
where hst is a slice of H for stock s at time t, Wµ,Wη,Wγ ∈ Rde×de are learnable parameters. To ensure that γ st is always positive, we applied the softplus activation function as shown in Eq. (1). To model the co-movement of stocks during extreme market conditions, we construct three parameters using shared weights across all stocks. This approach allows the model to capture the synchronized behavior of stocks that emerge during periods of high market volatility (refer to Section 5.3).
Finally, we express the intensity function of Hawkes process as follows:
Similarly, to ensure that the intensity function λst always remains positive, we applied the softplus activation function. The Hawkes process, originally designed for modeling influences in continuous time, is adapted in this study for discrete daily stock data by refining the intensity function to accumulate past information.
To construct richer temporal representations, the historical context Hs ∈ RT×de for stock s and the intensity function output Λs = (λst : t = 1, . . . T) ∈ RT×de from the Hawkes process are combined and transformed, allowing the model to effectively integrate both temporal dynamics and event intensity.
where [· : ·] denotes the tensor concatenation operation, [Hs : Λs ] ∈ RT×2de W3 ∈ R2de×de , b3 ∈ Rde are learnable parameters and ˆHs ∈ RT×de are enhanced temporal representations for stock s.
Aggregation for Temporal Information. To effectively aggregate temporal information across all time steps and generate final embeddings for each stock, we utilized temporal attention. In contrast to general self-attention, temporal attention employs the context vector ˆqsT ∈ Rde from the last time step T as the query, enabling attention across sequences of different lengths and aggregating information with a focus on the last time step. This approach was adopted because the preceding layers were designed during training to ensure that the most critical information is concentrated near the last time step, which is closest to the prediction timestamp, thereby making it natural to base the aggregation on the query vector from the last time step.
where ast represents the temporal attention score, and ξs ∈ Rde is the representation that aggregates the temporal information for stock s. Finally, the representations for all stocks are concatenated into Ξ = (ξs : s = 1, . . . S) ∈ RS×de , referred to as the stock representations.
4.4 Higher-Order Relational Representation Learning via Hypergraph
Constructing the Predefined Hypergraph. As introduced in Section 3.2, we construct a predefined hypergraph G = (V, E,W) to model the intricate relationships in the stock market. Here, V denotes the set of nodes (individual stocks), E represents the hyperedges (groups of related stocks), and W ∈ R|E|×|E| is a diagonal matrix of hyperedge weights, assigned equally for simplicity. The hyperedge set E combines two components: EInd, connecting stocks within the same industry [King, 1966], and ECorr, derived from historical price correlations [Bennett et al., 2022]. The final hyperedge set is expressed as E = EInd ∪ ECorr. For details on the hypergraph construction methodology, we refer the readers to our supplementary materials.
Wavelet Hypergraph Convolution. To model domain knowledge-based correlations among stocks, we use hypergraph convolution. We adopt the wavelet hypergraph convolution proposed in [Sun et al., 2021; Huynh et al., 2023], which balances efficiency and expressiveness by leveraging a sparse wavelet basis. The hypergraph Laplacian ∆ represents structural relationships in the constructed hypergraph G and is defined as ∆ = I -D- 1 2 v HWD-1 e H⊤D- 12 v , where H is the incidence matrix, Dv and De are diagonal degree matrices of nodes and hyperedges. By diagonalizing ∆ as ∆ = UΛfU ⊤, we obtain the the Fourier basis U, where Λf is the diagonal matrix of eigenvalues. Using the Fourier basis, the wavelet basis Ψ is computed as Ψ = UΛsU ⊤, with Λs = diag(e-λ1s , . . . , e-λns ), where s controls the scale of localization. Finally, the wavelet hypergraph convolution is expressed as:
where Λβ = diag(β1, . . . , βS) andWH ∈ Rde×de are learnable parameters. ˆΞ ∈ RS×de contains temporal dynamics combined with prior relational knowledge.
Dynamic Hypergraph Structure Learning. In this study, we leverage the low-rank approaches proposed in [Zhao et al., 2023; Ju et al., 2024] to construct and learn dynamic hypergraphs, achieving a balance between computational efficiency and modeling capability. The incidence matrix A ∈ RS×k of the dynamic hypergraph is generated as shown in Eq. (2). To construct the dynamic hypergraph, it is essential to incorporate information that varies across time steps. Utilizing stock representations Ξ, derived from preceding layers that effectively capture temporal dynamics, encapsulates such timevarying information.A = Softmax(ΞW I ), (2)
where WI ∈ Rde×k is a learnable weight matrix, and k denotes the number of dynamic hyperedges.
After constructing a dynamic hypergraph, we utilize hypergraph convolution to obtain high-level dynamic stock representations. First, the information from neighboring nodes is aggregated based on the dynamic hypergraph structure to compute the dynamic hyperedge embedding matrix E. Subsequently, the learned dynamic hyperedge embedding matrix E is used to update the node representations, resulting in the dynamic representation ˜Ξ ∈ RS×de . The process can be formulated as follows:
where R ∈ Rk×k are learnable parameters, k denotes the number of dynamic hyperedges.
4.5 Model output
We combine the stock representations Ξ, predefined representations ˆΞ, and dynamic representations ˜Ξ using a weighted sum:
where w1, w2, w3 ∈ R are learnable weights. The final representations ˆZ ∈ RS×de are used to predict the return ratio for each stock via 2-layer MLP with ReLU activation. The loss function is defined as the RMSE between the ground truth return ratio r and the predictions ˆ r.
The effectiveness of this methodology will be demonstrated and validated in the subsequent experimental sections.
5 Experiments
In this section, we conduct experiments to answer the following three research questions:
RQ1. How does the performance of our proposed approach compare with state-of-the-art methods?
RQ2. Does our approach effectively capture tail dependencies?
RQ3. Is dynamic hypergraph learning effectively integrated and implemented in our approach?
Additional details and results (including ablation study) from our numerical studies are provided in the supplementary materials and are also available in our online repository at https: //github.com/kijeong22/ijcai2025-spf.
5.1 Experimental Setup
Dataset. To evaluate our model, we used real-world S&P500 market data, adapting the data collection and construction methods from [Huynh et al., 2023]. Adjustments were made to the data period, stock count, and phase structure to account for differences in historical data. Specifically, stocks not listed in earlier years were excluded, reducing the dataset to 463 stocks. The dataset was divided into 10 phases, each comprising a 24-month training period, a 4-month validation period, and an 8-month test period.
Implementation Details. Our model was implemented in PyTorch, and all experiments were conducted on an NVIDIA RTX A6000 GPU. To identify the optimal hyperparameters, we employed grid search and the best hyperparameters were selected based on the validation-averaged IC across all phases, resulting in model size de = 32, the number of dynamic hyperedges k = 64, and learning rate = 0.0001. The lookback window was set to 20 days, the lookforward window to 5 days, and the number of heads in the multi-head attention mechanism to 4. For the trading simulation, we adopt a top-K daily buy-hold-sell trading strategy used in [Feng et al., 2019a], setting K = 20.
Metrics. The evaluation metrics are categorized into predictive performance and portfolio performance. For predictive performance, we use Information Coefficient (IC), Rank Information Coefficient (RankIC), and Precision@K (Prec@K) to evaluate the alignment, ranking accuracy, and top-K precision of predictions, respectively. Portfolio performance metrics include Return, Sharpe Ratio (SR), and Maximum Drawdown (MDD), which assess profitability, riskadjusted return, and maximum loss during the investment period.
Baselines. We compare our model with state-of-the-art models from three categories: Transformer-based models, Graph-based models, and Hypergraph-based models. These include DTML [Yoo et al., 2021] and MASTER [Li et al., 2024] for Transformer-based models, RSR [Feng et al., 2019a] and RT-GCN [Zheng et al., 2023] for Graph-based models, and STHAN-SR [Sawhney et al., 2021] and ESTIMATE [Huynh et al., 2023] for Hypergraph-based models.
5.2 RQ1 - Overall Performance
Table 1 presents the predictive performance of all comparison models across phases and their overall average. Most baselines were evaluated using their original configurations and the same loss function for fairness. However, DTML, designed for the classification of stock movements, employed RMSE as its loss function to align with the evaluation metrics. Our proposed model demonstrates superior performance in most phases compared to other baselines, and its overall average scores for IC, RankIC, and Prec@10 also outperform all other models. For ESTIMATE, the IC and RankIC scores are the highest in phases 2 and 4, and its average values across all metrics are the best among the baselines. This can be attributed to its architecture, which not only shares structural similarities with our model but also utilizes a predefined hypergraph for learning higher-order relationships. Table 2 presents the average portfolio performance of all comparison models across phases. Our proposed model consistently outperforms others in Return, SR, and MDD. Notably, SR and MDD, which reflect portfolio risk, highlight the capability of our model to capture abrupt stock movements and construct a stable portfolio throughout the trading period.
5.3 RQ2 - Lower Tail Dependence Coefficient
We evaluate the Lower Tail Dependence Coefficient (LTDC), which measures the tendency of simultaneous extreme downward movements, a critical factor influencing investor behavior and portfolio performance [Sibuya and others, 1960; Ang et al., 2006]. LTDC [Joe, 1997] is defined as follows:
where i and j denote stock indices, and F -1 (q) is the inverse cumulative distribution function. We compute LTDC for all stock pairs to construct a |S| × |S| stock LTDC matrix. To calculate LTDC, we use the empirical cumulative distribution function due to its simplicity and effectiveness in handling sample data without assuming a specific distribution.
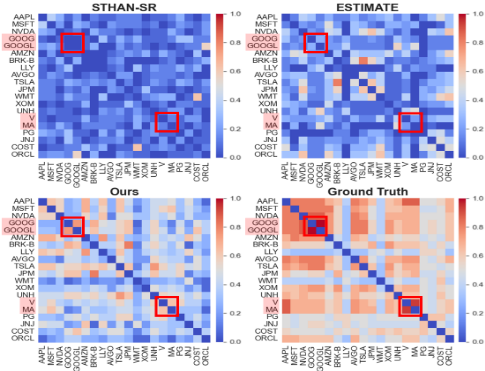
Figure 3 shows the LTDC matrix for phase 8, visualizing the top 20 companies by market capitalization. Our model relatively closely matches the ground truth, successfully capturing relationships, such as the near-identical movements of GOOG and GOOGL (same company) and the highly correlated stocks V and MA (with an almost identical business model). In contrast, the other two models fail to capture these relationships, demonstrating the effectiveness of designing the intensity function of the Hawkes process as a separate layer in accurately modeling LTDC.
5.4 RQ3 - Analysis of the Dynamic Hypergraph Structure
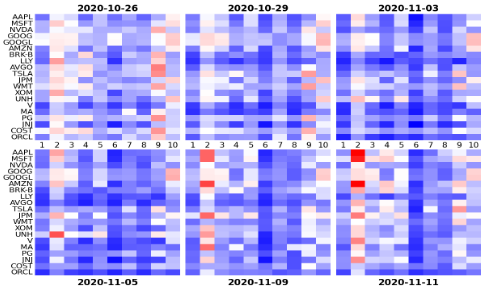
We analyze the dynamic hypergraph structure in our model, as shown in Figure 4, focusing on the top 20 companies by market capitalization and 10 hyperedges. To enhance visualization, values are scaled within the corresponding period, with blue indicating weaker connections and red stronger connections. Note that these colors represent relative edge strength, not full connectivity or disconnection.
| Model | Phase #1 | Phase #2 | Phase #3 | Phase #4 | Phase #5 | Phase #6 | Phase #7 | Phase #8 | Phase #9 | Phase #10 | Mean | |
|---|---|---|---|---|---|---|---|---|---|---|---|---|
| Transformer | DTML MASTER | 0.003 0.029 | 0.013 0.005 | 0.018 0.018 | 0.025 0.006 | -0.003 -0.005 | -0.010 0.038 | 0.012 0.038 | 0.028 0.010 | 0.010 -0.032 | -0.021 0.022 | 0.008 0.013 |
| IC Graph | RSR-E RSR-I RT-GCN | 0.003 0.025 0.030 | 0.013 0.014 0.021 | 0.008 0.025 0.016 | 0.022 0.020 -0.014 | 0.012 0.025 0.019 | 0.040 0.041 0.004 | 0.005 0.031 0.024 | 0.031 0.004 0.054 | 0.004 0.008 -0.005 | -0.004 0.028 -0.013 | 0.013 0.022 0.014 |
| Hypergraph | STHAN-SR ESTIMATE | -0.003 0.040 | -0.002 0.072 | 0.019 -0.030 | -0.001 0.053 | 0.009 -0.009 | 0.011 0.032 | 0.015 0.051 | 0.021 -0.002 | 0.023 -0.003 | 0.022 0.025 | 0.011 0.023 |
| Ours | 0.057 | 0.087 | 0.001 | 0.037 0.034 | 0.033 | 0.035 | 0.102 | -0.005 | 0.052 | -0.028 | 0.037 | |
| Transformer | DTML MASTER | 0.014 | 0.022 | 0.028 | 0.001 | -0.003 | -0.021 | 0.020 0.036 | 0.030 0.007 | 0.021 -0.038 | -0.017 0.027 | 0.013 0.014 |
| Graph | RSR-E RSR-I RT-GCN | 0.031 0.016 | 0.020 | 0.025 0.024 | -0.004 0.027 | -0.003 | 0.037 | 0.013 | 0.015 0.001 | 0.016 0.013 -0.039 | -0.01 0.031 0.025 | 0.013 0.024 0.006 |
| RankIC | 0.029 0.027 | 0.016 0.021 -0.005 | 0.038 0.001 | 0.005 | 0.008 0.030 0.033 | 0.033 0.030 -0.018 | 0.025 0.025 | 0.005 | ||||
| Hypergraph | STHAN-SR ESTIMATE Ours | 0.003 0.044 0.045 | -0.007 0.079 0.077 | 0.008 -0.014 -0.001 | -0.009 0.045 0.041 | 0.026 0.002 0.055 | 0.016 0.028 0.030 | 0.018 0.070 0.114 | 0.027 -0.015 -0.005 | 0.029 0.003 0.060 | -0.010 0.035 -0.027 | 0.010 0.028 0.039 |
| Transformer | DTML | 0.533 | 0.562 | 0.491 | 0.582 | 0.521 0.547 | 0.602 0.590 | 0.620 0.643 | 0.549 | 0.569 | 0.605 | 0.563 |
| Graph | MASTER | 0.537 0.577 | 0.528 | 0.588 | 0.527 | 0.574 0.545 | 0.569 0.514 | 0.588 | 0.544 | 0.548 | 0.610 | 0.568 |
| RSR-E | 0.564 | 0.494 | 0.480 | 0.571 | 0.559 | 0.554 | 0.553 | |||||
| Prec@K | RSR-I RT-GCN | 0.568 0.529 | 0.568 0.529 | 0.550 0.592 | 0.604 0.551 | 0.600 | 0.548 | 0.565 0.660 | 0.501 0.576 | 0.544 0.534 | 0.518 0.571 | 0.545 0.569 |
| Hypergraph | STHAN-SR | 0.572 | 0.525 | 0.504 | 0.499 | 0.510 | 0.517 | 0.566 | 0.562 | 0.562 | 0.496 | 0.531 |
| ESTIMATE | 0.565 | 0.537 | 0.543 | 0.595 | 0.630 | 0.589 | 0.685 | 0.587 | 0.548 | 0.484 | 0.576 | |
| Ours | 0.555 | 0.582 | 0.581 | 0.604 | 0.643 | 0.614 | 0.720 | 0.616 | 0.562 | 0.544 | 0.602 |
| Model | Return↑ | SR↑ | MDD↓ |
|---|---|---|---|
| DTML | 0.794 | 3.167 | 0.571 |
| MASTER | 0.726 | 2.695 | 0.594 |
| RSR-E | 0.573 | 2.633 | 0.537 |
| RSR-I | 0.771 | 3.006 | 0.639 |
| RT-GCN | 0.796 | 3.121 | 0.492 |
| STHAN-SR | 0.648 | 2.951 | 0.478 |
| ESTIMATE | 0.723 | 2.905 | 0.613 |
| Ours | 0.798 | 3.391 | 0.474 |
We focus our analysis on AAPL and MSFT, both of which are global leaders driving market trends. In October 2020, both were relatively strongly connected to Hyperedge 2 and 10, but after the U.S. presidential election on November 3, 2020, their connections to other hyperedges weakened, while their connection to Hyperedge 2 strengthened significantly. Similar patterns were observed for other major companies such as AMZN, BRK-B, UNH, and JPM. These observations demonstrate the dynamic hypergraph's ability to effectively capture evolving inter-stock relationships across different time steps. Additionally, companies like GOOG-GOOGL and V-MA remain consistently connected to the same hyperedge across multiple time steps, showing that dynamic hypergraph captures temporal dynamics while still preserving domain knowledge by similar companies.
6 Conclusions
In this paper, we proposed a novel model for accurate stock price forecasting by capturing the dynamic and higher-order relationships. The model incorporates a Hawkes process layer to identify shared movement patterns and enhance temporal representations. Furthermore, by both predefined and dynamic hypergraphs, the model effectively captures higherorder relationships among stocks. Extensive experiments conducted on real-world US market data demonstrated the model's superiority over state-of-the-art approaches in terms of predictive performance and portfolio stability. Additionally, the effectiveness of the proposed components was validated through detailed analyses. In future works, we will focus on enhancing the robustness of the model, particularly during periods of unstable performance, to achieve consistent reliability across diverse market conditions.
Acknowledgments
This work was supported by the National Research Foundation of Korea grant [NRF-2022R1A4A3033874, NRF2022R1F1A1074758, RS-2022-NR068754]. This work is also supported by a grant from the Korean Ministry of Environment through Environmental Health R&D Program [2021003310005]. The authors acknowledge the Urban Big data and AI Institute of the University of Seoul supercomputing resources (http://ubai.uos.ac.kr) made available for conducting the research reported in this paper.
@inproceedings{ijcai2025p673,
  title     = {Dynamic Higher-Order Relations and Event-Driven Temporal Modeling for Stock Price Forecasting},
  author    = {Park, Kijeong and Hong, Sungchul and Jeon, Jong-June},
  booktitle = {Proceedings of the Thirty-Fourth International Joint Conference on
               Artificial Intelligence, {IJCAI-25}},
  publisher = {International Joint Conferences on Artificial Intelligence Organization},
  editor    = {James Kwok},
  pages     = {6048--6056},
  year      = {2025},
  month     = {8},
  note      = {Main Track},
  doi       = {10.24963/ijcai.2025/673},
  url       = {https://doi.org/10.24963/ijcai.2025/673},
}
TY - CPAPER TI - Dynamic Higher-Order Relations and Event-Driven Temporal Modeling for Stock Price Forecasting AU - Park, Kijeong AU - Hong, Sungchul AU - Jeon, Jong-June T2 - Proceedings of the Thirty-Fourth International Joint Conference on Artificial Intelligence, IJCAI-25 PB - International Joint Conferences on Artificial Intelligence Organization PY - 2025 SP - 6048 EP - 6056 DO - 10.24963/ijcai.2025/673 UR - https://doi.org/10.24963/ijcai.2025/673 ER -Copied
Machine-readable versions of this paper, for tools and AI agents:





